Tactical Inertial Measurement Unit Thermal Bias Modeling Fundamentals
Tactical IMU thermal bias modeling requires combining static higher-order polynomials with real-time temperature derivative terms to eliminate dynamic lag errors.

Strain
Mechanical deformation across silicon sensor dies introduces uncompensated zero-g offset drift during environmental temperature transitions. Thermal gradients skew sensor output. Silicon spring constants change.
In tactical MEMS gyroscopes and accelerometers, thermal bias instability originates from mismatches in thermal expansion coefficients between the sensing element, the die-attach substrate, and the protective ceramic packaging. When ambient temperature fluctuates, mechanical stress propagates through the package anchor points into the micromechanical proof mass suspension beams. This physical strain alters the natural resonant frequency of drive and sense structures, creating output shifts that mimic real angular rotation or linear acceleration.

Thermomechanical Stress Sources in Silicon Resonators
Silicon proof masses depend on balanced spring constants to hold zero-rate output baseline. Differential thermal expansion between the monocrystalline silicon die and the surrounding alumina ceramic carrier generates internal stress fields across the sensor plane. As temperature shifts, these stress fields alter the piezoresistive and capacitive baseline properties of the transduction mechanism.
Internal sensing cores experience localized bending moments, shifting capacitive comb finger gaps by nanometer fractions. Under tactical operating environments spanning minus forty degrees Celsius to plus eighty-five degrees Celsius, mechanical strain shifts the zero-bias offset beyond acceptable drift thresholds for dead-reckoning navigation.
Silicon anchor geometric symmetry reduces linear thermal bias shift while leaving spatial gradient sensitivity unmitigated.
Package stress propagation pathways vary depending on die-attach material compliance. Rigid glass-frit bonding transfers package stress directly to the silicon frame, accelerating zero-bias shift. Compliant silicone or epoxy adhesives dampen structural stress transfer but introduce thermal creep and time-dependent hysteresis into the bias baseline.
Transient heating causes bias shifts.
Thermal Gradient Cross-Sensitivities
Temperature variations across a sensing die create unequal expansion between structural anchor points. Spatial thermal gradients across a four-millimeter silicon die induce asymmetric beam deflection that steady-state temperature calibration fails to cancel. When an internal ASIC generates localized heat on one side of the sensor cavity, thermal conduction through the silicon substrate creates a transient differential temperature field across the sensing comb fingers.
- Asymmetric anchor bending causes zero-rate output drift in MEMS gyroscopes when board expansion imposes mechanical shear on sensor packagings.
- Piezoresistive stress coupling alters baseline current balance in internal bridge structures through differential expansion of protective epoxy encapsulants.
- Capacitive gap distortion shifts comb finger baseline separation during thermal transients, producing false acceleration signals in sensing electronics.
- Substrate CTE mismatches generate localized warping across ceramic carrier interfaces that manifests as dynamic bias drift under rapid ramp rates.
Stress relief shifts sensor offset. Thermal gradient dynamics scale with the rate of ambient temperature change, generating bias errors proportional to thermal flux rather than absolute temperature alone. Neglecting thermomechanical stress paths during packaging design forces calibration software to model spatial gradients that vary unpredictably across operational life.

Polynomial
Mathematical equations mapped to physical sensor telemetry capture steady-state bias variation across specified temperature ranges. Calibration routines model thermal bias by expressing zero-input sensor offset as a function of measured temperature readings taken from internal sensor diodes or adjacent thermistors. Calibration equations correct baseline errors.
Selecting the model order determines the residual bias error floor across the operational thermal window.

Static Higher-Order Curve Fitting Models
Third-order power series formulations accurately capture non-linear bias shifts in tactile MEMS sensors operating between minus forty and plus eighty-five degrees Celsius. Static models represent the thermal bias offset through power series expansions where temperature serves as the independent variable. High order models risk oscillation.
Expanding polynomial models beyond the fifth order introduces Runge phenomenon numerical instabilities at thermal extremes, widening compensation residuals at range boundaries.
| Model Type | Mathematical Form | Cal Time per Unit (min) | RMSE Residual Bias (deg/hr) | Firmware Memory (bytes) |
|---|---|---|---|---|
| 1st-Order Linear | B(T) = a0 + a1 T | 15 | 1.20 | 32 |
| 3rd-Order Surface | B(T) = sum(a_i T^i) | 45 | 0.15 | 64 |
| 5th-Order Surface | B(T) = sum(a_i T^i) | 90 | 0.08 | 128 |
| Dynamic Derivative | B(T,dT) = B(T) + c1 (dT/dt) | 120 | 0.02 | 256 |
| Performance metrics recorded using tactical-grade MEMS gyroscope dies over a temperature ramp rate of two degrees Celsius per minute from minus forty to plus eighty-five degrees Celsius. | ||||
Static polynomial models assume immediate thermal equilibrium between the temperature sensing element and the micromechanical proof mass. Fast ramps create internal stress. When ambient temperature changes rapidly, thermal lag between the internal temperature diode and the mechanical resonator creates a phase delay, producing a dynamic bias hysteresis loop.

Dynamic Temperature Rate Derivatives
Rate of thermal change introduces transient offsets that steady-state lookup tables fail to suppress. Dynamic compensation models augment static polynomial terms with temperature time derivatives. Introducing a differential thermal coefficient accounts for heat flow rates across internal package interfaces.
Temperature sensors require local placement.
Adding first-order time derivatives of temperature to polynomial bias equations cuts transient thermal drift by eighty-five percent during rapid thermal shock conditions.
Integrating first-order temperature derivative terms corrects for spatial heat gradients generated during power-on thermal self-heating. Combined static and dynamic formulations express output bias as a sum of steady-state polynomial values and time-derivative scaling factors. Higher mathematical model order increases calibration matrix inversion instability without improving out-of-band noise performance.

Soaking
Environmental chamber profiles force complete thermal equilibrium across internal sensing cores before calibration data recording begins. Thermal stability requires time. Characterizing tactical IMU thermal bias demands controlled thermal profile execution inside temperature chambers equipped with rate tables and low-noise data acquisition channels.
Soaking profiles establish baseline static bias points, while continuous thermal sweeps quantify dynamic thermal derivative coefficients.
Thermal Chamber Ramp Rate Selection
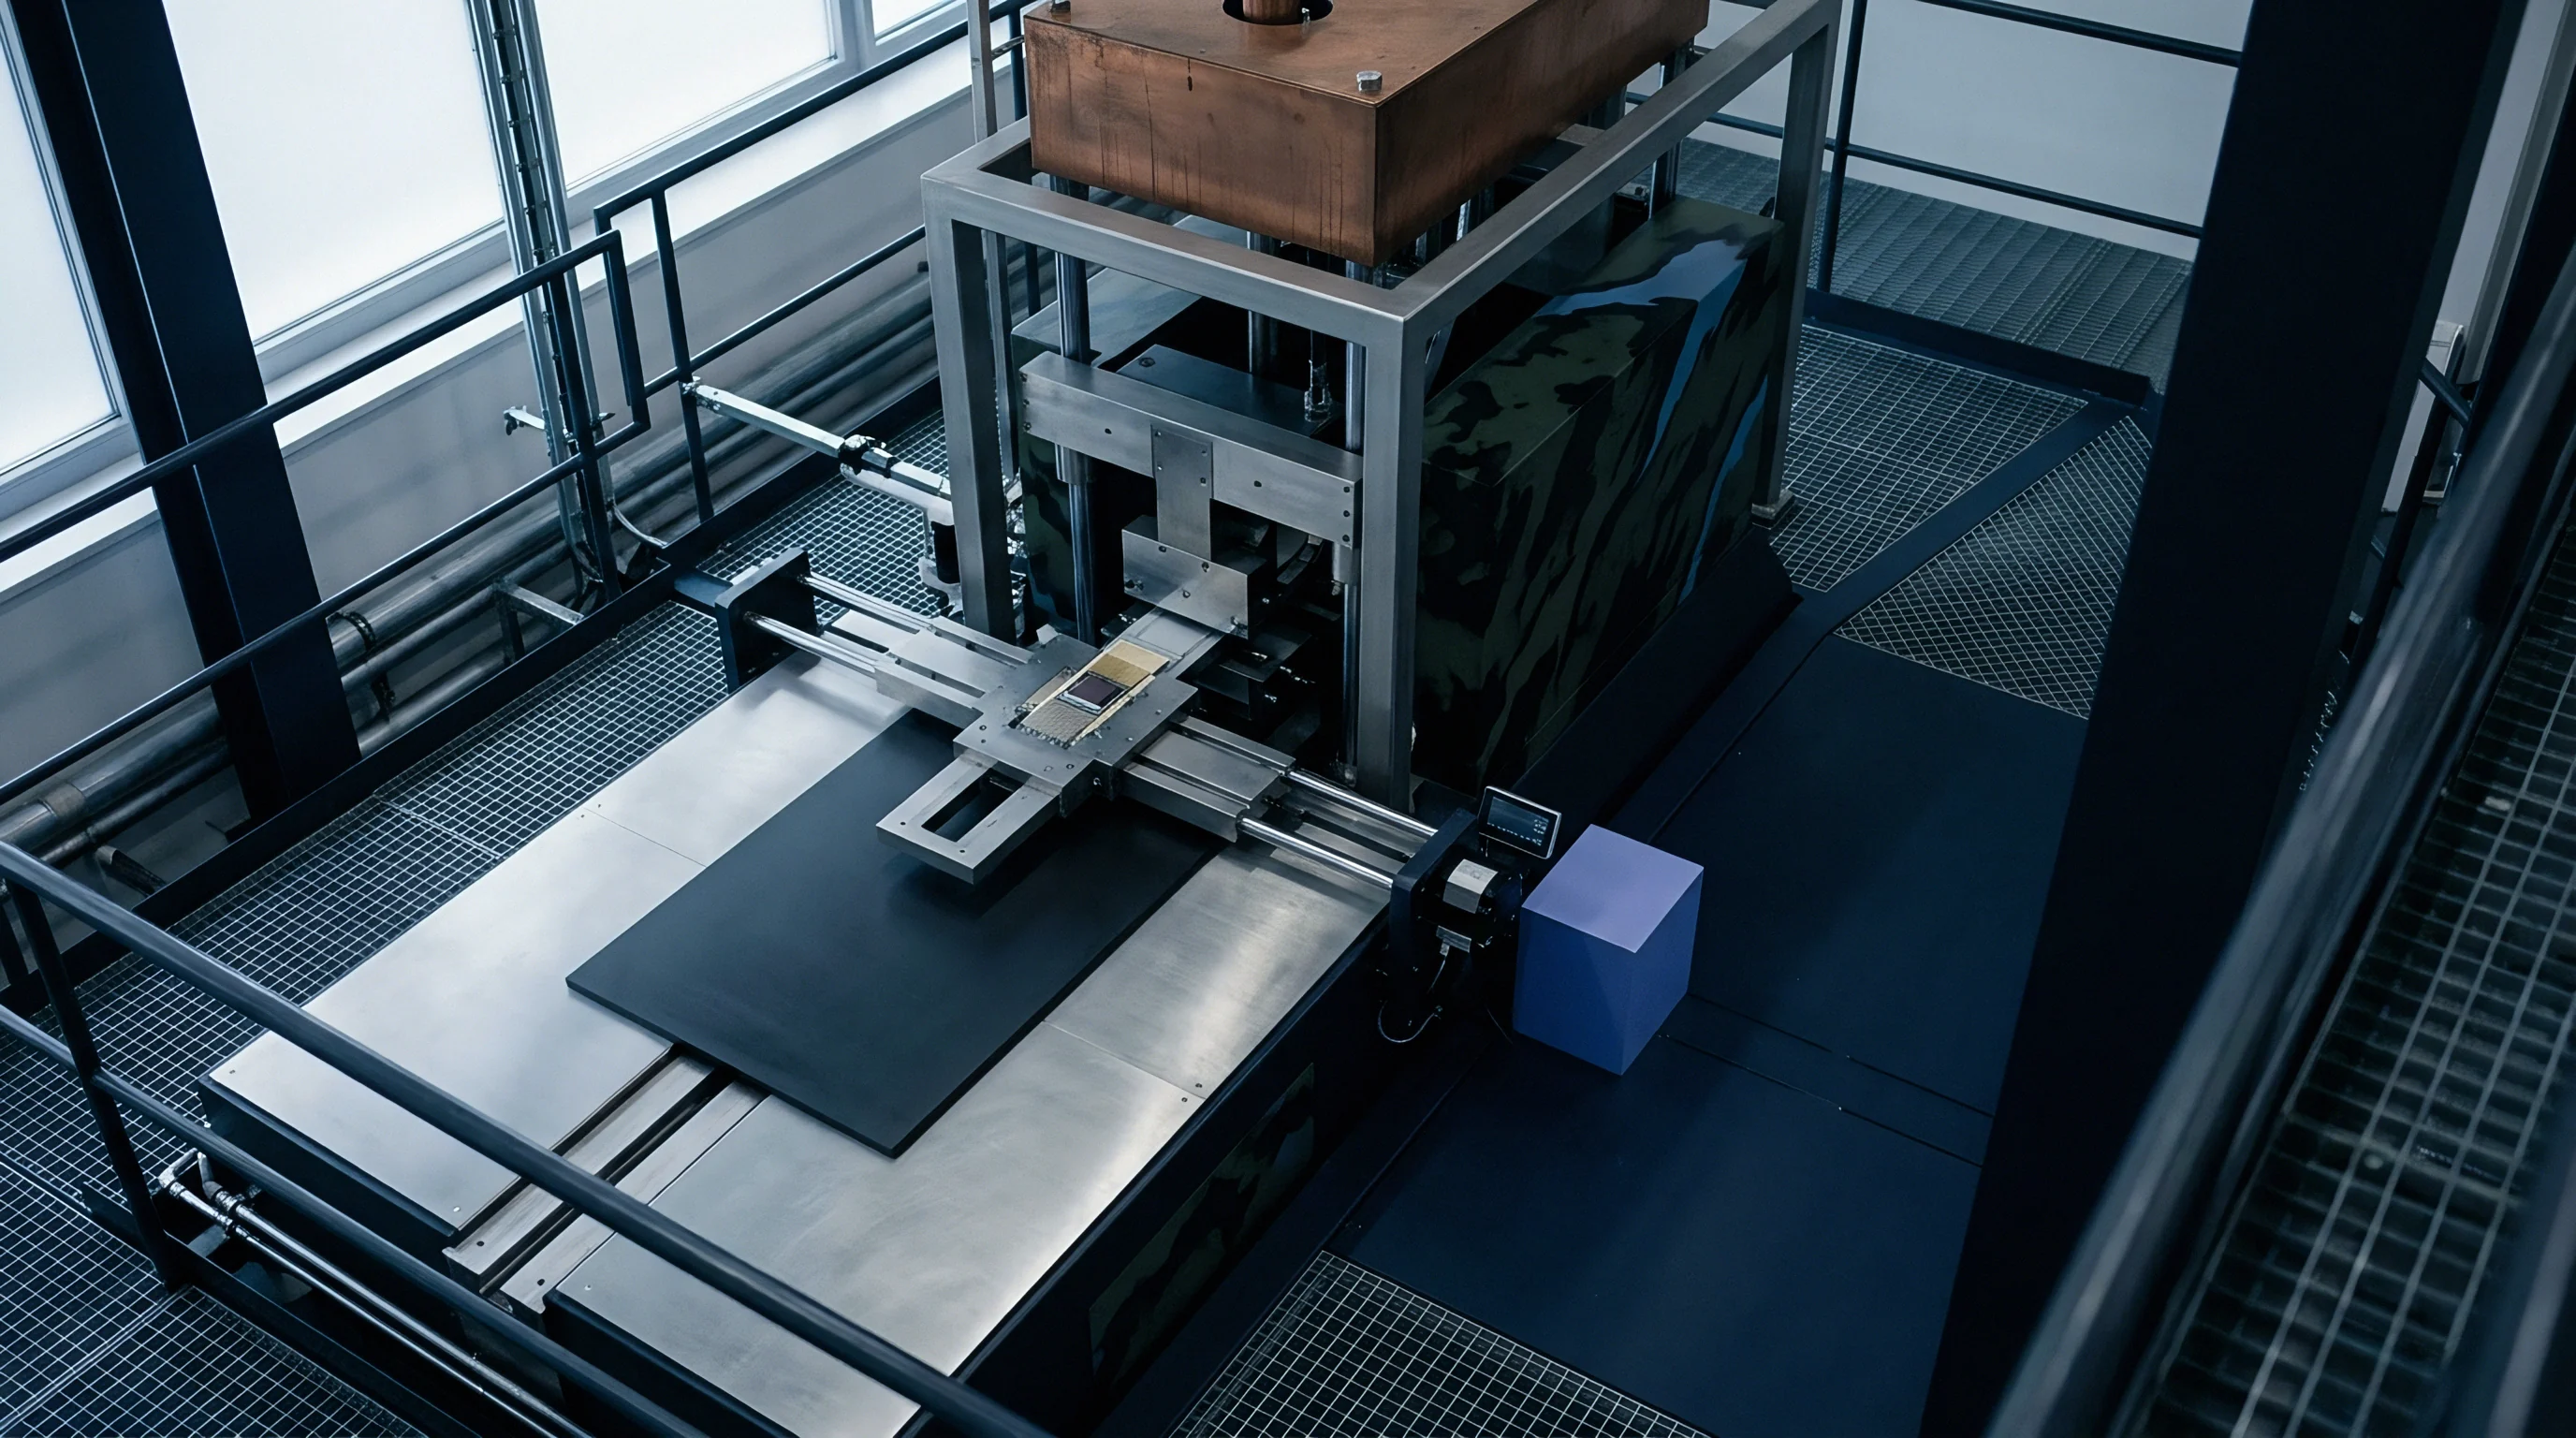
Slow thermal trajectories prevent internal structural temperature gradients from distorting static calibration coefficients. Ramp rates maintained between one-half degree and two degrees Celsius per minute allow internal package structures to track chamber ambient temperatures without generating artificial spatial stress. Accelerating thermal ramp rates beyond five degrees Celsius per minute introduces dynamic thermal lag that corrupts static polynomial fitting routines.
Hysteresis limits model accuracy. Similar structural lag phenomena govern bulk-optic ring laser gyroscopes and interferometric fiber optic gyroscopes, where thermal diffusion across glass cores and fiber spools generates transient non-reciprocal path length phase shifts analogous to die-attach mechanical strain.
- Mount tactical inertial units onto thermally isolated fixtures inside environmental test chambers with multi-channel telemetry active.
- Lower chamber temperature to minus forty degrees Celsius and maintain setpoint until internal sensor temperatures stabilize within one-tenth degree Celsius for thirty minutes.
- Ramp temperature upward at one degree Celsius per minute while logging raw rate, acceleration, and die-level temperature measurements at one hundred hertz.
- Hold maximum temperature at plus eighty-five degrees Celsius until core temperature readings maintain absolute stability across a fifteen-minute window.
- Cool chamber to minus forty degrees Celsius at identical ramp rates to complete a full thermal hysteresis loop for residual error evaluation.

Thermal Hysteresis Quantification Techniques
Reversible mechanical stresses inside package sealants create distinct bias curves during heating and cooling cycles. Quantifying hysteresis involves measuring the area enclosed between increasing and decreasing temperature bias plots. Core thermal lag delays response.
Polymer adhesives exhibit viscoelastic relaxation, causing cold-to-hot bias transitions to diverge from hot-to-cold baseline values.
IEEE Standard 952 specifies multi-point temperature stabilization windows to isolate static sensor thermal sensitivity from dynamic structural lagging.
Evaluating residual bias hysteresis dictates whether host compensation algorithms require separate rising and falling temperature lookup coefficient sets. Packaging vendors frequently attributes residual hysteresis to internal stress relief in die-attach adhesives rather than uncalibrated assembly torque.

Pipeline
Host processing units execute bias correction equations prior to feeding corrected angular rates and linear accelerations into orientation filters. Dynamic real-time compensation loops run on embedded signal processors, reading internal temperature telemetry at fixed frame rates. Latency between internal temperature sampling and inertial measurement calculation introduces velocity and heading integration errors.
What Thermal Sampling Rates Preserve Filter Convergence?
Sampling die temperature sensors at ten hertz provides sufficient bandwidth for tracking physical environmental changes without cluttering signal processors. High-bandwidth temperature sampling ensures fast tracking of thermal transients caused by localized electrical power spikes. Filtering raw temperature telemetry with low-pass digital filters prevents high-frequency quantization noise from entering the bias compensation loop.
Thermal update intervals running slower than physical sensor response times introduce step-change transients into navigation velocity vectors.
Over-filtering temperature telemetry delays thermal transition tracking, corrupting dynamic rate derivative calculations. Optimal digital filter design balances high-frequency noise suppression against group delay across expected operating thermal gradients.

Fixed Point Processing and Quantization Noise
Embedded microcontrollers with single-precision floating point units generate numerical truncation residual errors during higher-order matrix operations. Fixed point math truncates precision. Evaluating high-order temperature polynomials using fixed-point arithmetic risks dynamic range truncation, resulting in quantization step discontinuities in output angular rate streams.
Residual bias limits system accuracy. Implementing Horner’s scheme for polynomial evaluation minimizes arithmetic floating-point rounding errors and decreases instruction execution cycles inside real-time interrupt routines. Whether dynamic thermal derivative compensation can fully eliminate transient bias states without requiring dedicated spatial thermal sensor arrays remains unresolved for ultra-compact tactical enclosures.

Boundary
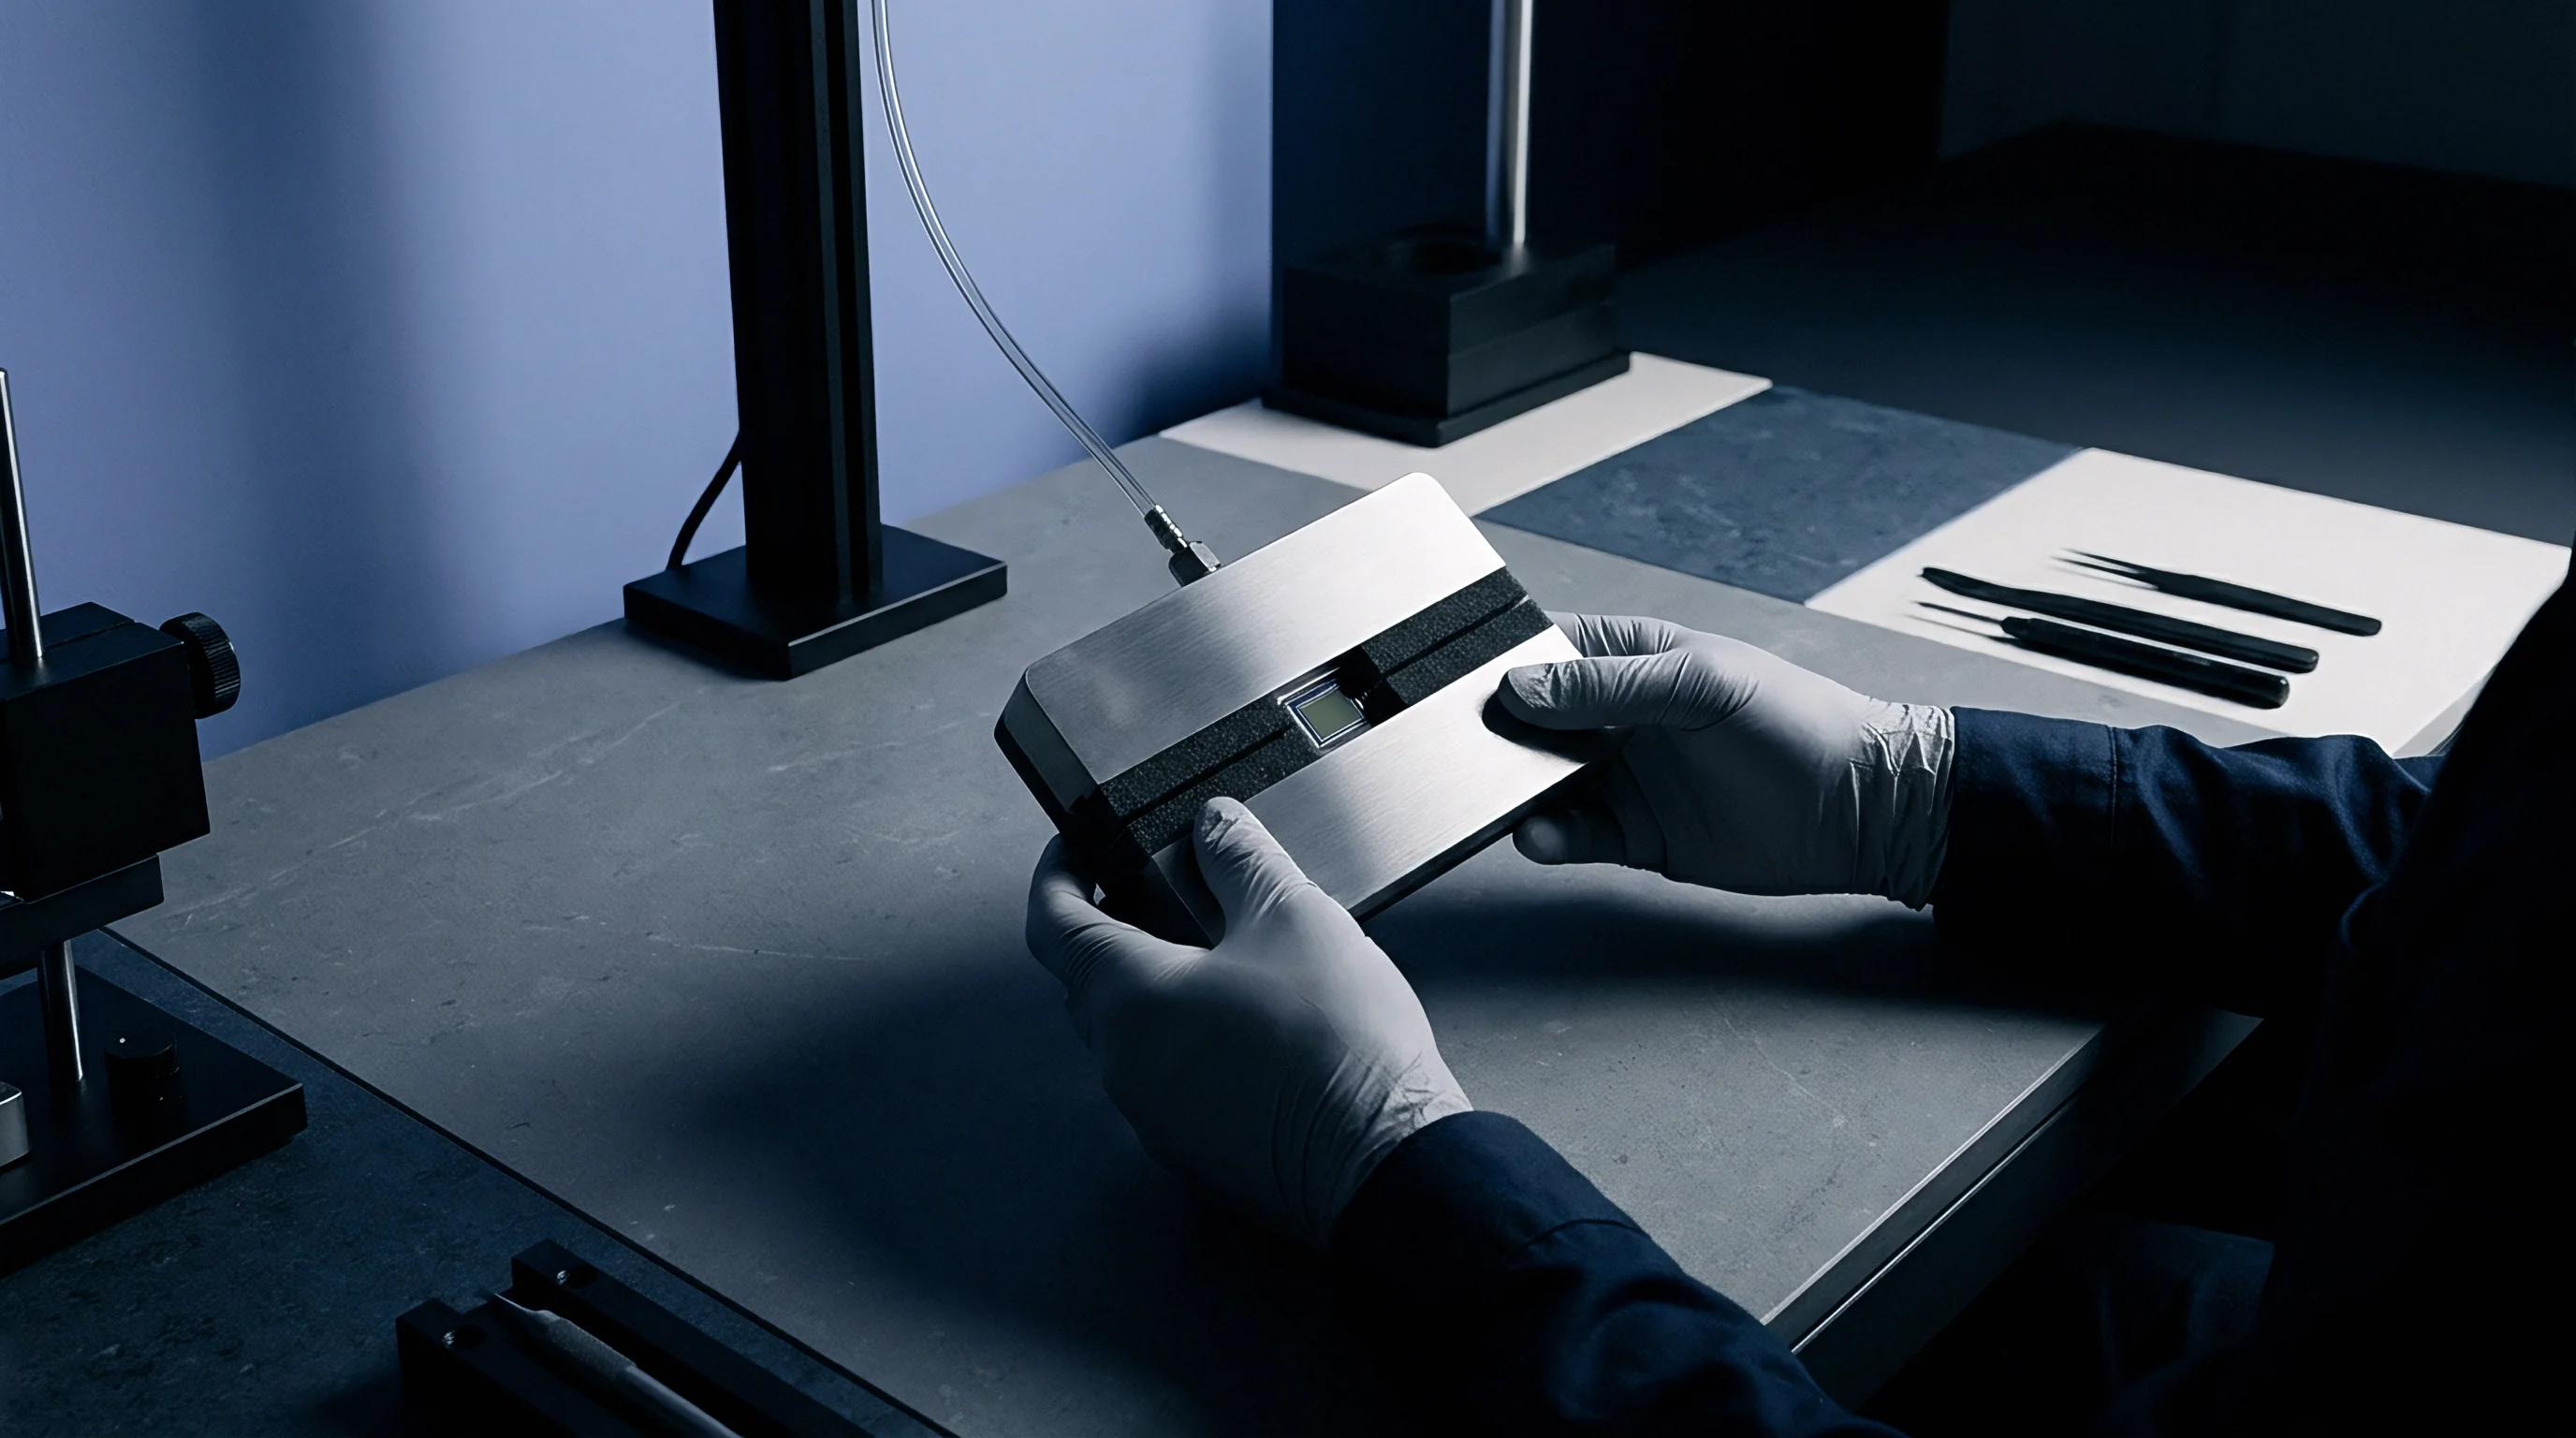
Automotive and defense qualification standards define environmental test extremes that sensors survive while maintaining calibrated performance specs. Verifying tactical IMU thermal models requires testing calibrated units against standard qualification profiles. Standards dictate maximum permissible residual drift, cold-start settling times, and thermal cycling degradation limits.
Automotive and Aerospace Qualification Standards
Test specifications set standardized thermal cycle limits that force manufacturers to validate calibration stability over product operational lifetimes. Standards define rigorous environmental stress screening sequences, specifying soak durations, temperature boundaries, and vibration conditions. Sensor performance validation requires proving residual bias compliance during active thermal ramps.
| Standard Designation | Temp Range (deg C) | Ramp Rate Limit (deg C/min) | Soak Stability Window (min) | Max Residual Gyro Bias (deg/hr) |
|---|---|---|---|---|
| AEC-Q103 Grade 1 | -40 to +125 | 5.0 | 10 | 1.00 |
| IEEE Std 952-2013 | -40 to +85 | 1.0 | 30 | 0.10 |
| MIL-STD-810H 501.7 | -51 to +71 | 10.0 | 15 | 0.25 |
Automotive standards demand continuous performance validation across extended temperature windows. Commercial aviation standards enforce strict probability boundaries on residual bias errors under un-stabilized cockpit thermal conditions.

Residual Bias Verification Criteria
Acceptance limits evaluate compensation residual bias against total navigation system error budgets. Post-calibration verification subjects units to un-modeled temperature profiles to confirm algorithm generalization capability.
- Operational temperature testing verifies sensor functionality across full specified ambient range without unexpected reset events or signal clipping.
- Thermal shock endurance evaluates physical die structural integrity when exposed to sudden temperature shifts exceeding twenty degrees per minute.
- Long-term calibration retention measures coefficient drift over repeated hundred-hour thermal exposure profiles to quantify aging behavior.
- Power-on bias repeatability tracks cold-start offset variations across varying ambient baseline temperatures to establish deterministic startup behavior.
System error budgets allocate specific drift margins to residual thermal bias error. AEC-Q103 Clause 4.2 dictates that calibration parametric retention holds after one thousand thermal stress cycles between temperature extremes.


Yield
Manufacturing volume limits determine whether production lines implement full individual unit thermal profiling or statistical batch polynomial modeling. High-volume tactical sensor manufacturing balances individual calibration accuracy gains against environmental chamber capital costs. Chamber time drives production cost.
Extended multi-temperature soaking cycles reduce line throughput, raising landed unit manufacturing costs.
Calibration Chamber Time Cost Drivers
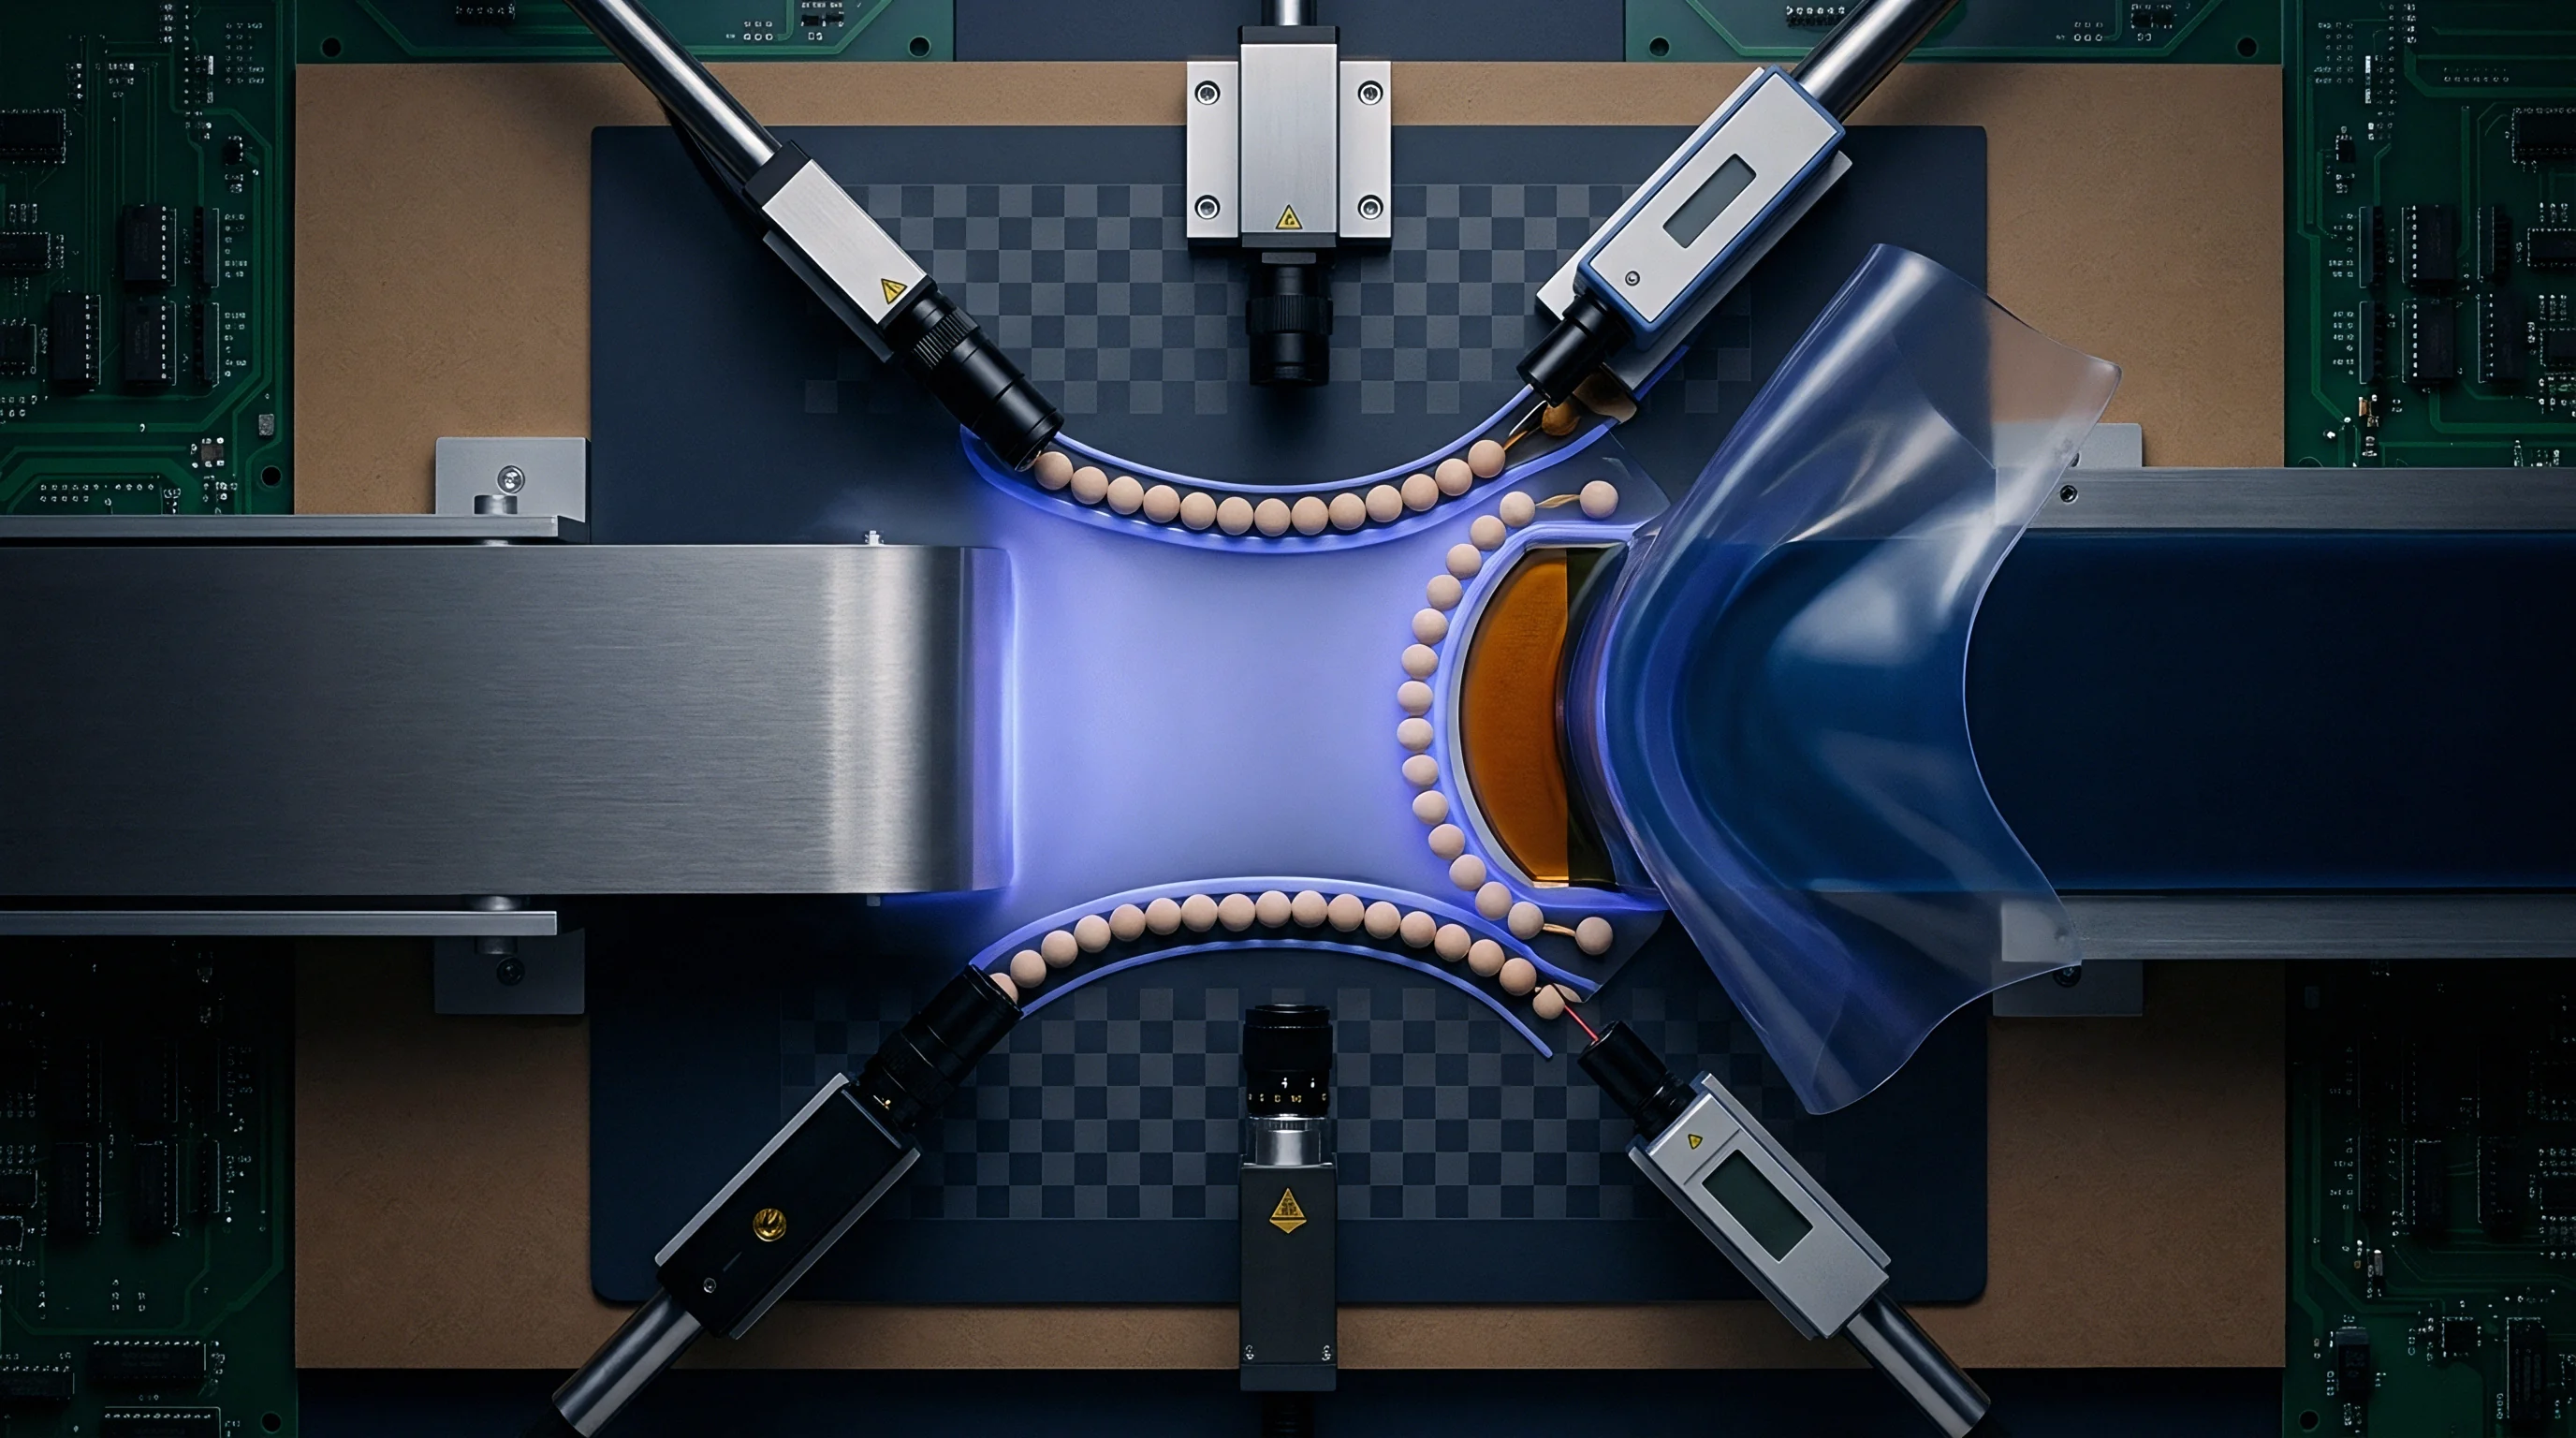
Production bottlenecks emerge when automated thermal test chambers limit daily unit output due to multi-hour soaking profiles. Environmental test chambers represent a significant capital expense in sensor packaging facilities. Reducing calibration time per unit directly expands production line capacity and lowers test cost allocations.
Wafer batches exhibit similar behavior. Running accelerated thermal ramp routines during calibration cuts test durations but increases residual bias uncertainty due to un-modeled dynamic lag effects.

Batch Modeling versus Individual Calibration
Applying averaged coefficient matrices across silicon lots reduces unit manufacturing costs while widening residual offset distributions. Batch modeling extracts statistical mean polynomial coefficients from a sample population per wafer lot. Individual unit testing generates custom polynomial matrices stored directly inside sensor non-volatile memory during factory end-of-line testing.
Wafer lot homogeneity governs batch model success. Variations in substrate thickness, package bond wire tension, and encapsulation density introduce unit-to-unit thermal response dispersion. Production managers select batch thermal compensation when system accuracy allocations allow residual drift figures above one degree per hour.