Transient Thermal Impedance Measurement in Semiconductor Die Attach Layers
Transient thermal impedance measurement isolates semiconductor die attach voids by deconvolving time-domain cooling curves into spatial structure functions.

Pulse
Electrical Test Method Mechanics
Junction temperature shifts change the forward voltage of semiconductor p-n structures linearly under constant small electrical bias. Measurement protocols defined in JESD51-1 and JESD51-14 utilize this physical dependence to capture transient thermal responses across internal packaging boundaries without physical probes. The device under test serves simultaneously as the heat generator and the temperature sensor.
A high magnitude heating current flow drives the active silicon or silicon carbide die into thermal equilibrium. Abrupt switching of this heating current down to a low magnitude measurement current initiates the cooling phase, during which the time-dependent junction voltage shift records the rate of heat dissipation out of the active die area into adjacent material layers.
The Temperature Sensitive Parameter calibration establishes the precise conversion constant between measured millivolts and actual junction temperature change in degrees Celsius. Calibration occurs inside an isothermal fluid bath or temperature-controlled thermal plate where device current stays locked strictly at the measurement level to prevent self-heating. Linear regression across temperature steps yields the temperature calibration factor, expressed in millivolts per degree Celsius.
Silicon body diodes present repeatable slope constants. Deviations from linearity over wide temperature ranges introduce measurement errors that propagate directly into calculated thermal impedance values.
| Semiconductor Device Type | Temperature Sensitive Parameter | Typical Sensitivity Factor (mV/°C) | Calibration Linearity Range (°C) | Measurement Bias Current (mA) |
|---|---|---|---|---|
| Body diode forward voltage (VSD) | 1.8 to 2.2 | 25 to 150 | 10 | |
| Body diode forward voltage (VSD) | 1.4 to 3.1 | 25 to 175 | 10 | |
| Anti-parallel diode forward voltage (VF) | 1.6 to 2.0 | 25 to 150 | 10 to 50 | |
| Reverse conduction gate-drain voltage (VGD) | 0.9 to 1.5 | 25 to 125 | 5 |
Applying the heating current for sufficient duration fills the thermal capacitance of each structural layer. Short heating duration restricts heat flux strictly within the silicon die, while longer application forces thermal saturation through the die attach interface, ceramic substrate, copper baseplate, and external cooling system. The resulting transient voltage decay curve records the cumulative thermal opposition encountered by heat spreading away from the semiconductor junction.
Fast analog-to-digital converters capture this voltage transition immediately following heating current termination.
Thermal capacitance delays interface temperature rise.
The total transient thermal impedance represents the time-dependent thermal resistance of the conduction path, calculated as the instantaneous junction temperature rise divided by the input power step magnitude. Switching electrical power cleanly within microseconds demands low-inductance load circuits. Inductive spikes created during high-current switching distort initial voltage readings, creating an electrical noise window that obscures heat conduction phenomena occurring within thin die attach layers.


Trace
Structure Functions and Spatial Deconvolution
Extracting discrete physical layer resistances demands converting raw time-domain cooling curves into spatial capacitance distribution plots. Thermal transient response curves recorded as impedance over time contain superpositions of multiple exponential time constants. Mathematical transformation converts these time-domain step responses into equivalent electrical ladder models known as Foster networks.
A Foster network consists of parallel resistor-capacitor pairs connected in series, where each RC node represents a distinct time constant within the system.
Differential structure function resolution reaches 0.01 K/W when voltage sampling rates match or exceed 1 MHz during the first 100 microseconds.
Foster models lack direct physical meaning because heat current passes through all capacitors simultaneously in the parallel configuration. Translating the Foster network into a Cauer network redistributes the network into a true ladder structure where ground-connected capacitors account for local thermal mass and series resistors model localized conductive bottlenecks. The mathematical transformation uses continued fraction expansion of the driving-point impedance function.
Plotting cumulative thermal capacitance against cumulative thermal resistance generates the structure function, revealing the sequential physical path from the active die junction out to the ambient environment.
- Signal Conditioning ~ Sample junction cooling voltage at logarithmic time increments from one microsecond up to hundreds of seconds while maintaining stable measurement bias current.
- Temperature Conversion ~ Scale the calibrated voltage curve into junction temperature decay values using the previously measured thermosensitive parameter constant.
- Impedance Normalization ~ Divide instantaneous temperature changes by the stepped electrical heating power to produce the thermal impedance step response curve.
- Time Constant Spectrum Extraction ~ Calculate the continuous thermal time constant distribution spectrum by applying numerical deconvolution algorithms to the impedance step response.
- Foster to Cauer Conversion ~ Transform the synthesized Foster circuit parameters into an equivalent Cauer ladder RC network via continued fraction synthesis.
- Structure Function Plotting ~ Integrate spatial resistance and capacitance values along the Cauer network path to construct cumulative and differential structure function profiles.
Differential structure functions highlight structural interface layers by taking the derivative of cumulative thermal capacitance with respect to cumulative thermal resistance. Peaks in the differential structure function curve correspond to regions with high thermal capacitance relative to resistance, such as copper baseplates or ceramic substrates. Valleys or sharp slope increases pinpoint thin physical interfaces with low capacitance and high resistance, most notably die attach solder or sinter layers.
Shifts in the spatial position of these peaks along the horizontal resistance axis quantify degradation or voiding in specific physical layers.
The Transient Dual Interface Method defined in JESD51-14 isolates the die attach thermal resistance from downstream package layers. Two thermal transient measurements are performed under identical electrical heating conditions, varying only the thermal interface material applied between the package case and the heatsink. The resulting transient impedance curves remain perfectly coincident through the silicon die and die attach layer, then diverge precisely at the boundary where package heat leaves the case.
The point of separation between the two differential structure function curves establishes the exact thermal resistance from junction to case, isolating internal assembly defects from external mounting variables.

Void
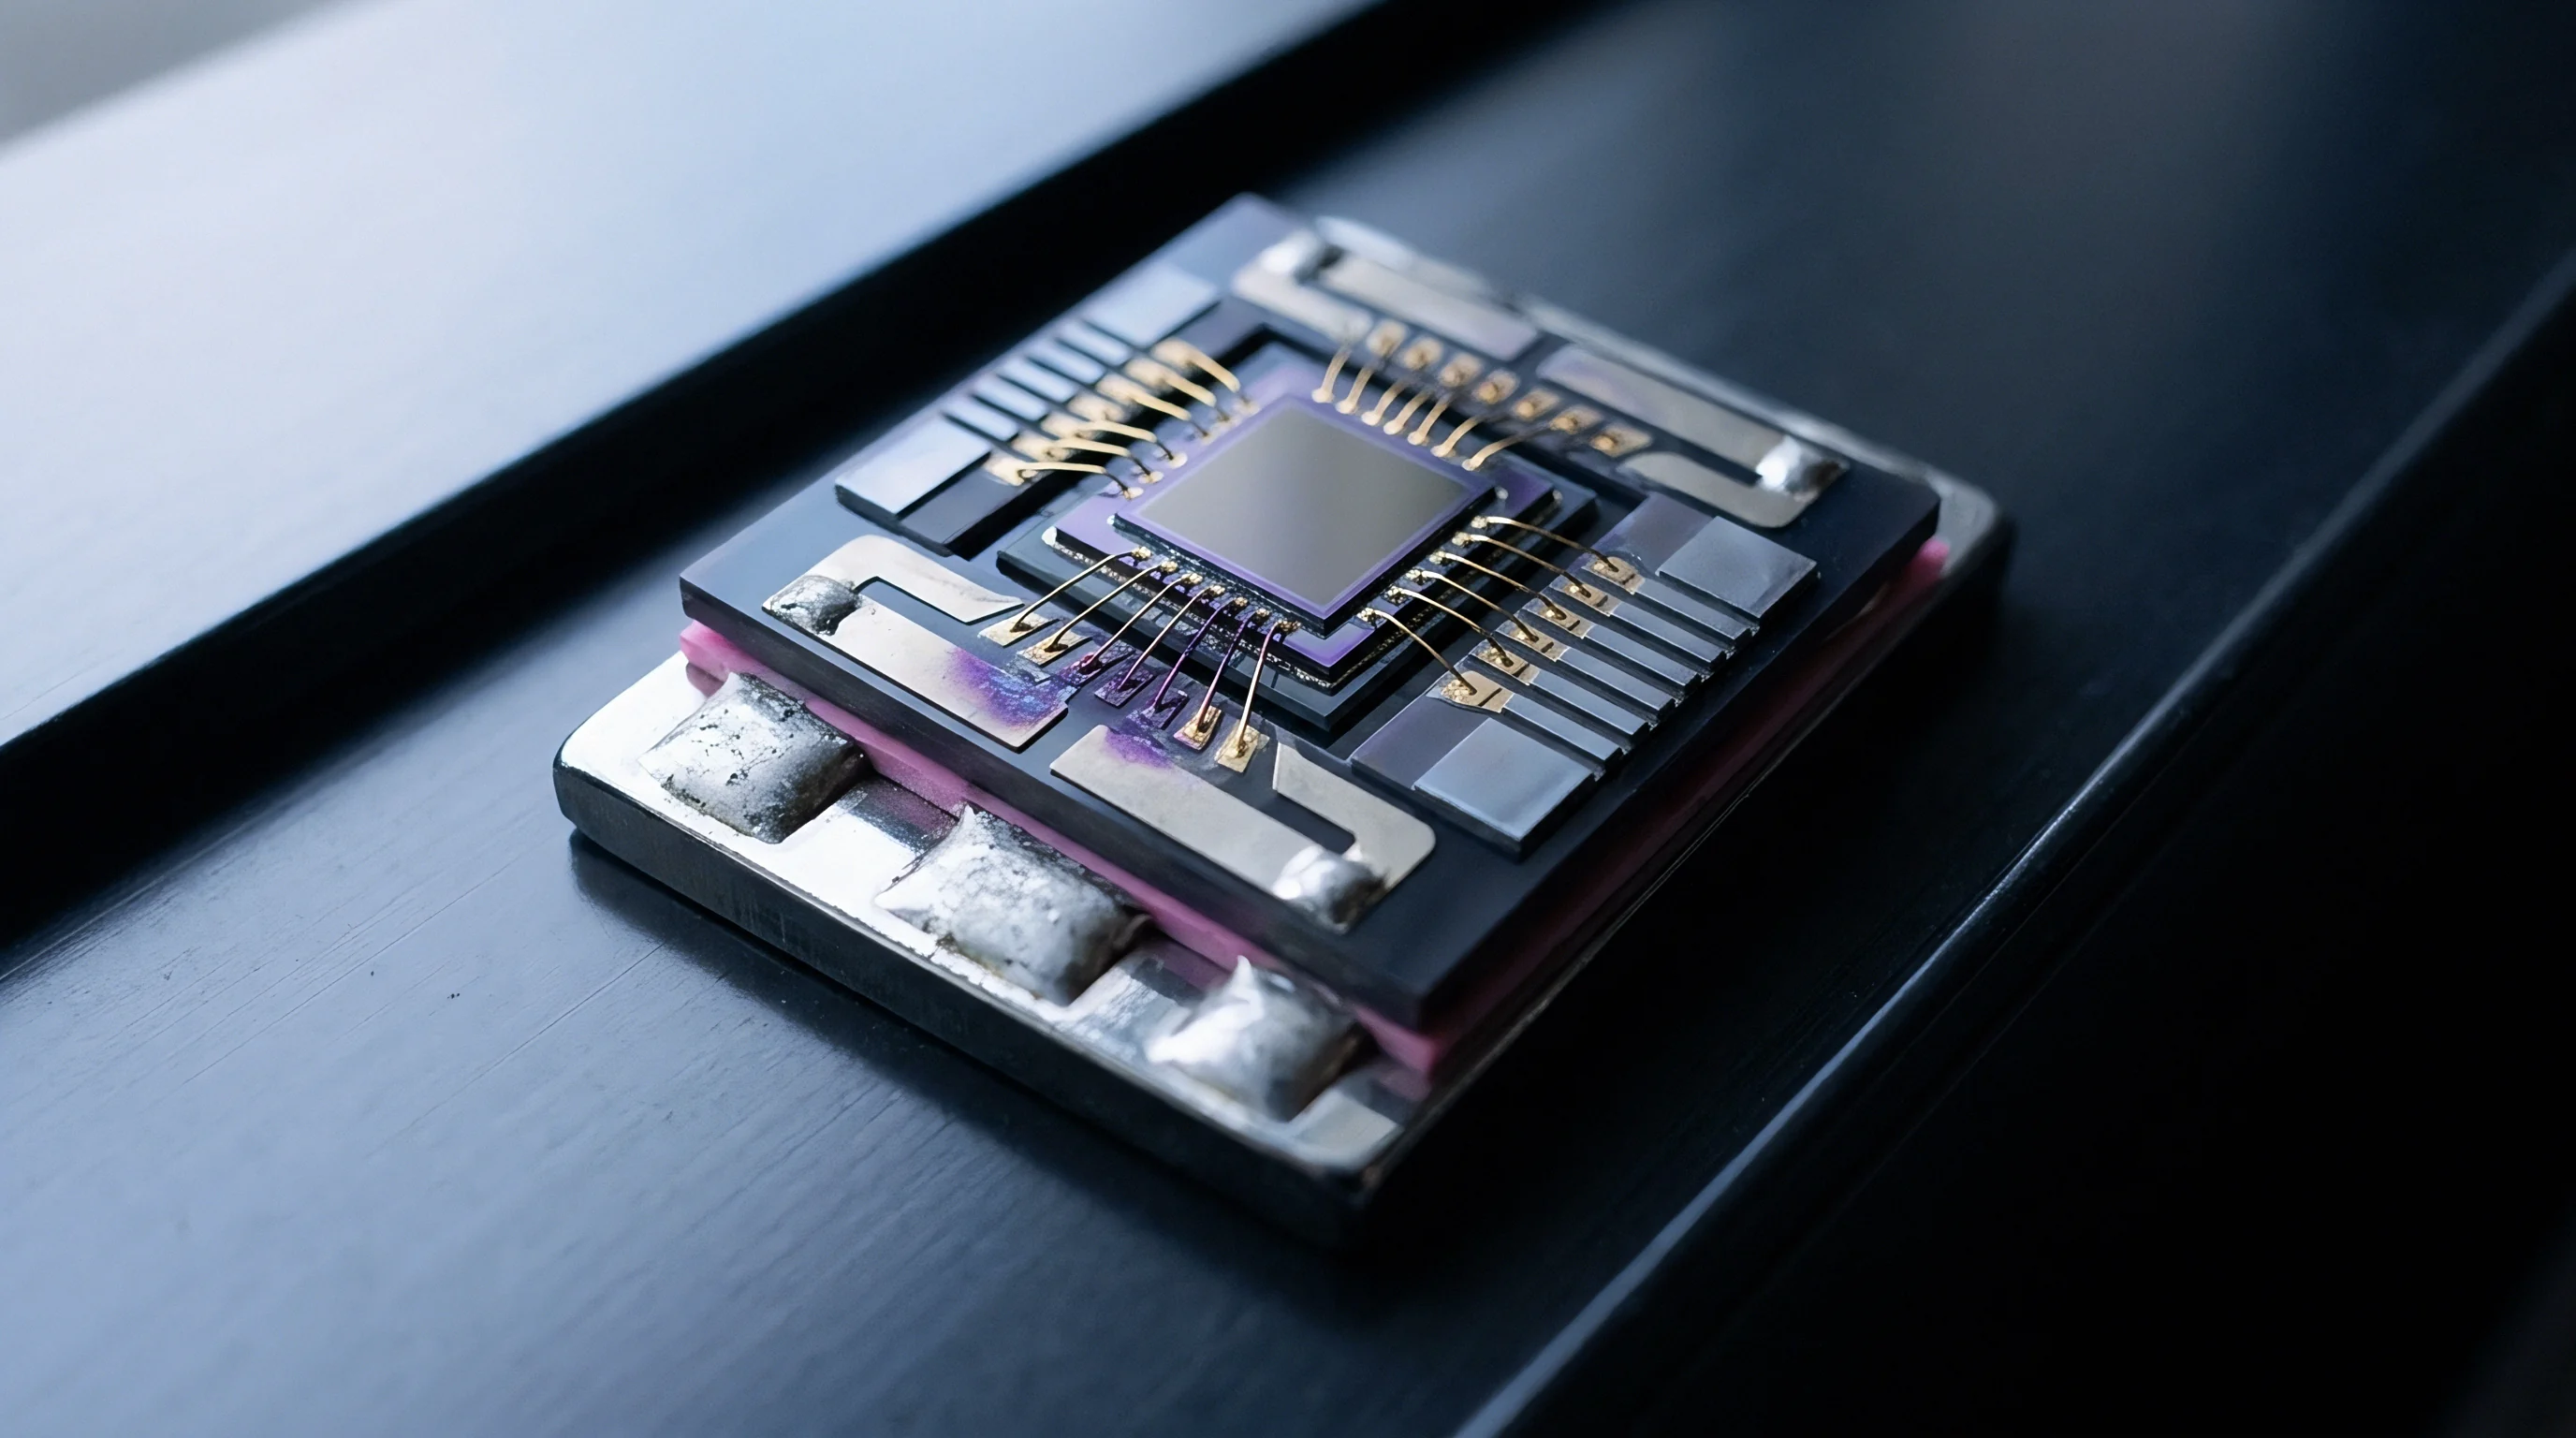
Where Does Interface Delamination Alter Thermal Path Geometry?
Discontinuities inside die attach materials alter the local heat flux vector, forcing lateral thermal spreading around non-conductive pockets. Heat generated within active silicon channels flows downwards toward the baseplate in a conical expansion profile typically modeled at a forty-five degree spreading angle. When flux lines encounter an air void or micro-crack within the solder matrix, thermal conduction stops across that unbonded area.
The heat current must detour horizontally around the perimeter of the defect, increasing localized current density and creating localized thermal resistance spikes.
Thin bond lines amplify the relative impedance impact of localized perimeter delamination compared to centered voids.
Solder voids redirect conductive flux lines. The spatial location of voiding within the die attach plane dictates the magnitude of thermal impedance rise. Microstructural voids concentrated near the outer edges of the semiconductor chip alter perimeter heat spreading, whereas central voids directly beneath high-current functional blocks create severe hot spots.
Transient thermal impedance measurement detects these defects as an artificial horizontal shift in the differential structure function curve prior to the substrate plateau, signaling reduced effective heat transfer area.
| Material Classification | Bulk Thermal Conductivity (W/m·K) | Nominal Bond Line Thickness (µm) | Baseline Interface Resistance (K·cm²/W) | Impedance Shift at 10% Voiding (%) |
|---|---|---|---|---|
| 35 | 50 to 75 | 0.15 to 0.20 | 8 to 12 | |
| 57 | 15 to 25 | 0.03 to 0.05 | 15 to 22 | |
| 120 to 150 | 10 to 20 | 0.01 to 0.02 | 25 to 35 | |
| 200 to 240 | 15 to 30 | 0.008 to 0.015 | 30 to 45 |
Die attach failure modes extend beyond gross voiding produced during assembly reflow. Thermal cycling induces mechanical stress at the interface due to coefficient of thermal expansion mismatch between silicon and direct bonded copper substrates. This cyclic fatigue drives micro-crack propagation through the solder bulk or along intermetallic bonding interfaces.
- Intermetallic Growth ~ Formation of brittle copper-tin or gold-tin intermetallic compounds increases bulk layer thermal resistivity while introducing interfacial voiding through Kirkendall effect vacancies.
- Edge Delamination ~ Thermo-mechanical stress concentration at chip corners initiates perimeter cracking that steadily progresses inward, truncating the available cross-sectional thermal path area.
- Sinter Matrix Coarsening ~ High-temperature aging causes microscopic grain growth and pore coalescence within sintered silver networks, lowering effective thermal conductivity across the bond line.
- Solder Fatigue Cracking ~ Thermal fatigue creates continuous planar fractures along maximum shear stress planes, producing significant transient thermal impedance jumps during early heating pulse timeframes.
Sintered silver achieves superior thermal conductivity. Advanced silver and copper sintering processes yield exceptionally low bond line thicknesses, making their thermal impedance contributions highly sensitive to process variations. A tiny void within a twenty-micrometer sintered silver layer represents a far greater percentage increase in thermal resistance than an identical void within a seventy-micrometer high-lead solder joint.
Skipping high-resolution transient thermal verification during process development allows undetected interface degradation to cause severe field thermal overstress, ultimately leading to catastrophic semiconductor burnout under peak power loads.


Setup

Instrumentation Signal Chains and Switching Artifacts
Capturing thermal responses below ten microseconds requires isolating sense amplifiers from the inductive voltage spikes generated during power switching. High current driver circuits must cut off tens or hundreds of amperes in under one microsecond. This rapid current transition across parasitic circuit inductances generates substantial voltage transients that drive sensitive differential voltage measuring inputs into hard railing amplifier saturation.
Switching transients obscure early junction cooling. Amplifier saturation recovery delays accurate reading of the forward voltage drop. If the sense instrumentation takes fifty microseconds to recover from overload, all thermal data corresponding to heat transport inside thin silicon die and immediate die attach layers becomes completely corrupted.
High-speed measurement hardware incorporates fast active clamping diodes or optical isolation switches to disconnect sensitive instrumentation inputs during the high-power heating phase.
The sequence for calibrating the Temperature Sensitive Parameter follows a precise sequence to maintain thermal equilibrium without introducing measurement-induced self-heating.
- Mount the semiconductor device onto a temperature-controlled liquid cold plate stabilized to within 0.1 degrees Celsius.
- Connect the device under test to a fast-switching constant current source programmed strictly to the measurement current magnitude.
- Allow temperature equilibrium to establish at the initial baseline calibration point, confirming stability via constant forward voltage readings.
- Record the steady-state junction voltage at the baseline temperature using an integrating digital voltmeter set to high rejection mode.
- Increase cold plate temperature in steps of ten degrees Celsius up to the maximum operating limit, waiting for complete thermal stabilization at each step.
- Extract the linear slope constant via least-squares regression, converting millivolt shifts into exact junction temperature changes.
Compliance with IEC 60747-9 mandates specifying the exact delay time inserted between heating current termination and initial voltage sampling.
Analog-to-digital converter selection balances sample rate against dynamic range and noise floor limits. Resolving microvolt-level forward voltage shifts sitting on top of multi-volt baseline signals demands at least sixteen bits of effective resolution. Sampling rates of one to two megahertz capture the critical initial voltage decay transient immediately following electrical noise settlement.
Digital filtering applied to time-series cooling data must avoid phase distortion or artificial time delays that distort the mathematical deconvolution into structure functions.
Equipment vendors often claim that software compensation routines can mathematically restore early-time transient thermal data lost to amplifier saturation. Process engineers must recognize that software extrapolation models rely on assumed exponential thermal models that frequently mask real micro-structural bond line defects occurring in the initial tens of microseconds.
Audit

Quality Gates and Production Line Screening
In-line screening protocols enforce non-destructive thermal evaluation on hundred-percent of power modules before packaging encapsulation. Static thermal resistance measurements fail to detect localized bond line defects when heat spreads broadly through heavy metal baseplates before reaching external measurement sensors. Dynamic transient thermal impedance testing evaluates the thermal path at distinct time horizons, allowing production systems to screen die attach integrity independently of downstream heatsink assembly variability.
Die attach defects produce early impedance shifts. A measurement taken at five milliseconds isolated thermal transport strictly within the die attach layer and substrate tile. Evaluation at two hundred milliseconds reflects baseplate soldering and external interface quality.
Implementing targeted time-window limits during screening allows production lines to reject defective die attach bonds in milliseconds, eliminating long heating cycles required to reach full steady-state thermal equilibrium.
- Time Window Definition ~ Select discrete millisecond evaluation points that map precisely to structural interface locations identified on reference differential structure function plots.
- Upper Impedance Thresholds ~ Set maximum allowable transient impedance limits per time window based on statistical six-sigma process control variations measured on fully qualified reference lots.
- Differential Slope Limits ~ Monitor the rate of impedance change over specific time increments to detect abnormal material phase transitions or partial interface delamination patterns.
- Power Pulse Consistency ~ Verify that heating current magnitude and voltage drop integration yield identical energy inputs across every tested module to eliminate calibration math errors.
- Contact Resistance Compensation ~ Subtract parasitic electrical socket pin voltage drops from raw signal inputs using four-wire Kelvin connections right at the power module terminals.
High sampling rates preserve spatial resolution. Incorporating transient dual interface testing into periodic lot acceptance sampling protocols validates consistency in raw solder paste batches, sintering pressure profiles, and reflow oven thermal profiles. Standard production screening relies on single-interface dynamic testing against established master baseline curves to minimize cycle times.
Transient impedance testing reveals solder matrix degradation long before structural detachment causes electrical open circuits.
What structural threshold of transient thermal impedance shift reliably predicts field fatigue lifetime under repetitive active thermal cycling conditions?


Roster

Commercial Test Platform Architecture
Industrial thermal transient analyzers split between rack-mounted bench units for qualification labs and modular multichannel cards for automated test lines. Laboratory instruments prioritize low measurement noise floors, flexible current pulse generation, and automated mathematical structure function synthesis software. Automated production screening hardware emphasizes parallel measurement channels, robust over-voltage protection, fast test execution, and direct integration with industrial handling robotics.
| Instrument Architecture | Maximum Heating Current (A) | Voltage Sampling Frequency (MHz) | Minimum Usable Measurement Time (µs) | Primary Industrial Application |
|---|---|---|---|---|
| 100 to 500 | 1.0 to 2.0 | 10 | R&D qualification, structure function synthesis, material evaluation | |
| 20 to 100 | 0.5 to 1.0 | 20 to 50 | 100% inline screening, pass/fail window sorting, process control | |
| 1000 to 3000 | 0.1 to 0.5 | 100 | Full stack power module qualification, traction drive testing | |
| User defined | Up to 10.0 | 1 to 5 | Advanced wide-bandgap semiconductor dynamic bond line research |
Procuring thermal transient test hardware requires balancing capital equipment costs against production cycle time constraints. Rack-mounted laboratory systems feature high-resolution instrumentation capable of resolving sub-millikelvin temperature fluctuations, making them ideal for failure analysis, die attach material development, and MIL-STD-883 qualification routines. Their higher measurement latency and manual handling interfaces make them unsuitable for high-volume automated manufacturing lines.
Modular multichannel screening cards interface directly with automated component handlers, executing fast transient checks within sub-second indexing times. These instruments utilize fixed mathematical windowing algorithms hardcoded into FPGA firmware to output simple pass/fail flags to the line controller. Selecting modular hardware with four-wire Kelvin sense paths and hardware-based amplifier overload protection prevents false yield losses caused by test socket wear or contact resistance fluctuations in high-throughput assembly environments.