Stationary Leveling and Gravity Vector Estimation in Inertial Units
Stationary leveling extracts pitch and roll by isolating the 1g local gravity vector, bounded by accelerometer bias stability and vibration rectification error.


Datum
Determining physical orientation relative to gravity relies on measuring acceleration while the system is motionless. When an inertial measurement unit stays still, the total specific force vector measured by its accelerometers equals Earth’s gravity in magnitude and points straight up along the local vertical line. Stationary leveling uses this static balance to determine a platform’s roll and pitch relative to the local horizontal plane.
The accuracy of this initial alignment sets the baseline orientation for downstream attitude tracking, integrated navigation, and structural monitoring.
Although the local gravity vector provides a reliable directional reference, its magnitude and exact direction vary across the Earth’s surface. Turning raw tri-axial accelerometer output into a platform tilt angle requires mapping the sensor’s coordinate system ~ the body frame ~ to an earth-fixed geographic reference frame, usually the local-level North-East-Down system. Under strictly static conditions, the accelerometer triad senses a reaction specific force equal to local gravity, pointing upward along the Down axis.
Any angular difference between this measured vector and the theoretical Down axis represents the horizontal tilt of the unit.

Frame Definitions and Gravity Reference Mechanics
Tri-axial inertial sensors define orthogonal axes aligned with their physical package geometry. These body frame axes ~ X, Y, and Z ~ map directly to mechanical datums on the sensor housing. By contrast, the local-level frame forms an orthogonal reference system whose horizontal plane sits perpendicular to local gravity, with the Down axis pointing along gravity toward the geocenter.
Static tilt estimation calculates the Euler angles, specifically roll and pitch, needed to rotate the local-level frame into alignment with the body frame.
Roll measures rotation around the longitudinal axis, and pitch measures rotation around the lateral axis. Under static conditions, the output vector from the accelerometers equals the transformation matrix applied to local gravity. Because stationary accelerometers cannot sense rotation around the vertical gravity vector, true azimuth or yaw heading cannot be measured from static accelerometer data alone.
The gravity vector offers only two independent angular degrees of freedom, limiting static leveling strictly to pitch and roll.

Tilt Angle Mathematical Derivation under Zero Motion
Static leveling calculates roll and pitch directly from the accelerometer output vector. Breaking this specific force vector into components along the body axes gives three acceleration readings: longitudinal, lateral, and vertical. Provided there is no external linear motion, the magnitude of the measured vector equals local gravity.
Roll is computed as the inverse tangent of lateral acceleration over vertical acceleration. Pitch equals the inverse tangent of negative longitudinal acceleration divided by the square root of the sum of squared lateral and vertical accelerations.
When platform tilt stays near horizontal, small-angle approximations simplify these equations. For angles under five degrees, roll roughly equals lateral acceleration divided by local gravity, and pitch roughly equals negative longitudinal acceleration divided by local gravity. This approximation keeps calculation errors below one arcsecond for tilts under three degrees.
At larger angles, full trigonometric evaluation using double-precision floating-point arithmetic is necessary to keep math errors below the sensor noise floor.
At a pitch angle of 45 degrees, a 100 micro-g bias error shifts tilt estimation by exactly 20.6 arcseconds in stationary conditions at room temperature.
Sensor resolution directly sets the smallest tilt angle that can be resolved. Differentiating the tilt equations with respect to acceleration shows that angular sensitivity drops as tilt approaches ninety degrees. Sensitivity is highest near horizontal, where a one millig acceleration offset creates about 0.057 degrees ~ or 206 arcseconds ~ of tilt error.
As pitch approaches ninety degrees, sensitivity to vertical acceleration drops to zero, leaving tilt estimates extremely vulnerable to longitudinal bias errors. Practical leveling systems therefore restrict primary gravity alignment to tilt angles within forty-five degrees of horizontal.
Local Gravitational Variations and Geodetic Offsets
Surface acceleration varies noticeably with geographical location. Earth’s rotation, equatorial bulge, and uneven mass distribution shift local gravity from roughly 9.780 meters per second squared at the equator to 9.832 meters per second squared at the poles. Relying on a fixed nominal gravity value of 9.80665 meters per second squared introduces systematic errors into vector magnitude checks, which can cause stationary detection algorithms to misinterpret static conditions or corrupt scale factor calibrations.
Geodetic reference models like the World Geodetic System 1984 define theoretical gravity based on geodetic latitude and altitude above the ellipsoid. The Somigliana gravity formula handles the latitude dependence with high precision, while altitude corrections apply the free-air gravity gradient ~ reducing local gravity by about 0.3086 millig for every hundred meters of elevation above sea level. Factoring in latitude and elevation ensures that magnitude thresholds evaluate against actual local gravity limits.
| Geographic Location | Latitude (Degrees) | Altitude (Meters) | Theoretical Gravity (m/s²) | Magnitude Offset vs Nominal (%) | Uncompensated Tilt Error (Arcsec) |
|---|---|---|---|---|---|
| Equator (Sea Level) | 0.0000 | 0 | 9.780327 | -0.268 | 553.2 |
| Mid-Latitude Industrial Center | 45.0000 | 150 | 9.806194 | -0.005 | 9.8 |
| High-Altitude Facility | 45.0000 | 2800 | 9.798012 | -0.088 | 181.7 |
| Polar Station | 90.0000 | 10 | 9.832156 | +0.260 | 536.4 |
Spatial gravity anomalies deflect the local gravity vector away from the theoretical ellipsoid normal. Nearby mass variations, including mountain ranges, dense ore bodies, or subterranean voids, pull the vector off the geometric perpendicular. This deflection of the vertical introduces a tilt offset between the astronomical vertical (aligned with gravity) and the geodetic vertical (defined by the reference ellipsoid).
In high-precision surveying, vertical deflection can reach fifty arcseconds, setting a firm physical limit on leveling accuracy unless local gravimetric survey corrections are applied.
Evaluating static leveling performance across candidate inertial measurement units requires separating pure sensor white noise from long-term bias instability to determine the actual measurement floor. Whether local gravimetric deflection profiles can be modeled dynamically during static initialization without external geodetic references remains an open physical question.

Beam
Suspended proof-mass micro-structures in MEMS architectures convert specific force into electrical signals. In capacitive MEMS devices, acceleration deflects a central silicon proof mass suspended by flexible micro-beams, shifting the differential capacitance between interlaced fixed and moving comb fingers. Piezoresistive designs use mechanical strain in flexure beams to change resistance values in an internal bridge.
Quartz flexure accelerometers combine etched quartz beams with force-balance feedback coils to reach sub-micro-g resolution. Ultimately, the mechanics of these beam suspensions establish the performance ceiling for static leveling.

Proof Mass Dynamics and Suspension Stiffness
Elastic flexures in capacitive silicon devices dictate how the sensor responds to acceleration. Design stiffness involves a compromise: high mechanical sensitivity requires flexible beams with low spring constants, while broad dynamic range and structural durability demand stiff beams with high resonant frequencies. In a MEMS sensor, proof-mass displacement equals applied acceleration divided by the square of the undamped natural frequency.
Micromachined beam dimensions control this displacement response. Etching variations during wafer fabrication cause beam thickness to vary across production runs, shifting structural stiffness and baseline zero-g offsets. Silicon spring constants also change with temperature due to the thermo-elastic coefficient of single-crystal silicon.
As ambient temperatures rise, the flexures soften, increasing displacement under constant gravity and causing systematic thermal drift in both scale factor and bias.
Mechanical Noise Floor and Brownian Motion Ceilings
Gas molecules colliding with suspended micro-structures create thermal acceleration noise. This thermo-mechanical Brownian noise sets an unyielding physical floor on sensor resolution, expressed as an equivalent noise spectral density in micro-g per root Hertz. Brownian noise density scales inversely with proof mass size and directly with the square root of mechanical damping forces inside the cavity.
Gas pressure inside the enclosure alters squeeze-film damping between comb fingers. High cavity vacuum reduces gas damping and lowers Brownian noise, but under-damped structures become vulnerable to resonance when exposed to high-frequency acoustic or mechanical inputs. Commercial MEMS accelerometers tune cavity pressure for near-critical damping, accepting a Brownian noise floor between ten and one hundred micro-g per root Hertz to prevent structural ringing.
IEEE 1554 compliance testing mandates continuous temperature cycling during bias calibration to expose structural hysteresis before part installation.
In bench evaluations of capacitive MEMS elements, package stress often dominates turn-on bias repeatability. Mounting an integrated circuit package to a printed circuit board introduces differential thermal expansion between the plastic compound, metal leadframe, and underlying FR4 substrate, transferring strain straight into the silicon die. This strain distorts the suspension beams and shifts the zero-g bias offset whenever the unit experiences thermal cycling or changes in mounting torque.

Non-Linear Mechanics and Vibration Rectification Mechanics
Asymmetric stiffness in silicon flexures converts high-frequency AC vibration into false static DC offsets. Vibration Rectification Error occurs when high-frequency motion well beyond the sensor’s readout bandwidth drives the suspension beams into non-linear deflections. These physical non-linearities arise from unequal comb finger spacing, non-linear squeeze-film air damping, and stress-stiffening of the flexures under larger displacements.
When an inertial unit rests on a stationary platform subjected to industrial machinery, engines, or cooling fans, high-frequency vibration travels into the housing. If these vibrations carry energy near the beam’s mechanical resonant frequency, the proof mass experiences symmetric forces but responds with non-linear displacement. The time-averaged mean of this non-linear movement creates a DC offset signal that looks identical to actual gravitational acceleration.
- Thermal Hysteresis Loop Trapping shifts zero-g bias offsets along different paths during heating and cooling cycles, frustrating single-value temperature compensation algorithms.
- High Frequency Acoustic Rectification couples airborne pressure waves into micromachined cavity walls, producing false DC tilt readings without actual platform movement.
- Comb Gap Capacitive Non-Linearity introduces second-order acceleration terms as mechanical displacement alters electrode spacing non-linearly under heavy vibration.
- Die Attach Creep relaxes mechanical stress in epoxy bonding layers over time, driving permanent zero-g bias drift over several months.
- Cross-Axis Quad-Spur Coupling transfers high-amplitude out-of-plane vibration into false horizontal acceleration signals through flexure asymmetry.
Vibration rectification directly corrupts static gravity vector estimation because filtering algorithms cannot tell true gravity apart from vibration-induced DC offsets. A stationary IMU mounted on vibrating industrial hardware might report a tilt offset of several degrees while sitting perfectly level. Mitigating this effect requires mechanical isolators tuned to damp high-frequency structural inputs before they reach the die, alongside sufficient suspension stiffness to keep deflections within linear bounds.
Ignoring non-linear flexure mechanics during component selection produces stationary leveling errors that digital filtering cannot remove, leaving permanent alignment offsets across operating temperature and vibration profiles.
Arithmetic
Digital signal processing chains turn raw analog sensor signals into calibrated gravity vectors. Signals from capacitive comb fingers undergo charge-to-voltage conversion, continuous-time anti-aliasing filtering, analog-to-digital conversion, and firmware-level calibration. The mathematical design of this processing chain dictates how effectively static leveling algorithms reject high-frequency noise while preserving DC gravity measurements.
| ADC Bit Depth | Sampling Rate (Hz) | Oversampling Ratio | Effective Noise Density (µg/√Hz) | Averaging Window (s) | Resolvable Tilt Angle (Arcsec) |
|---|---|---|---|---|---|
| 12-Bit Differential | 100 | 1x | 250.0 | 0.10 | 165.2 |
| 16-Bit Sigma-Delta | 1000 | 10x | 80.0 | 1.00 | 16.5 |
| 24-Bit Sigma-Delta | 4000 | 100x | 15.0 | 10.00 | 1.0 |
| 24-Bit Sigma-Delta | 8000 | 400x | 5.0 | 60.00 | 0.3 |
Stationary State Detection Criteria and Thresholding
Isolating stationary periods prevents vehicle acceleration from distorting the gravitational baseline. Static leveling algorithms must continuously check whether the inertial unit is motionless or undergoing translational movement. Feeding non-gravitational acceleration into a static leveling filter introduces immediate tilt errors that degrade downstream navigation.
Stationary detection uses multi-sensor magnitude and variance thresholding. Three conditions must be met concurrently over a sliding window: acceleration magnitude matching local gravity within a tight band, moving variance of that magnitude staying below a set noise threshold, and gyro angular velocity remaining near zero. Acceleration magnitude alone is not enough; a vehicle making a coordinated turn can read a 1g total specific force while experiencing substantial non-gravitational acceleration.
Why Does High Frequency out of Band Noise Degrade Static Alignment?
Aliasing in analog-to-digital converters folds unfiltered high-frequency mechanical vibration into low-frequency drift. When vibration frequencies exceed half the converter’s sampling rate, sampling folds high-frequency energy into the baseband. Signal processing algorithms then treat that aliased energy as low-frequency tilt, corrupting the static gravity vector calculation.
Preventing aliasing requires pairing mechanical damping with proper digital filtering. Continuous-time analog low-pass filters ahead of quantization must attenuate sufficiently at the Nyquist limit. Internal sigma-delta ADCs use high oversampling ratios and digital sinc filters to suppress high-frequency energy before downsampling to the output rate.
Without adequate anti-aliasing, mechanical vibration from fans, pumps, or structural resonance introduces unpredictable tilt errors that post-processing averaging filters cannot remove.

Averaging Limits and Allan Variance Deconstruction
Averaging sensor output over long stationary windows reduces Gaussian white noise up to a point. White noise spectral density drops with the square root of averaging time: extending the window by a factor of one hundred cuts random tilt noise by a factor of ten. However, continuous integration cannot improve resolution indefinitely because low-frequency sensor instabilities eventually intervene.
Allan variance analysis helps pinpoint these temporal noise limits. Plotting Allan deviation against cluster averaging time shows distinct noise regimes within the unit. At short integration times, white noise dominates and the curve slopes downward on a log-log scale.
As integration time increases, the curve reaches a flat minimum corresponding to bias instability, or flicker noise. Past this minimum, rate random walk and thermal drift pull the curve upward, showing that longer averaging degrades total measurement accuracy.
- Sample tri-axial acceleration vectors at output rates exceeding one kilohertz.
- Apply FIR low-pass filtering to suppress out-of-band mechanical vibration.
- Compute sliding-window mean and variance across fifty consecutive acceleration samples.
- Evaluate stationary state by comparing instantaneous variance against the calibrated noise threshold.
- Reject acceleration samples falling outside the 1g local gravity tolerance window during motion events.
- Accumulate valid static acceleration vectors within the optimal Allan variance integration window.
- Calculate static roll and pitch Euler angles using full trigonometric coordinate transformation matrices.
Hysteresis degrades zero-offset repeatability. During environmental chamber sweeps between minus forty and plus eighty-five degrees Celsius, uncompensated drift reached thirty-eight micro-g per degree Celsius across low-cost tri-axial accelerometers. This thermal drift shifts the low-frequency floor of the Allan variance curve, forcing static leveling algorithms to restrict integration windows to short bursts before thermal drift swamps the benefits of white-noise averaging.
Kalman Filter Formulation for Stationary Gravity Recovery
State estimation algorithms combine accelerometer tilt vectors with gyroscope integration to maintain horizontal tracking. A Complementary or Extended Kalman Filter tracks orientation using gyroscopes for high-bandwidth dynamic updates and static accelerometers for low-frequency absolute tilt corrections. Whenever stationary conditions are detected, the measurement update phase uses the local gravity vector to reset accumulated gyroscope drift.
Static updates adjust filter covariance matrices based on estimated sensor noise. When zero motion is detected, the Kalman filter sets accelerometer measurement noise covariance equal to the white noise power spectral density divided by the sampling interval. If slight platform vibration occurs, the filter scales up the measurement noise covariance matrix, downweighting accelerometer inputs to keep transient vibration from corrupting horizontal tilt estimates.
Extending the stationary averaging window past the Allan variance bias instability knee degrades leveling accuracy by integrating flicker noise.
To prevent false static detection during platform vibration, moving variance windowing algorithms rely directly on raw accelerometer noise density. Tailoring algorithm thresholds directly to physical sensor noise parameters preserves filter stability across variable operational environments. Averaging calculations must stop immediately when integration time crosses the Allan variance bias instability minimum point.

Mount
Mechanical coupling between sensor packaging and host circuit boards strongly affects zero-g offset stability. Mounting methods create stress fields inside the sensor package. When temperatures change or circuit boards flex, mechanical strain travels through solder joints into the silicon micro-structures, distorting spring geometries and shifting zero-g bias.
Mechanical Stress and Thermal Expansion Dynamics
Differing thermal expansion coefficients across board substrates, solder joints, and silicon dies generate internal stress. FR4 circuit board material expands at roughly fifteen to seventeen parts per million per degree Celsius, whereas silicon expands at only 2.6 parts per million per degree Celsius. Solder reflow locks in structural strain at high temperatures, leaving residual mounting stress once the assembly cools.
Board flex directly shifts zero-g bias. Thermal cycling causes differential expansion that warps the package substrate, altering finger gaps in capacitive MEMS structures. Symmetric board layouts help minimize uneven strain.
Placing heavy components, mounting screws, or heat-generating transistors right next to sensitive inertial sensors creates thermal and mechanical stress gradients that degrade bias repeatability.
Axis Orthogonality and Cross-Sensitivity Alignment
Physical misalignment between sensor axes introduces cross-axis coupling, allowing vertical gravity to leak into horizontal acceleration channels. While manufacturers try to build perfectly orthogonal sensing triads, micromachining tolerances and die-attach variations leave residual non-orthogonality angles up to 0.5 degrees. Under static gravity, a 0.5-degree misalignment projects up to 8.7 millig of gravity onto horizontal axes, creating an uncalibrated tilt error of over thirty arcminutes.
Cross-axis sensitivity matrices are used to model and remove alignment errors. The full sensor model represents measured acceleration as a three-by-three non-orthogonality matrix multiplied by the true acceleration vector, plus a three-by-three scale factor matrix and a three-term bias vector. Calibrating non-orthogonality requires rotating the package through known geometric orientations to isolate cross-axis gains from primary axis scale factors.
- Isolate Sensor Layout Zones by routing keep-out regions around accelerometer pads so solder mask variations do not warp the board.
- Symmetrize Solder Pad Geometries to balance surface tension during reflow, preventing tombstoning or package pitch shift.
- Incorporate Mechanical Isolation Slots routed through the circuit board substrate around the IMU perimeter to protect the die from board flex.
- Enforce Strict Tightening Torques on mounting fasteners to prevent mechanical stress relaxation over long operating periods.
- Avoid Mounting Near Structural Flexures where external loads deform enclosures and transmit strain straight into sensor packages.
Uncompensated scale factor errors directly skew tilt calculations. Physical mounting surfaces must remain precisely parallel to the host platform’s structural datum. Any shimming, surface roughness, or debris under the IMU mounting feet creates fixed angular offsets that permanently bias static leveling calculations.
Structural Isolation and Enclosure Interfacing
Elastomeric dampers placed between sensor housings and heavy machinery filter high-amplitude acoustic waves and structural vibration. Damping protects accelerometers from vibration rectification errors and physical shocks that could damage silicon flexures. However, elastomeric mounts add mechanical compliance that degrades static leveling accuracy if the mounts suffer from material creep, tilt hysteresis, or non-uniform thermal expansion.
Solder reflow thermal profiles permanently alter MEMS internal spring stress and offset zero-g calibrations by up to 5 millig.
Kinematic three-point mounting provides stress relief while maintaining rigid orientation. Mounting sensor housings via three kinematic contact points prevents structural twisting in the host platform from transferring bending moments into the sensor chassis. This approach helps preserve factory zero-g calibrations across harsh thermal and mechanical environments.
Persistent zero-g bias shifts after assembly typically stem from reflow profiles and mounting stress rather than instability in the sensor die itself.


Verification
Factory calibration maps individual sensor errors across the operating envelope. Calibration establishes the mathematical model needed to convert raw digital sensor output into true acceleration components. Without thorough bench testing, unmodeled bias, scale factor non-linearity, axis non-orthogonality, and thermal drift keep low-cost IMUs from reaching sub-arcminute leveling accuracy.

Multi Position Tumble Test Mechanics
Precision multi-axis indexing tables rotate inertial modules through known angles relative to gravity to solve for sensor biases. Tumble testing uses the constant local gravity vector as a physical calibration standard. Orienting each axis parallel and antiparallel to local gravity allows calibration routines to separate zero-g bias offsets from scale factor gains.
A standard six-position tumble test aligns each axis positive-up, positive-down, and in four horizontal orientations. This yields six scalar equations to solve for three bias terms and three scale factors. However, a six-position test cannot isolate non-orthogonality matrix terms.
Full calibration requires twelve-position or twenty-four-position routines that place the IMU at intermediate oblique angles, over-determining the equation system to extract cross-axis alignment angles at the same time.
| Calibration Format | Orientations | Thermal Points | Residual Bias (µg) | Residual Non-Orthogonality (Arcsec) | Static Leveling Accuracy (Arcsec) |
|---|---|---|---|---|---|
| Basic 6-Position | 6 | 1 (25°C) | 350.0 | 180.0 | 215.0 |
| Extended 12-Position | 12 | 1 (25°C) | 80.0 | 15.0 | 22.0 |
| Thermal 12-Position Linear | 12 | 3 Ramps | 25.0 | 12.0 | 8.5 |
| Thermal 24-Position Cubic | 24 | 5 Ramps | 4.5 | 2.0 | 1.2 |
Thermal Chamber Modeling and Hysteresis Mapping
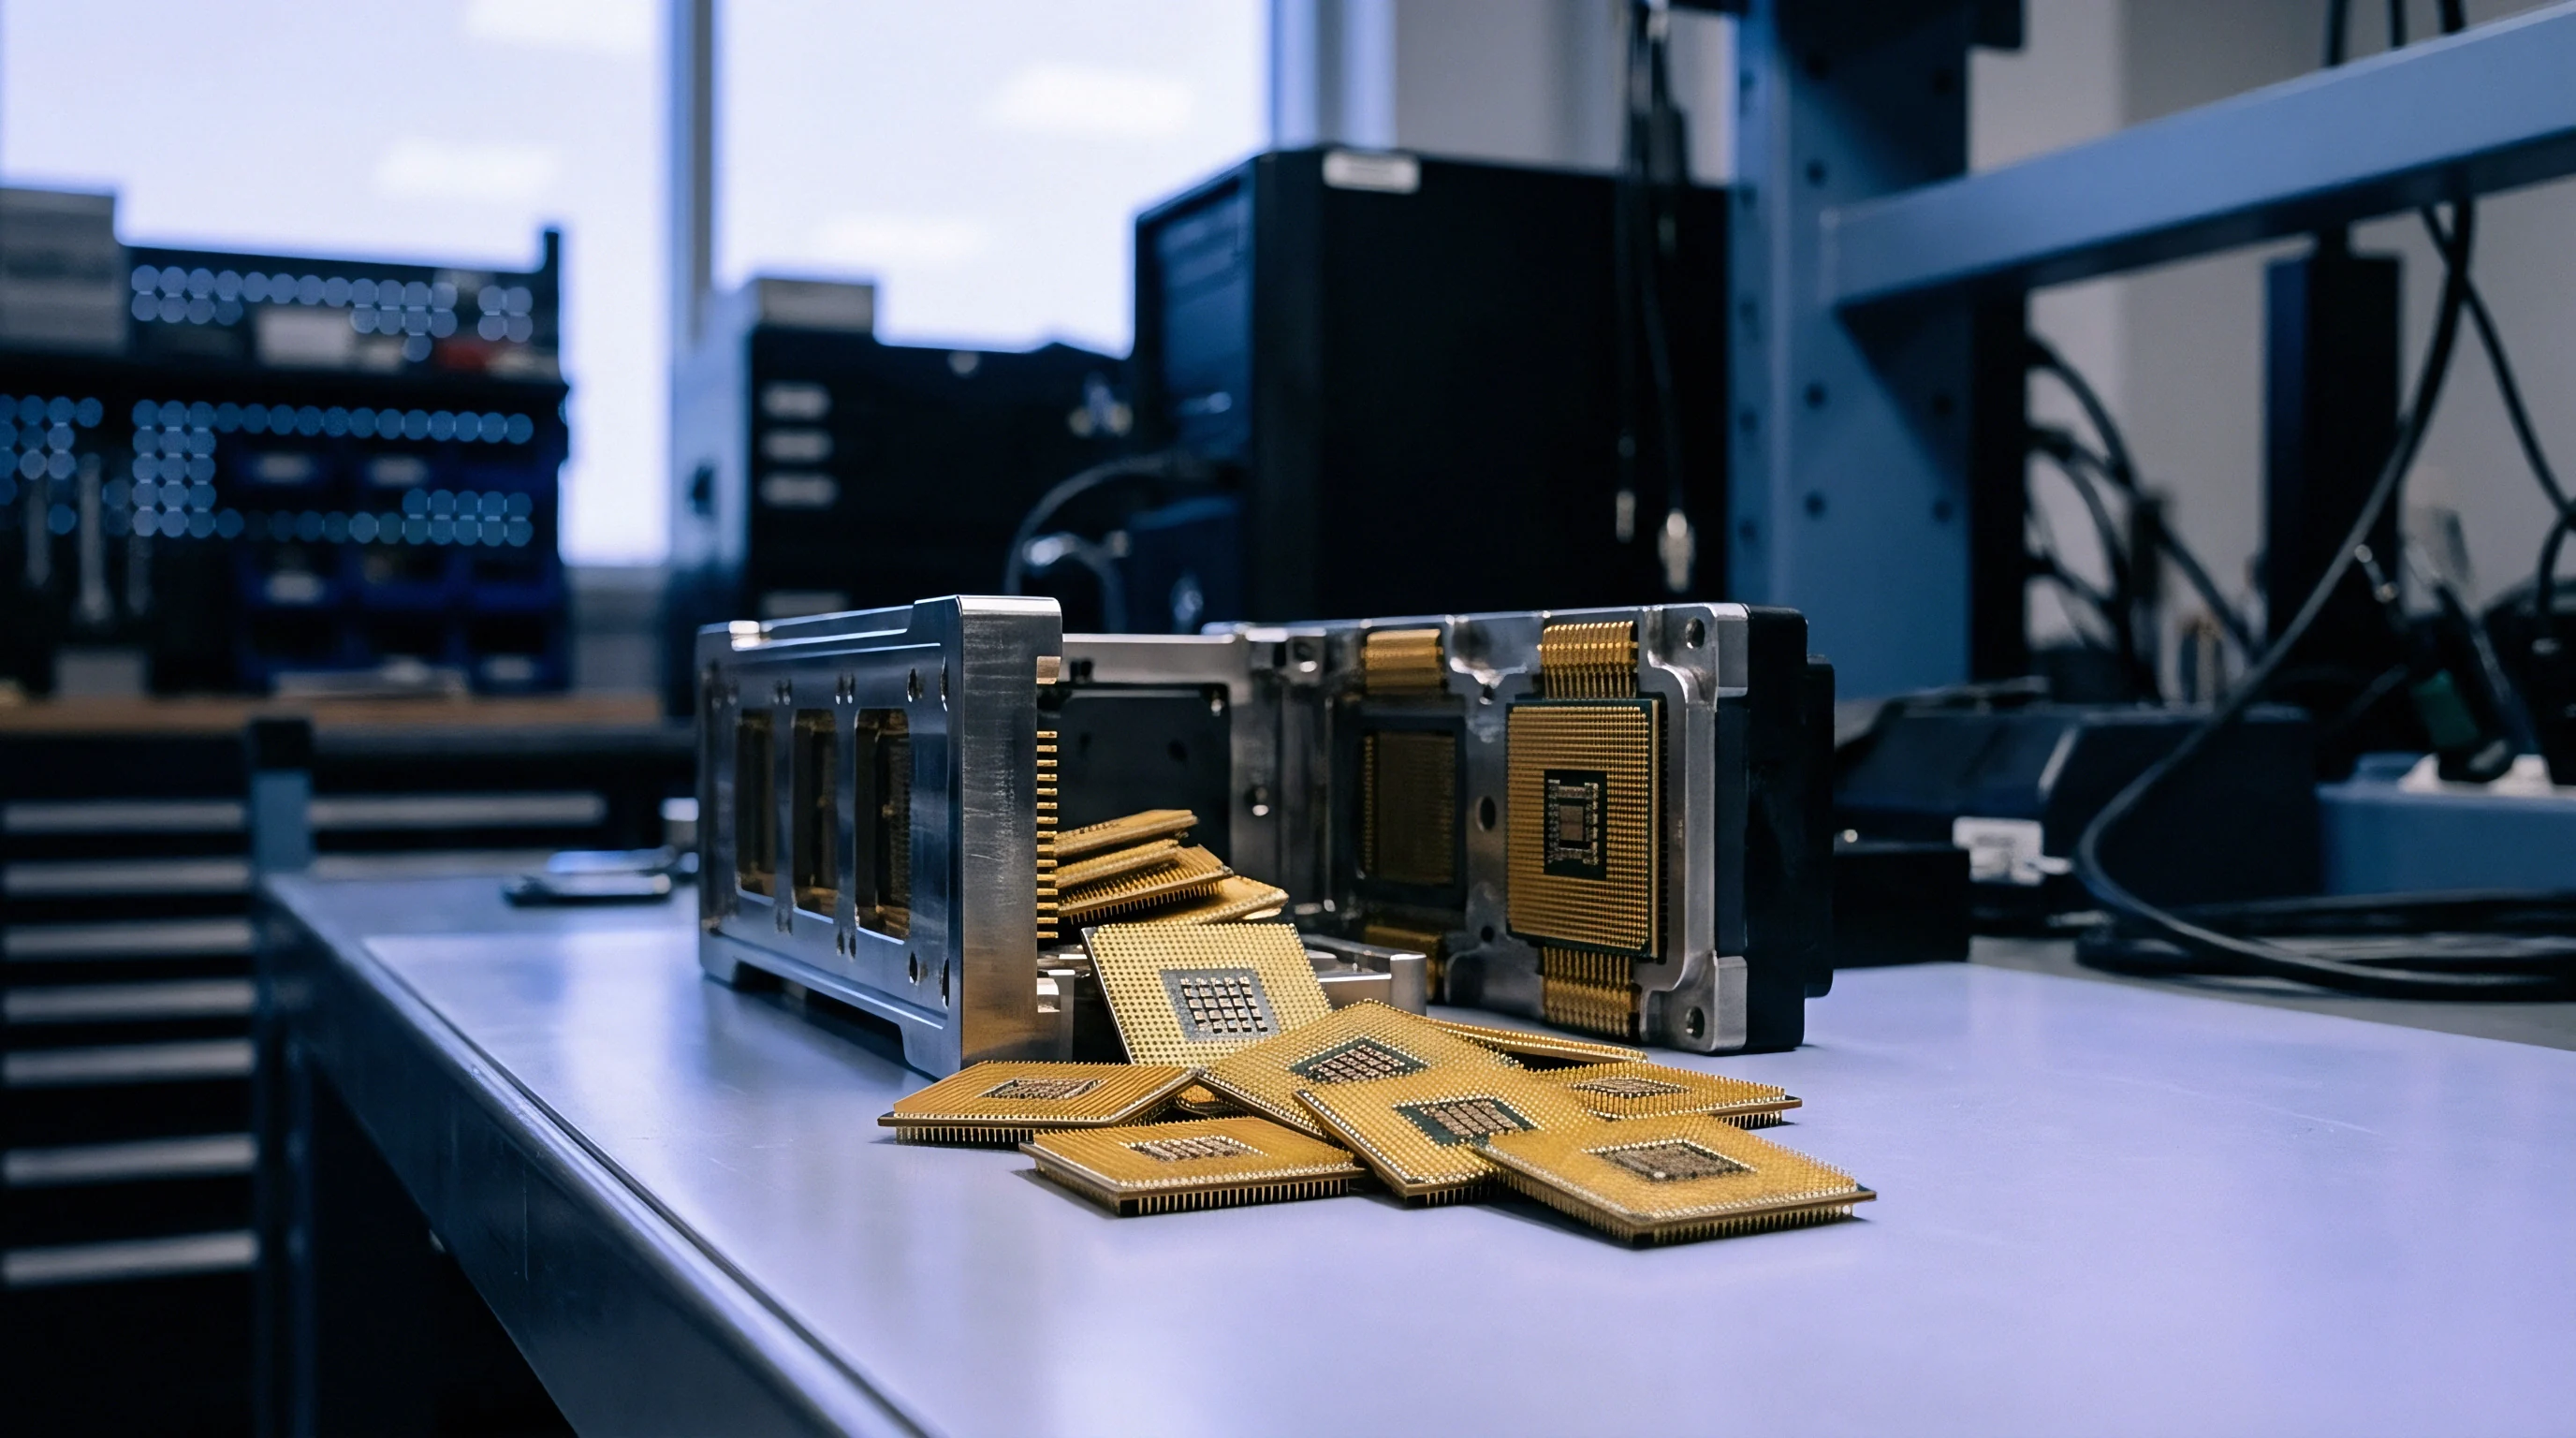
Environmental testing subjects assembled sensor boards to controlled temperature ramps while recording zero-g offsets. Thermal calibration chambers run automated temperature profiles across the industrial operating range ~ typically from minus forty to plus eighty-five degrees Celsius ~ while logging sensor output alongside temperature sensors embedded in the IMU chassis.
Polynomial fitting generates temperature-indexed compensation tables. Third-order polynomials model non-linear thermal drift curves for both bias and scale factor. Evaluating hysteresis requires analyzing data separately during heating and cooling ramps.
The area enclosed between the heating and cooling offset curves defines the hysteresis loop, establishing where single-value polynomial compensation breaks down.
- Full Temperature Coefficient Matrix providing polynomial coefficients for bias, scale factor, and non-orthogonality across thirty thermal increments.
- Traceable Gravimetric Calibration Certificate documenting local gravity reference values, geodetic latitude, elevation, and indexing table accuracy.
- Allan Variance Parameter Dossier reporting verified angle random walk, bias instability minima, and flicker noise floor limits for each axis.
- Vibration Rectification Sensitivity Table recording DC acceleration offsets measured during standardized multi-axis sinusoidal sweeps.
- Axis Orientation Mapping Diagram detailing physical housing mechanical datums relative to the internal calibrated sensor frame.
Factory tumble tests isolate bias vectors, but calibration costs grow quickly with the number of temperature points tested. Drafting procurement specifications for industrial leveling systems requires explicitly defining acceptable hysteresis limits across thermal cycles. Requiring automated thermal screening ensures that production units meet their specified tilt error budgets.

Calibration Matrix Estimation and Least Squares Solvers
Linear algebra algorithms fit raw sensor outputs against known gravity vectors using over-determined matrix systems. The solver minimizes the sum of squared residuals between predicted acceleration vectors and true local gravity. Singular Value Decomposition or Gauss-Newton iteration is typically used to solve for the calibration parameters.
Over-determined calibration systems prevent measurement noise from distorting scale factor estimates. Collecting hundreds of redundant gravity readings across varied orientations averages out white noise and small table-positioning errors. The resulting calibration matrix converts raw ADC counts into temperature-compensated, axis-aligned acceleration units via a single matrix-vector multiplication in firmware.
Standard procurement terms often require suppliers to deliver unit-specific calibration matrices compliant with ISO 17025 laboratory standards, shifting responsibility for unmodeled thermal drift back to the manufacturer.


Stock
Selecting an inertial sensor modality means balancing noise performance, thermal drift, and piece-part cost against supply chain resilience. The market spans several technology tiers, each tied to distinct manufacturing ecosystems, foundries, and cost structures. Choosing a sensing mechanism fixes not just leveling accuracy, but also long-term part availability and total bill-of-materials cost.
Transduction Modality Tiering and Performance Ceilings
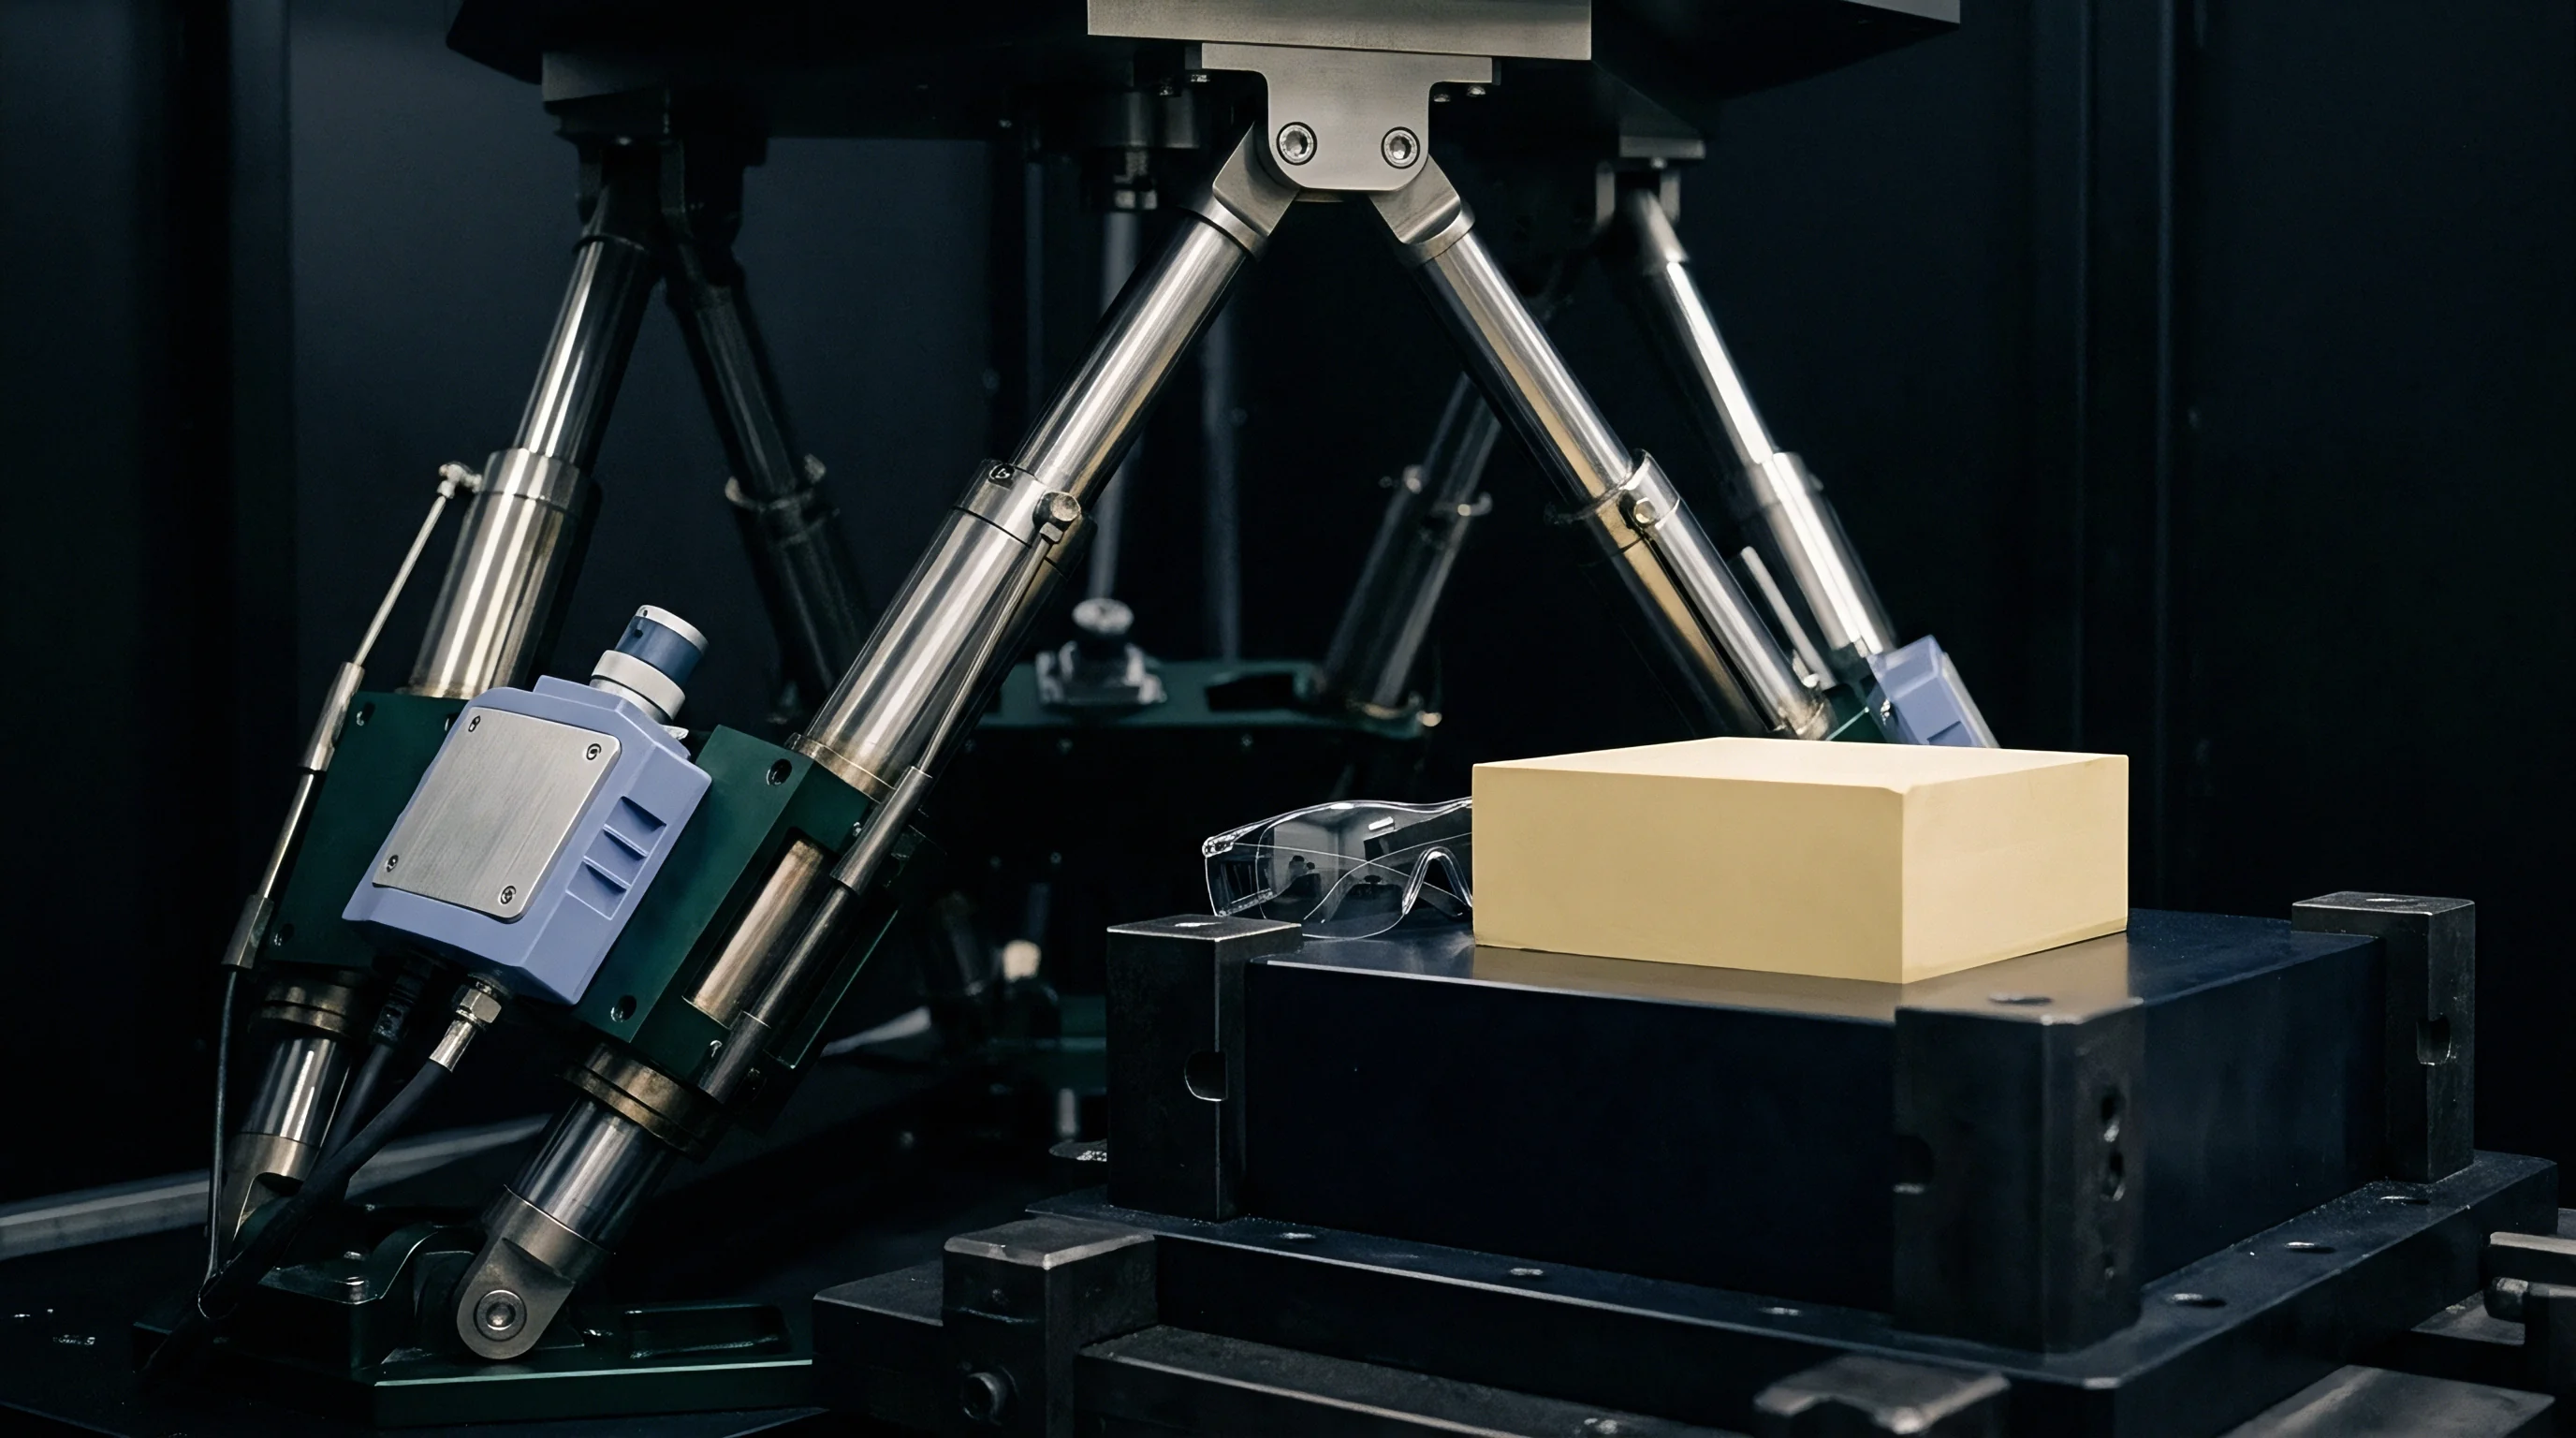
Commercial sensor options range from low-cost consumer silicon to tactical-grade optical and quartz devices. Consumer-grade capacitive MEMS accelerometers deliver noise densities around one hundred to three hundred micro-g per root Hertz with turn-on bias repeatability of five to twenty millig, pricing between one and five dollars in volume. These parts work well for simple tilt switches, but cannot achieve sub-arcminute static leveling.
| Transduction Modality | Noise Density (µg/√Hz) | Bias Instability (µg) | Temp Coff (µg/°C) | Unit Cost (USD) | Supplier Pool Count |
|---|---|---|---|---|---|
| Consumer Capacitive MEMS | 150.0 | 500.0 | 250.0 | $1.50 | 30 Houses |
| Industrial Capacitive MEMS | 25.0 | 50.0 | 35.0 | $35.00 | 8 Foundries |
| Tactical Piezoresistive/MEMS | 7.0 | 8.0 | 5.0 | $450.00 | 3 Specialist Sources |
| Navigation Quartz Flexure | 0.8 | 1.2 | 0.8 | $2,800.00 | Sole Source Specialist |
Industrial-grade capacitive MEMS components represent a practical middle ground for structural monitoring, drone initialization, and platform stabilization. Delivering noise spectral densities below thirty micro-g per root Hertz and bias instability under fifty micro-g, these sensors achieve static tilt resolution between ten and thirty arcseconds when paired with thermal calibration. Unit prices range from fifteen to eighty dollars across several semiconductor foundries.
Tactical-grade quartz flexure accelerometers and high-end MEMS units provide sub-micro-g bias stability and sub-arcsecond tilt resolution. However, unit costs exceeding several hundred dollars and export control regulations limit their use to defense, aerospace, and specialized gravimetric survey equipment. Choosing a tactical device also introduces export compliance overhead and longer procurement lead times that can stretch project schedules.

Supplier Pool Geography and Sole Source Vulnerabilities
Silicon wafer fabrication facilities for MEMS accelerometers are concentrated in specific regions and specialized foundry networks. While consumer-grade dies can be sourced from dozens of packaging houses, high-stability industrial dies require specialized deep-reactive-ion etching processes available at only a few qualified foundries worldwide. Sole-sourcing an industrial sensor die leaves production lines exposed to factory shutdowns, trade shifts, or unexpected end-of-life notices.
Qualifying an alternate MEMS accelerometer requires extensive re-validation. Because drop-in replacement candidates rarely share identical flexure geometries, noise profiles, or thermal expansion characteristics, swapping components forces software engineers to rewrite firmware calibration routines and repeat environmental chamber tests. Cross-qualification programs often take six months of bench testing and tens of thousands of dollars in engineering labor.
Landed Cost and Qualification Economics
Total bill-of-materials cost goes beyond piece-part pricing to include testing, thermal screening, and qualification expenses. A cheap sensor that requires individual tumble testing and multi-point thermal calibration often carries a higher landed cost than a pre-calibrated module with factory-trimmed compensation tables. Sourcing decisions must account for test throughput constraints and test equipment depreciation when weighing raw IC sensors against calibrated modules.
Automotive qualification standards like AEC-Q100 and AEC-Q103 offer valuable supply assurance for industrial buyers. Sensors certified under AEC-Q103-002 for MEMS accelerometers undergo thermal shock, high-temperature operating life, and mechanical stress testing. Choosing AEC-Q103 qualified devices ensures consistent lot-to-lot bias performance and long-term availability without custom qualification costs.
Procurement teams evaluate second-source options alongside unit pricing before releasing volume production orders. Designing for dual-sourced component footprints protects production lines against supply allocation while strengthening commercial leverage during annual contract renegotiations.