Uncertainty Budgeting for Time Dependent Micro Strain Relaxation in High Temperature MEMS Lot Acceptance
High temperature MEMS lot acceptance demands GUM-compliant uncertainty budgeting that maps micro strain relaxation kinetics to verified drift limits.


Creep
Silicon lattices deform under thermal loads. Above two hundred degrees Celsius, residual internal stress causes time-dependent mechanical deformation in polycrystalline silicon, silicon carbide, and single-crystal silicon-on-insulator microstructures. As micro-strain relaxes, it alters the resting mechanical equilibrium of MEMS sensing elements ~ drifting the zero-offset, destabilizing scale factors, and degrading calibrated measurement accuracy.
Mapping these relaxation kinetics is essential when setting lot acceptance testing regimes for high-temperature MEMS devices destined for propulsion, aerospace, geothermal, and industrial monitoring applications.
Fabrication leaves residual stress fields across thin films, structural anchors, piezoresistors, and packaging interfaces. Chemical vapor deposition, sputtering, thermal oxidation, and high-temperature eutectic or glass frit bonding all introduce complex stress gradients. As the device operates at elevated service temperatures, these residual stresses relax over time through dislocation motion, grain boundary sliding, atomic diffusion, and structural reorganization within amorphous interlayers.
The resulting micro-strain shift ~ measured in micro-strains or parts per million of structural displacement ~ directly shifts the baseline of piezoresistive, capacitive, or resonant transducers.
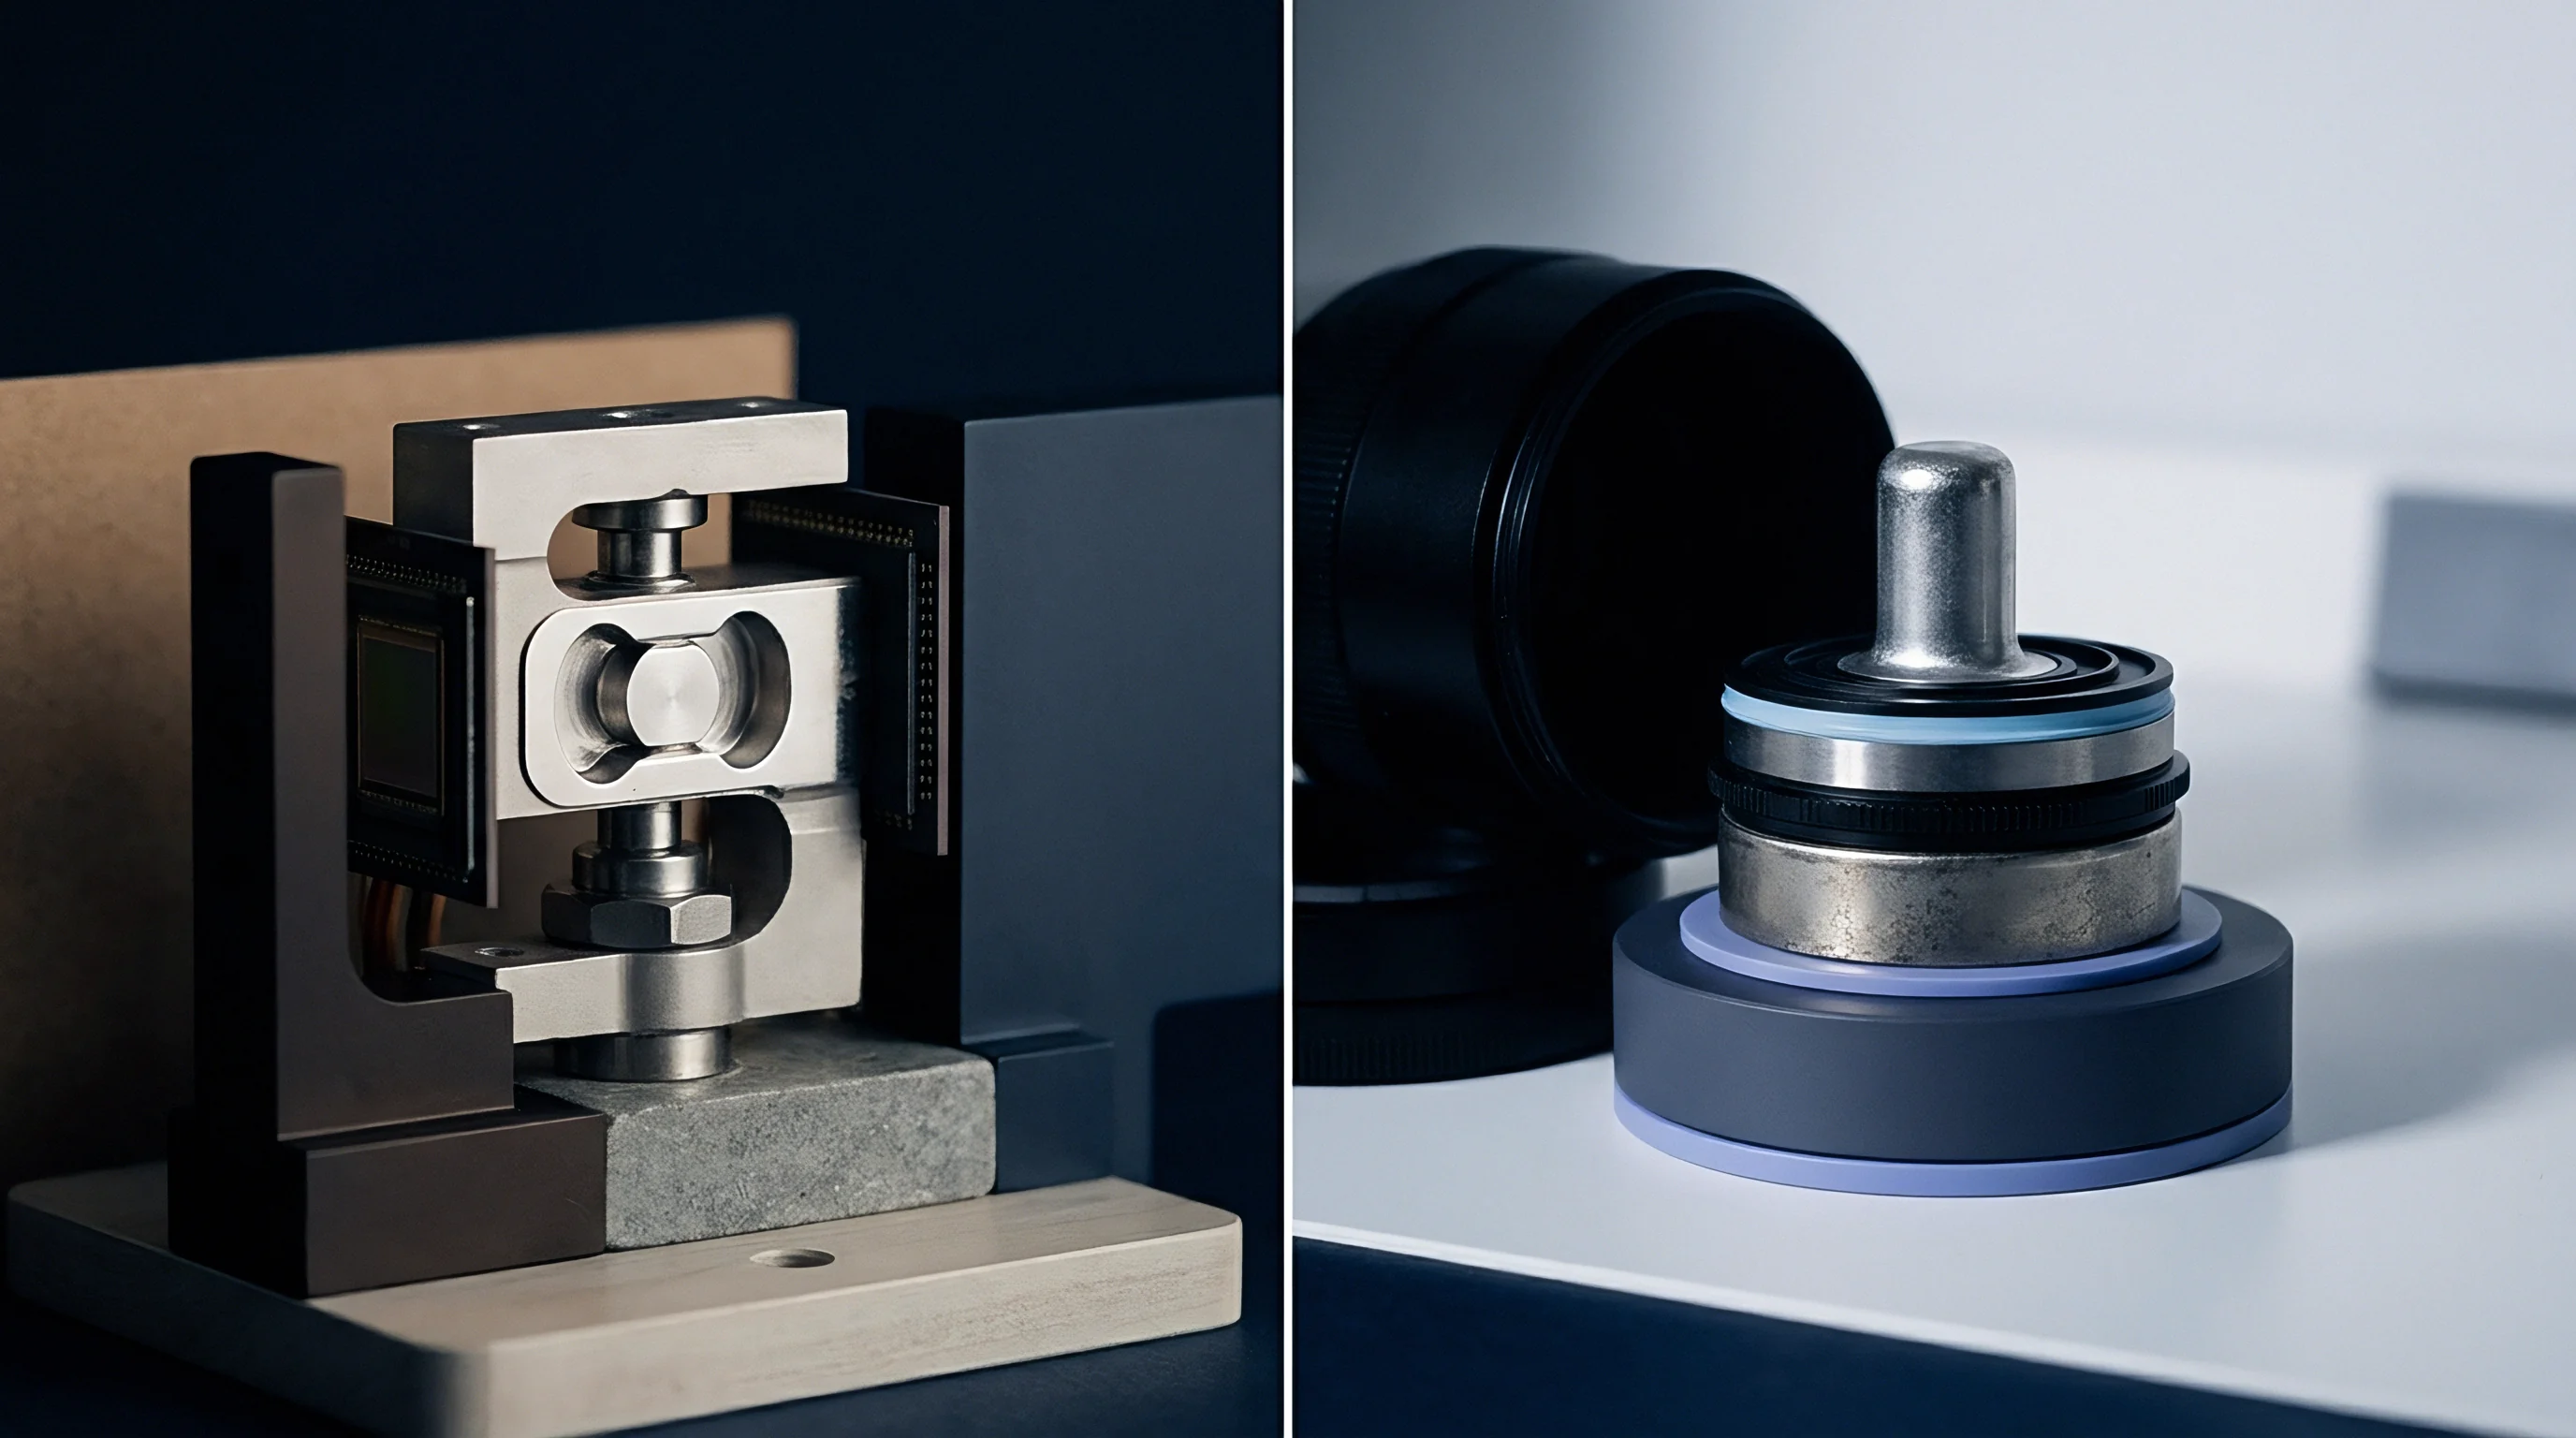
Microstructural Relaxation Mechanisms in Polysilicon and Silicon Carbide
Polycrystalline thin films experience inelastic strain relief at elevated operating temperatures. Grain boundaries in polysilicon act as high-energy sinks where atoms diffuse rapidly under stress. At lower stress levels and moderate temperatures, Coble creep dominates as vacancy diffusion along grain boundaries permits localized grain sliding.
Higher temperatures and stress levels trigger Nabarro-Herring creep, driving vacancy transport through the bulk crystal grains. Dislocation climb and glide also contribute to inelastic strain whenever local shear stresses cross the critical resolved shear stress of the silicon crystallographic planes.
Silicon carbide offers far higher thermal stability than silicon, yet thin-film deposition on dissimilar substrates still generates severe thermal expansion mismatch stresses. Amorphous boundary layers in silicon carbide microstructures relax under thermal exposure, redistributing internal stress fields toward structural equilibrium. Because piezoresistive strain sensors rely on stable crystalline lattices to maintain precise gauge factors, any atomic shift to relieve stress alters the piezoresistive coefficient.
This produces an uncalibrated signal offset that cannot be distinguished from a true physical pressure or force input.
Resonant MEMS devices are especially sensitive to structural stress relaxation. A micro-resonator’s natural frequency depends directly on its effective mass and structural stiffness, both of which are tied to internal stress fields. As stress relaxes during operation, stiffness drops, causing a continuous downward drift in resonant frequency.
In capacitive pressure sensors, stress relaxation within thin silicon diaphragms alters structural deflection at zero differential pressure, producing zero-point offset drift that accumulates over months of continuous high-temperature service.

Packaging Interface Stress Relief and Substrate Mismatch
Die attach adhesives, glass frits, and eutectic solder bonds transmit thermal expansion mismatch forces straight into active MEMS structures. Ceramic packaging substrates, metal headers, and silicon sensor dies expand at different rates during thermal cycles. Above one hundred fifty degrees Celsius, eutectic gold-silicon, gold-germanium, and gold-tin braze layers undergo plastic deformation and viscoelastic creep.
As the die attach material relaxes, the mechanical constraint on the silicon die alters, transferring residual package stresses directly into the sensing element.
A polysilicon micro-beam held at 300°C under an initial residual stress of 120 MPa exhibits a baseline relaxation rate of 4.2 micro strain per thousand hours.
Glass frit seals, commonly used for hermetic cavity capping, undergo structural relaxation near their glass transition temperatures. Micro-voids, binder residue, and thermal contraction gradients within the glass matrix lead to viscous flow during extended operating hours. This viscous relaxation changes the bending moment applied to the underlying MEMS substrate.
Piezoresistors located near die edges or structural anchors pick up these localized strain alterations, unbalancing Wheatstone bridges and introducing non-linear output errors across the operational temperature range.
Time-dependent micro-strain relaxation follows non-linear kinetic relationships. In primary relaxation regimes, strain relief occurs rapidly as high-energy stress concentrations redistribute. The secondary regime settles into a slower, quasi-steady rate of strain alteration governed by thermally activated activation energies.
Empirical models typically fit this behavior using modified logarithmic or power-law functions:
In these formulations, total strain relaxation equals initial strain plus the product of a pre-exponential material constant, time raised to a power-law exponent, and an Arrhenius term containing activation energy, the Boltzmann constant, and absolute temperature. Alternatively, logarithmic models represent the decay rate as proportional to the natural logarithm of time, scaled by a characteristic relaxation time constant.
Dislocations move through crystalline grains over time. When lot screening underestimates time-dependent strain relaxation rates, unconditioned production lots enter operational service with hidden calibration instability. Left unmonitored, stress relief can push sensor zero points beyond allowed system tolerance limits within weeks of high-temperature deployment.
Failing to quantify strain relaxation kinetics leads directly to premature field failures, unbudgeted recalibration trips, and compromised measurement integrity in safety-critical industrial applications.
Derivation
Constructing a metrologically valid uncertainty budget for time-dependent dimensional drift demands systematic accounting of Type A and Type B contributions. Standard uncertainty calculations follow the Guide to the Expression of Uncertainty in Measurement (JCGM 100), combining empirical statistical scatter with calibrated hardware specifications. When evaluating micro-strain relaxation during lot acceptance, metrologists map each physical mechanism to an explicit variance component, ensuring traceability back to national measurement standards.
Developing the uncertainty budget begins by identifying every independent variable influencing strain relaxation measurements. Environmental factors during thermal soak screening include furnace spatial temperature uniformity, temporal stability, signal acquisition voltage noise, optical alignment tolerances, and Wheatstone bridge thermal hysteresis. Mechanical factors cover fixture clamping stress, contact probe force variations, and coefficient of thermal expansion uncertainties for reference artifacts.
Each component contributes a standard uncertainty value that propagates into the final micro-strain relaxation budget.

Quantifying Type a and Type B Standard Uncertainty Components
Repeated measurements across thermal soak cycles yield empirical scatter that defines random experimental variance. Type A standard uncertainty derives from repeated strain readout measurements taken across sample cohorts subjected to identical temperature profiles. Calculating the experimental standard deviation of the mean establishes the Type A uncertainty component for short-term signal repeatability and random mechanical drift within the soak furnace.
Type B standard uncertainties represent evaluated systematic limits provided by calibration certificates, physical constants, or manufacturer specifications. Thermocouple calibration certificates state expanded uncertainty figures that translate into temperature-induced strain uncertainty via the material thermal expansion coefficient. High-precision digital multimeters measuring Wheatstone bridge outputs contribute voltage measurement uncertainty, which propagates through the piezoresistive gauge factor equation into strain measurement uncertainty.
Uncertainty in the empirical gauge factor itself, determined during preliminary sensor characterization, adds a dominant systematic term to the combined uncertainty budget.
Systematic bias compromises measurement confidence. Thermal gradients inside soak chambers create spatial temperature variations across test fixtures; even a spatial gradient of zero point five degrees Celsius across a silicon substrate introduces differential thermal strain that mimics time-dependent relaxation. Quantifying furnace spatial uniformity requires multi-point thermocouple mapping, treating the maximum observed gradient as a rectangular probability distribution to compute its standard uncertainty contribution.
Combined Standard Uncertainty and Expanded Uncertainty Calculations
Sensitivity coefficients convert distinct physical noise source variances into equivalent micro-strain output uncertainty. Defined as the partial derivative of the strain measurement function with respect to each input quantity, multiplying each standard uncertainty by its corresponding sensitivity coefficient yields the individual uncertainty contribution in units of micro-strain.
Summing the squared individual uncertainty contributions under the root-sum-squares method yields the combined standard uncertainty. Metrologists then evaluate effective degrees of freedom for the combined uncertainty using the Welch-Satterthwaite formula, accounting for the relative degrees of freedom associated with Type A statistical measurements and Type B systemic bounds. The resulting effective degrees of freedom dictate the appropriate coverage factor, k, required to achieve an expanded measurement uncertainty at a ninety-five point forty-five percent confidence interval.
Uncertainty propagates through the calculation chain. Table 1 details a standard GUM-compliant uncertainty budget developed for a three hundred degree Celsius micro-strain relaxation lot acceptance test using high-precision piezoresistive strain monitor artifacts.
| Uncertainty Source | Type | Distribution | Standard Uncertainty (ui) | Sensitivity Coeff. (ci) | Strain Contribution (με) | Degrees of Freedom (vi) |
|---|---|---|---|---|---|---|
| Soak Chamber Temporal Stability | B | Rectangular | 0.12 °C | 2.6 με/°C | 0.312 | infty |
| Spatial Thermal Gradient | B | Rectangular | 0.29 °C | 2.6 με/°C | 0.754 | infty |
| DMM Voltage Readout Accuracy | B | Normal | 1.2 $mu$V | 0.15 με/$mu$V | 0.180 | 50 |
| Bridge Gauge Factor Calibration | B | Normal | 0.012 GF | 8.5 με/GF | 0.102 | 100 |
| Fixture Mechanical Drift | B | Rectangular | 0.05 μ m | 4.0 με/μ m | 0.200 | infty |
| Repeatability (Type A Statistical) | A | Normal | 0.45 με | 1.0 | 0.450 | 19 |
| Combined Standard Uncertainty uc = 0.982 με; Effective Degrees of Freedom veff = 84; Expanded Uncertainty U (k=2) = 1.964 με. | ||||||
Foundries specify baseline material properties, but evaluating lot acceptance data requires categorizing strain relaxation failure modes during screening to isolate material defects from packaging or assembly anomalies.
- Anisotropic Grain Boundary Migration occurs in heavily doped polysilicon resistors, driving localized resistance shifts that unbalance Wheatstone bridge symmetry under thermal stress.
- Substrate CTE Mismatch Fatigue manifests as micro-cracking along die-attach solder margins, causing sudden stress redistribution across the active sensor diaphragm.
- Passivation Layer Viscoelastic Flow under high-temperature exposure alters localized surface strain, creating slow, continuous output voltage creep.
- Anchor Point Dislocation Motion in resonant micro-structures reduces structural quality factor and shifts baseline resonant frequencies during initial thermal conditioning.
Structuring the combined standard uncertainty by isolating individual thermal and mechanical contributions keeps measurement traceability defensible under third-party audit. Calculating expanded uncertainty at a ninety-five percent confidence interval satisfies laboratory accreditation guidelines and ensures lot acceptance decisions rest on verified statistical confidence limits.
Compliance with ISO 17025 clause 7.8.4 requires every lot acceptance report to state expanded measurement uncertainty alongside decision rules applied for compliance statements.
ISO/IEC 17025 Clause 7.8.4 dictates that calibration certificates and lot acceptance test reports shall include the expanded uncertainty of measurement, the coverage factor, and coverage probability. Incorporating this requirement into purchase specifications forces foundries to demonstrate that their strain relaxation measurement equipment uncertainty occupies less than one-fifth of the total specified product tolerance band, preventing false lot acceptances caused by uncalibrated test instrumentation.

Sampling
Acceptance testing for production lots of high-temperature micro sensors balances statistical confidence against environmental screening expenses. Extended high-temperature soak testing is inherently destructive and time-consuming, making one hundred percent lot screening commercially non-viable for mass production. Establishing variables sampling plans in accordance with ANSI/ASQ Z1.9 or ISO 3951 enables quality engineers to evaluate strain relaxation compliance using small, statistically representative sample cohorts.
Statistical acceptance criteria depend on defining clear upper and lower specification limits for time-dependent micro-strain relaxation. For high-temperature MEMS pressure sensors, the maximum allowable zero-offset shift after a two hundred fifty hour soak at three hundred degrees Celsius may be fixed at ten micro-strains. The lot acceptance procedure evaluates whether the statistical distribution of strain relaxation within the sample cohort guarantees, with a designated confidence level, that the overall lot defect rate remains below the Acceptable Quality Limit (AQL) and Lot Tolerance Percent Defective (LTPD).
Which Statistical Tolerance Limits Defend against Elevated Temperature Drift?
Variables inspection under ANSI Z1.9 establishes lot acceptance by comparing measured strain relaxation statistics against specified upper tolerance limits. Assuming a normal distribution of micro-strain relaxation rates across the manufactured lot, the quality engineer computes the lot sample mean and sample standard deviation. An upper quality index is derived by subtracting the sample mean from the upper specification limit and dividing the result by the sample standard deviation.
If the upper quality index exceeds the critical acceptance constant designated for the chosen inspection level and sample size, the production lot passes acceptance screening.
Sample sizes govern statistical power. Small sample cohorts increase consumer risk, raising the probability that a bad lot with excessive strain relaxation drift passes inspection. Conversely, overly large sample cohorts elevate testing costs and destroy valuable inventory.
Utilizing zero-defect attribute sampling plans (ANSI/ASQ Z1.4 c=0) offers an alternative when variable distribution normality cannot be assumed, though attribute plans demand larger sample sizes to achieve equivalent statistical confidence levels.

Variables Acceptance Criteria and Consumer Risk Optimization
Acceptance constants scaled to lot size define the maximum allowable standard deviation of strain relaxation across sample cohorts. Consider a production lot of five hundred high-temperature SOI strain sensors destined for aerospace turbine pressure monitoring. The upper specification limit for strain relaxation drift after an accelerated thermal soak is set at USL = 12.0 micro-strains.
Inspection Level II, Single Sampling Plan under ANSI Z1.9 specifies a sample size of n = 21 units for a lot size of 500.
Thermal soak times affect lot cost. To accelerate testing, the sample cohort undergoes a short-duration, elevated-temperature soak designed to produce equivalent micro-strain relaxation to thousands of hours at nominal operating temperature. Applying kinetic acceleration models allows test engineers to compress a five-thousand-hour operating lifespan into a two-hundred-fifty-hour soak screen.
| Test Temp (°C) | Equiv. Service Hours | Acceleration Factor (AF) | Soak Duration (h) | Sample Mean (barx) | Std Dev (s) | Quality Index (QU) | Lot Action |
|---|---|---|---|---|---|---|---|
| 250 | 1,000 | 4.0 | 250 | 5.2 με | 1.1 με | 6.18 | Accept |
| 300 | 5,000 | 20.0 | 250 | 7.8 με | 1.8 με | 2.33 | Accept |
| 325 | 11,500 | 46.0 | 250 | 9.4 με | 2.9 με | 0.90 | Reject |
| 350 | 25,000 | 100.0 | 250 | 14.1 με | 4.2 με | -0.50 | Reject |
In setting lot rejection thresholds, the trade-off between consumer risk and supplier risk governs sample sizing. In the worked calculation for the 300°C soak test, the critical acceptance constant for n = 21 at an AQL of 1.0% is kaccept = 1.91. Because the computed upper quality index QU = (12.0 – 7.8) / 1.8 = 2.33 exceeds kaccept = 1.91, the lot passes acceptance testing with verified statistical margin.
Temperature gradients distort piezoresistive outputs. Standardizing lot acceptance protocols requires establishing clear decision rules and documentation requirements before initiating thermal screening.
- Pre-Soak Thermal Stabilization requires baking sample cohorts at one hundred fifty degrees Celsius for twenty-four hours to drive off moisture and relieve packaging assembly stresses before taking baseline strain measurements.
- Zero Point Baseline Verification dictates taking baseline resistance readings at twenty-five degrees Celsius inside an environmentally controlled metrology chamber with relative humidity held below forty percent.
- Isothermal Soak Exposure mandates maintaining thermal soak chamber spatial uniformity within plus or minus zero point five degrees Celsius for the entire duration of the accelerated test.
- Post-Soak Drift Calculation specifies re-measuring sample cohorts at twenty-five degrees Celsius exactly twenty-four hours after furnace extraction to ensure full thermal equilibrium before evaluating micro-strain shifts.
Accelerating thermal soak schedules beyond the material transition temperature invalidates kinetic strain relaxation models and yields false rejection rates.
Observed lot rejections frequently stem from phase change artifacts or non-representative thermal shock induced during rapid cooling, even while micro-strain relaxation rates remain within tolerance under steady-state operating conditions.
Rig
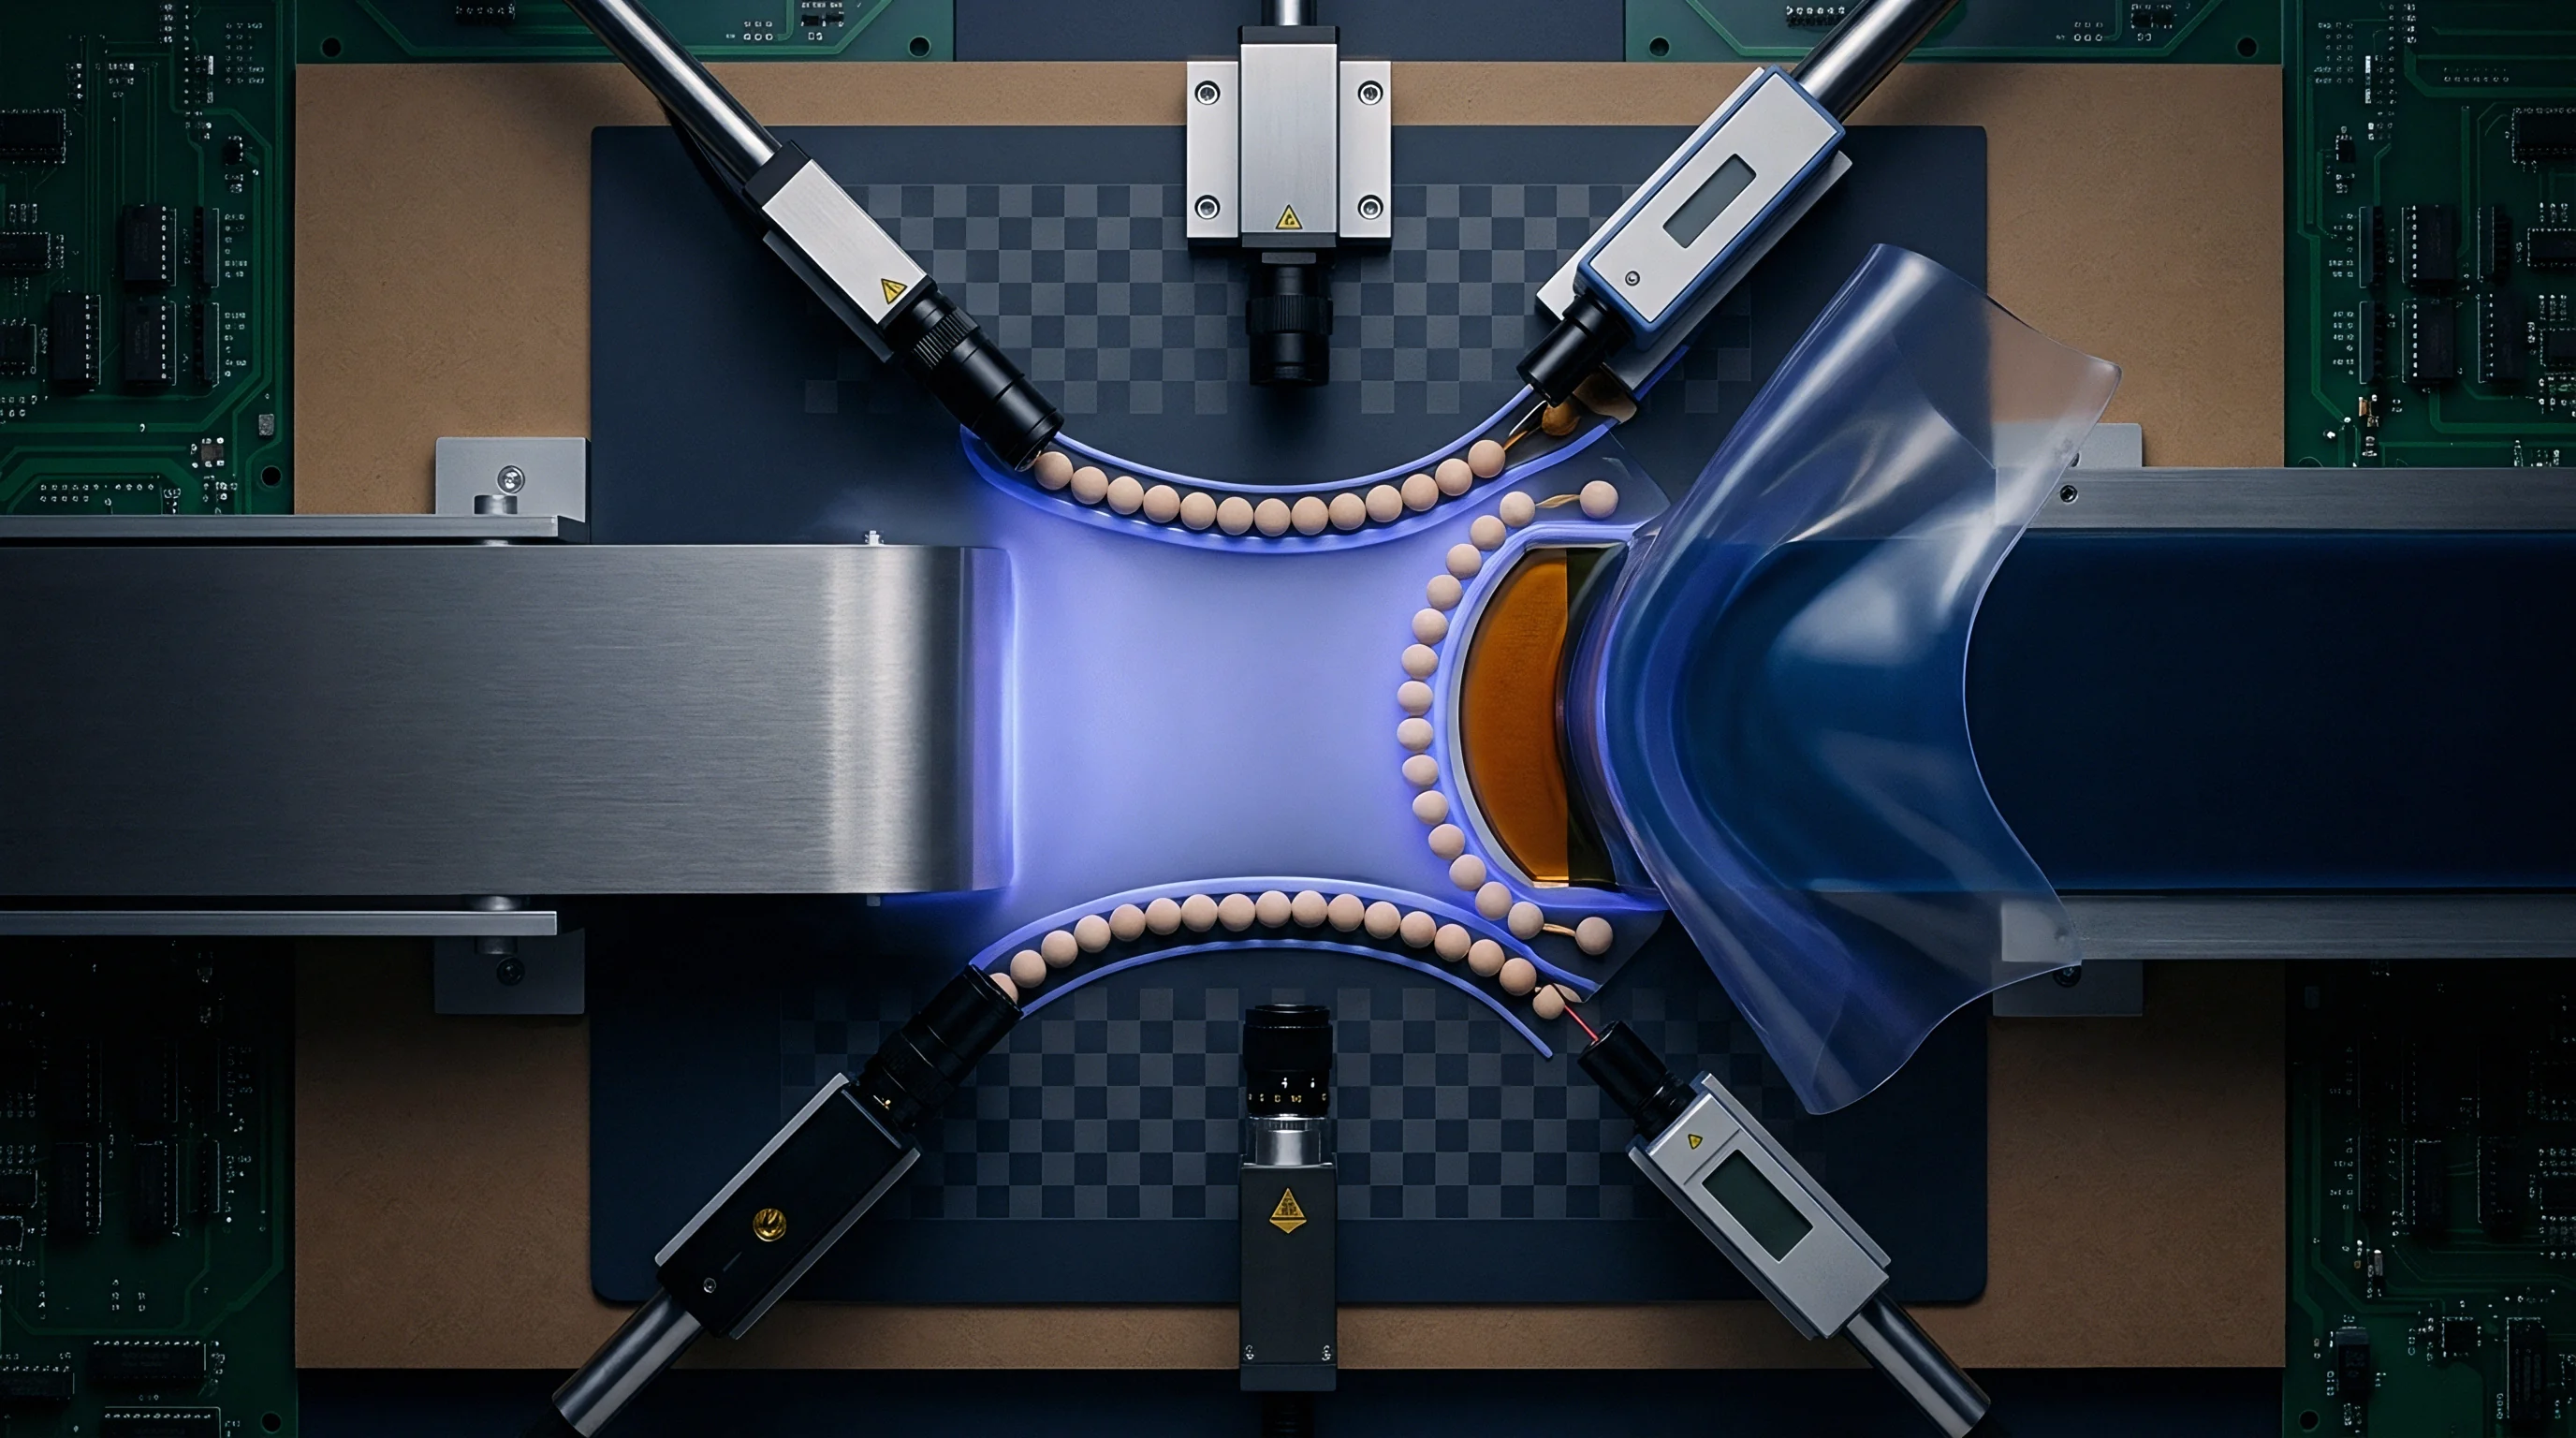
High-precision strain measurement at temperatures exceeding two hundred degrees Celsius demands strict environmental isolation and ultra-stable instrumentation. Test fixtures must hold MEMS devices securely without importing parasitic mechanical stress from thermal expansion mismatches between the fixture and the sensor package. Constructing a high-temperature metrology bench demands rigid quartz or Invar structures, precision low-noise power supplies, and automated optical or electrical readout arrays capable of micro-strain resolution over long testing intervals.
Quartz fixtures isolate mechanical drift. Standard metal test trays undergo significant thermal expansion and creep deformation at elevated temperatures, generating mechanical noise that overrides true MEMS micro-strain relaxation signals. Fused quartz exhibits a coefficient of thermal expansion below zero point five parts per million per degree Celsius, providing an exceptionally stable mechanical platform for high-temperature soak experiments.
Specially designed quartz push-rods transmit mechanical displacements from inside high-temperature muffle furnaces out to room-temperature optical displacement sensors or linear variable differential transformers.

Thermal Soak Fixturing and Environmental Isolation Methods
Quartz tube furnaces configured with multi-zone heating elements eliminate spatial temperature gradients across the device under test. PID temperature controllers utilizing calibrated Platinum-Rhodium thermocouples maintain temporal thermal stability within plus or minus zero point one degree Celsius over thousands of soak hours. Fixtures inside the furnace host ceramic zero-insertion-force sockets with high-temperature platinum or nickel wire interconnects, ensuring reliable electrical contact to active MEMS Wheatstone bridges without introducing contact resistance drift.
Because precision sensors demand rigid mounting, contact probe force variation represents a primary source of systematic strain measurement error; spring-loaded pogo pins used in standard test sockets lose temper and relax force when exposed to continuous temperatures above two hundred degrees Celsius. Utilizing micro-welded platinum wire leads or high-temperature mechanical clamping frames prevents contact force decay from obscuring time-dependent strain relaxation trends within the active sensor substrate.
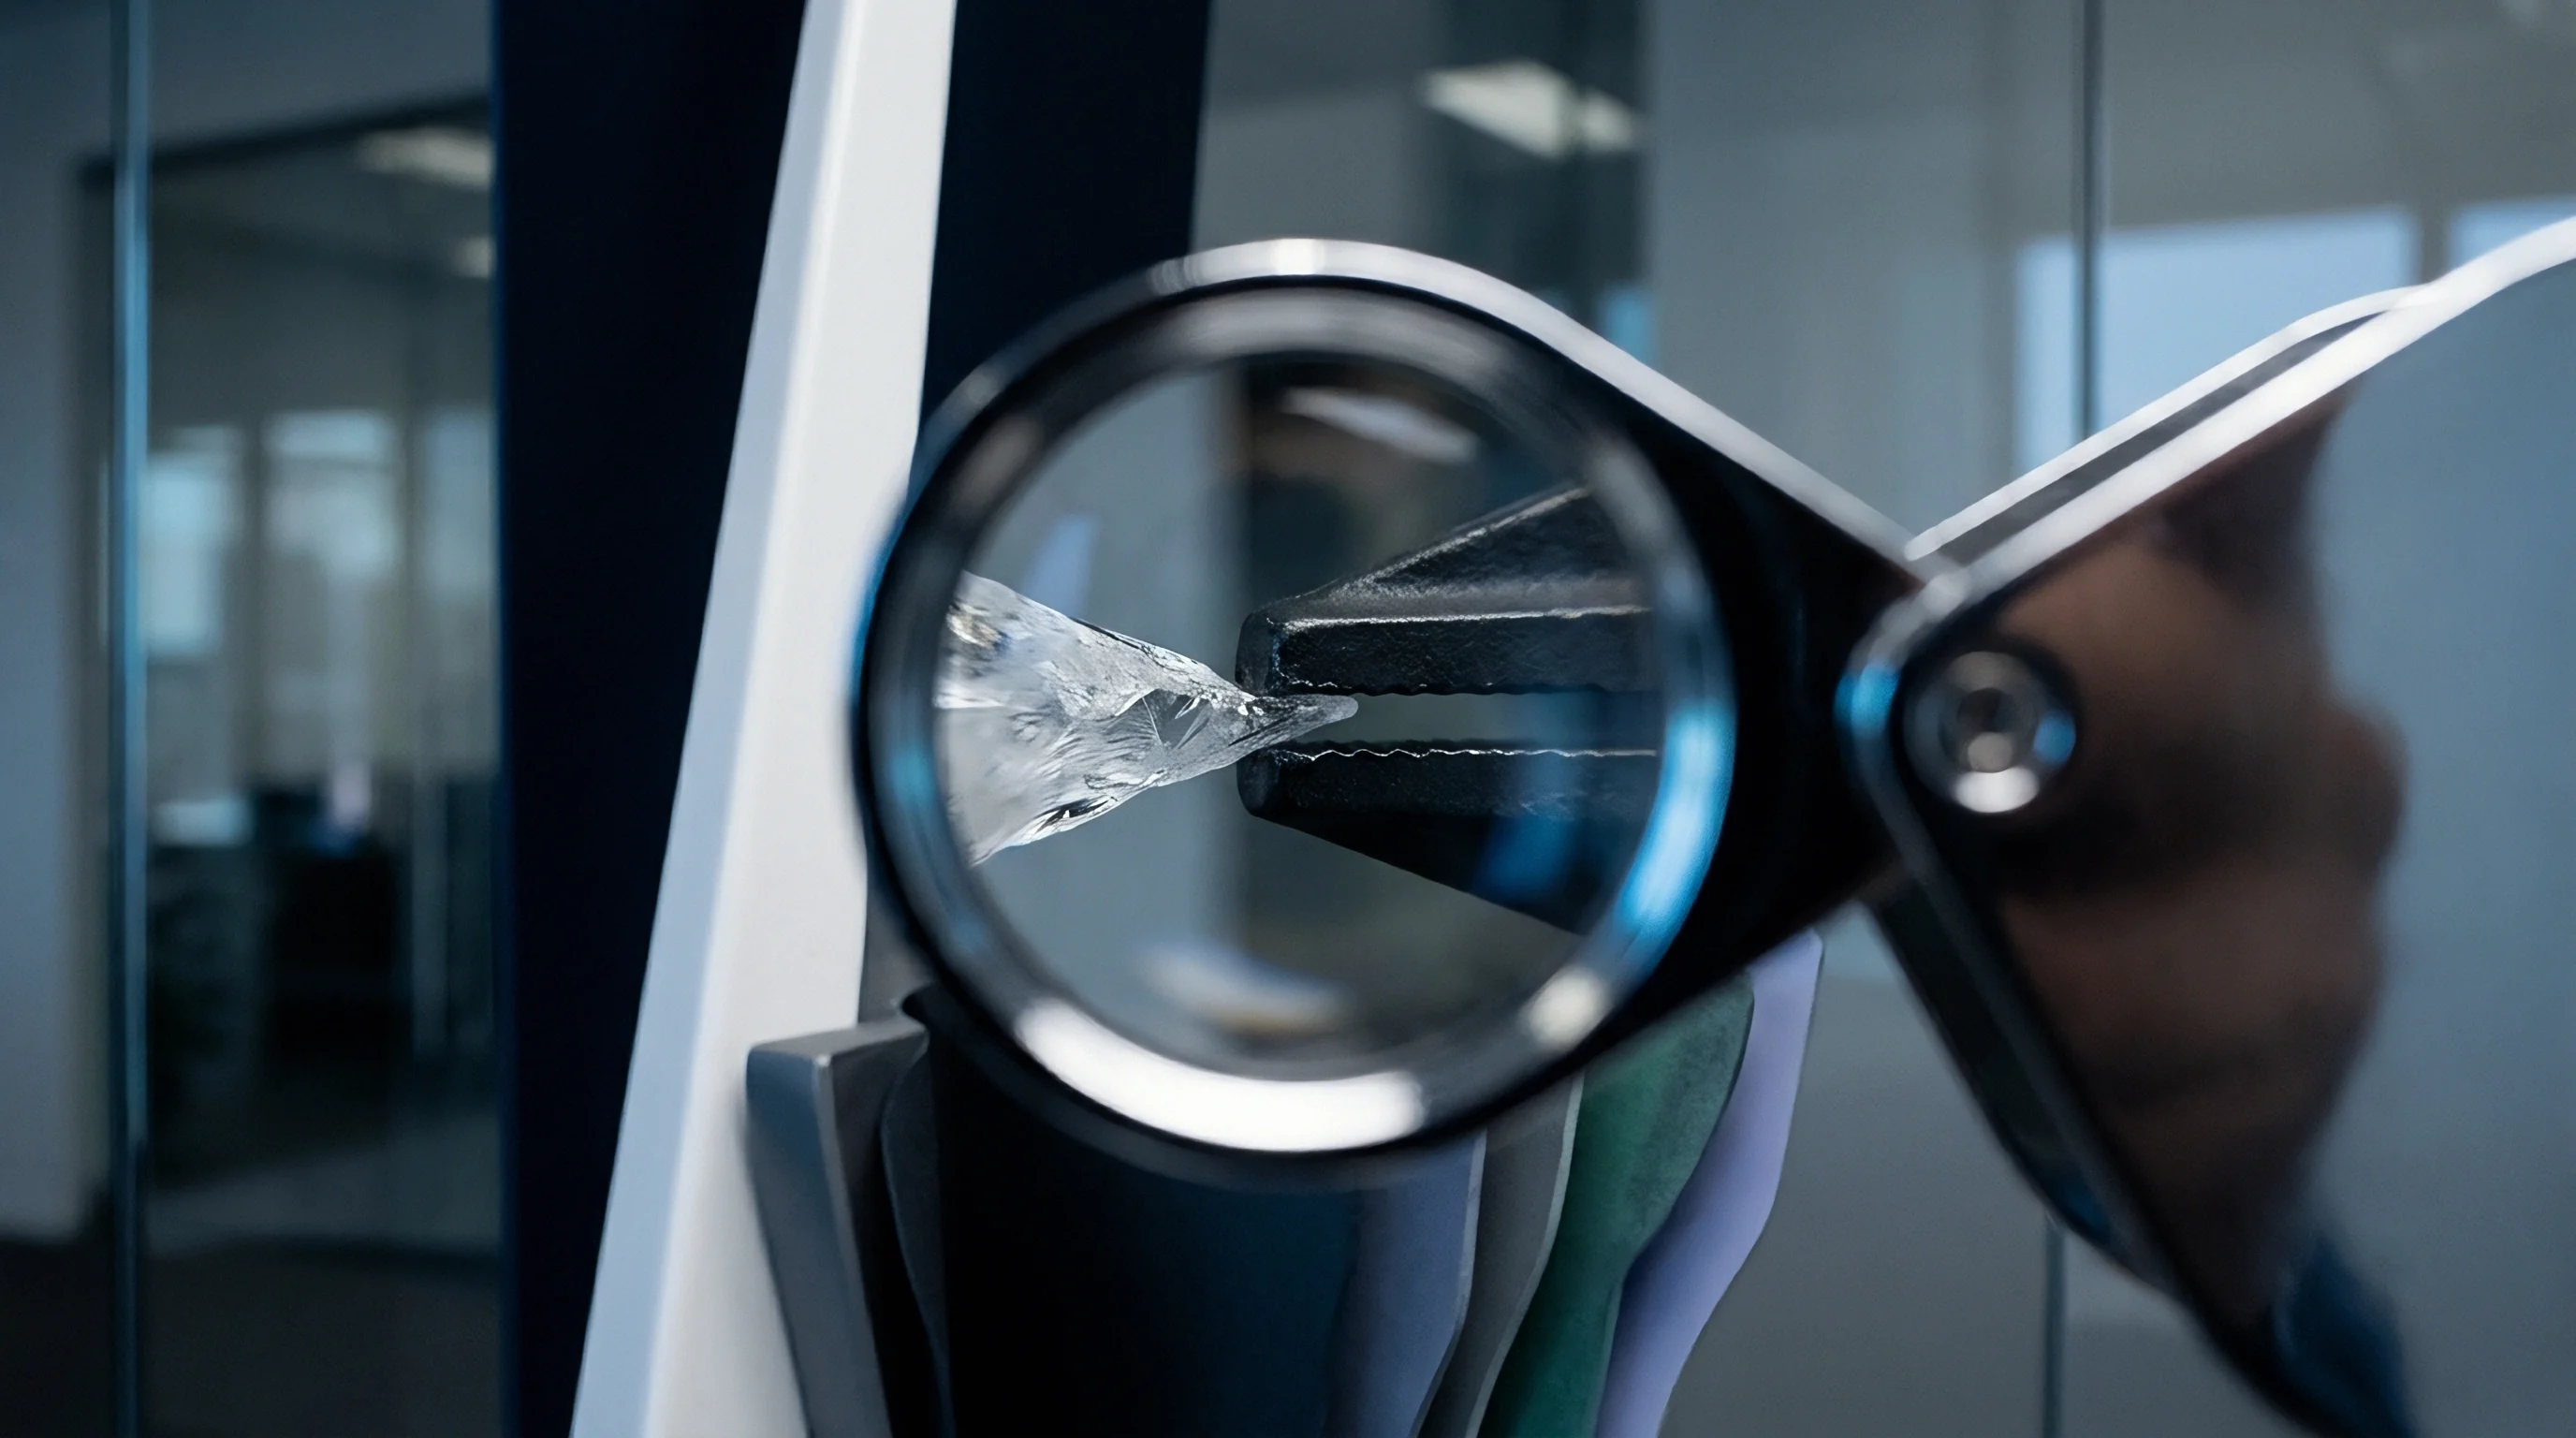
In-Situ Piezoresistive and Optical Strain Signal Acquisition
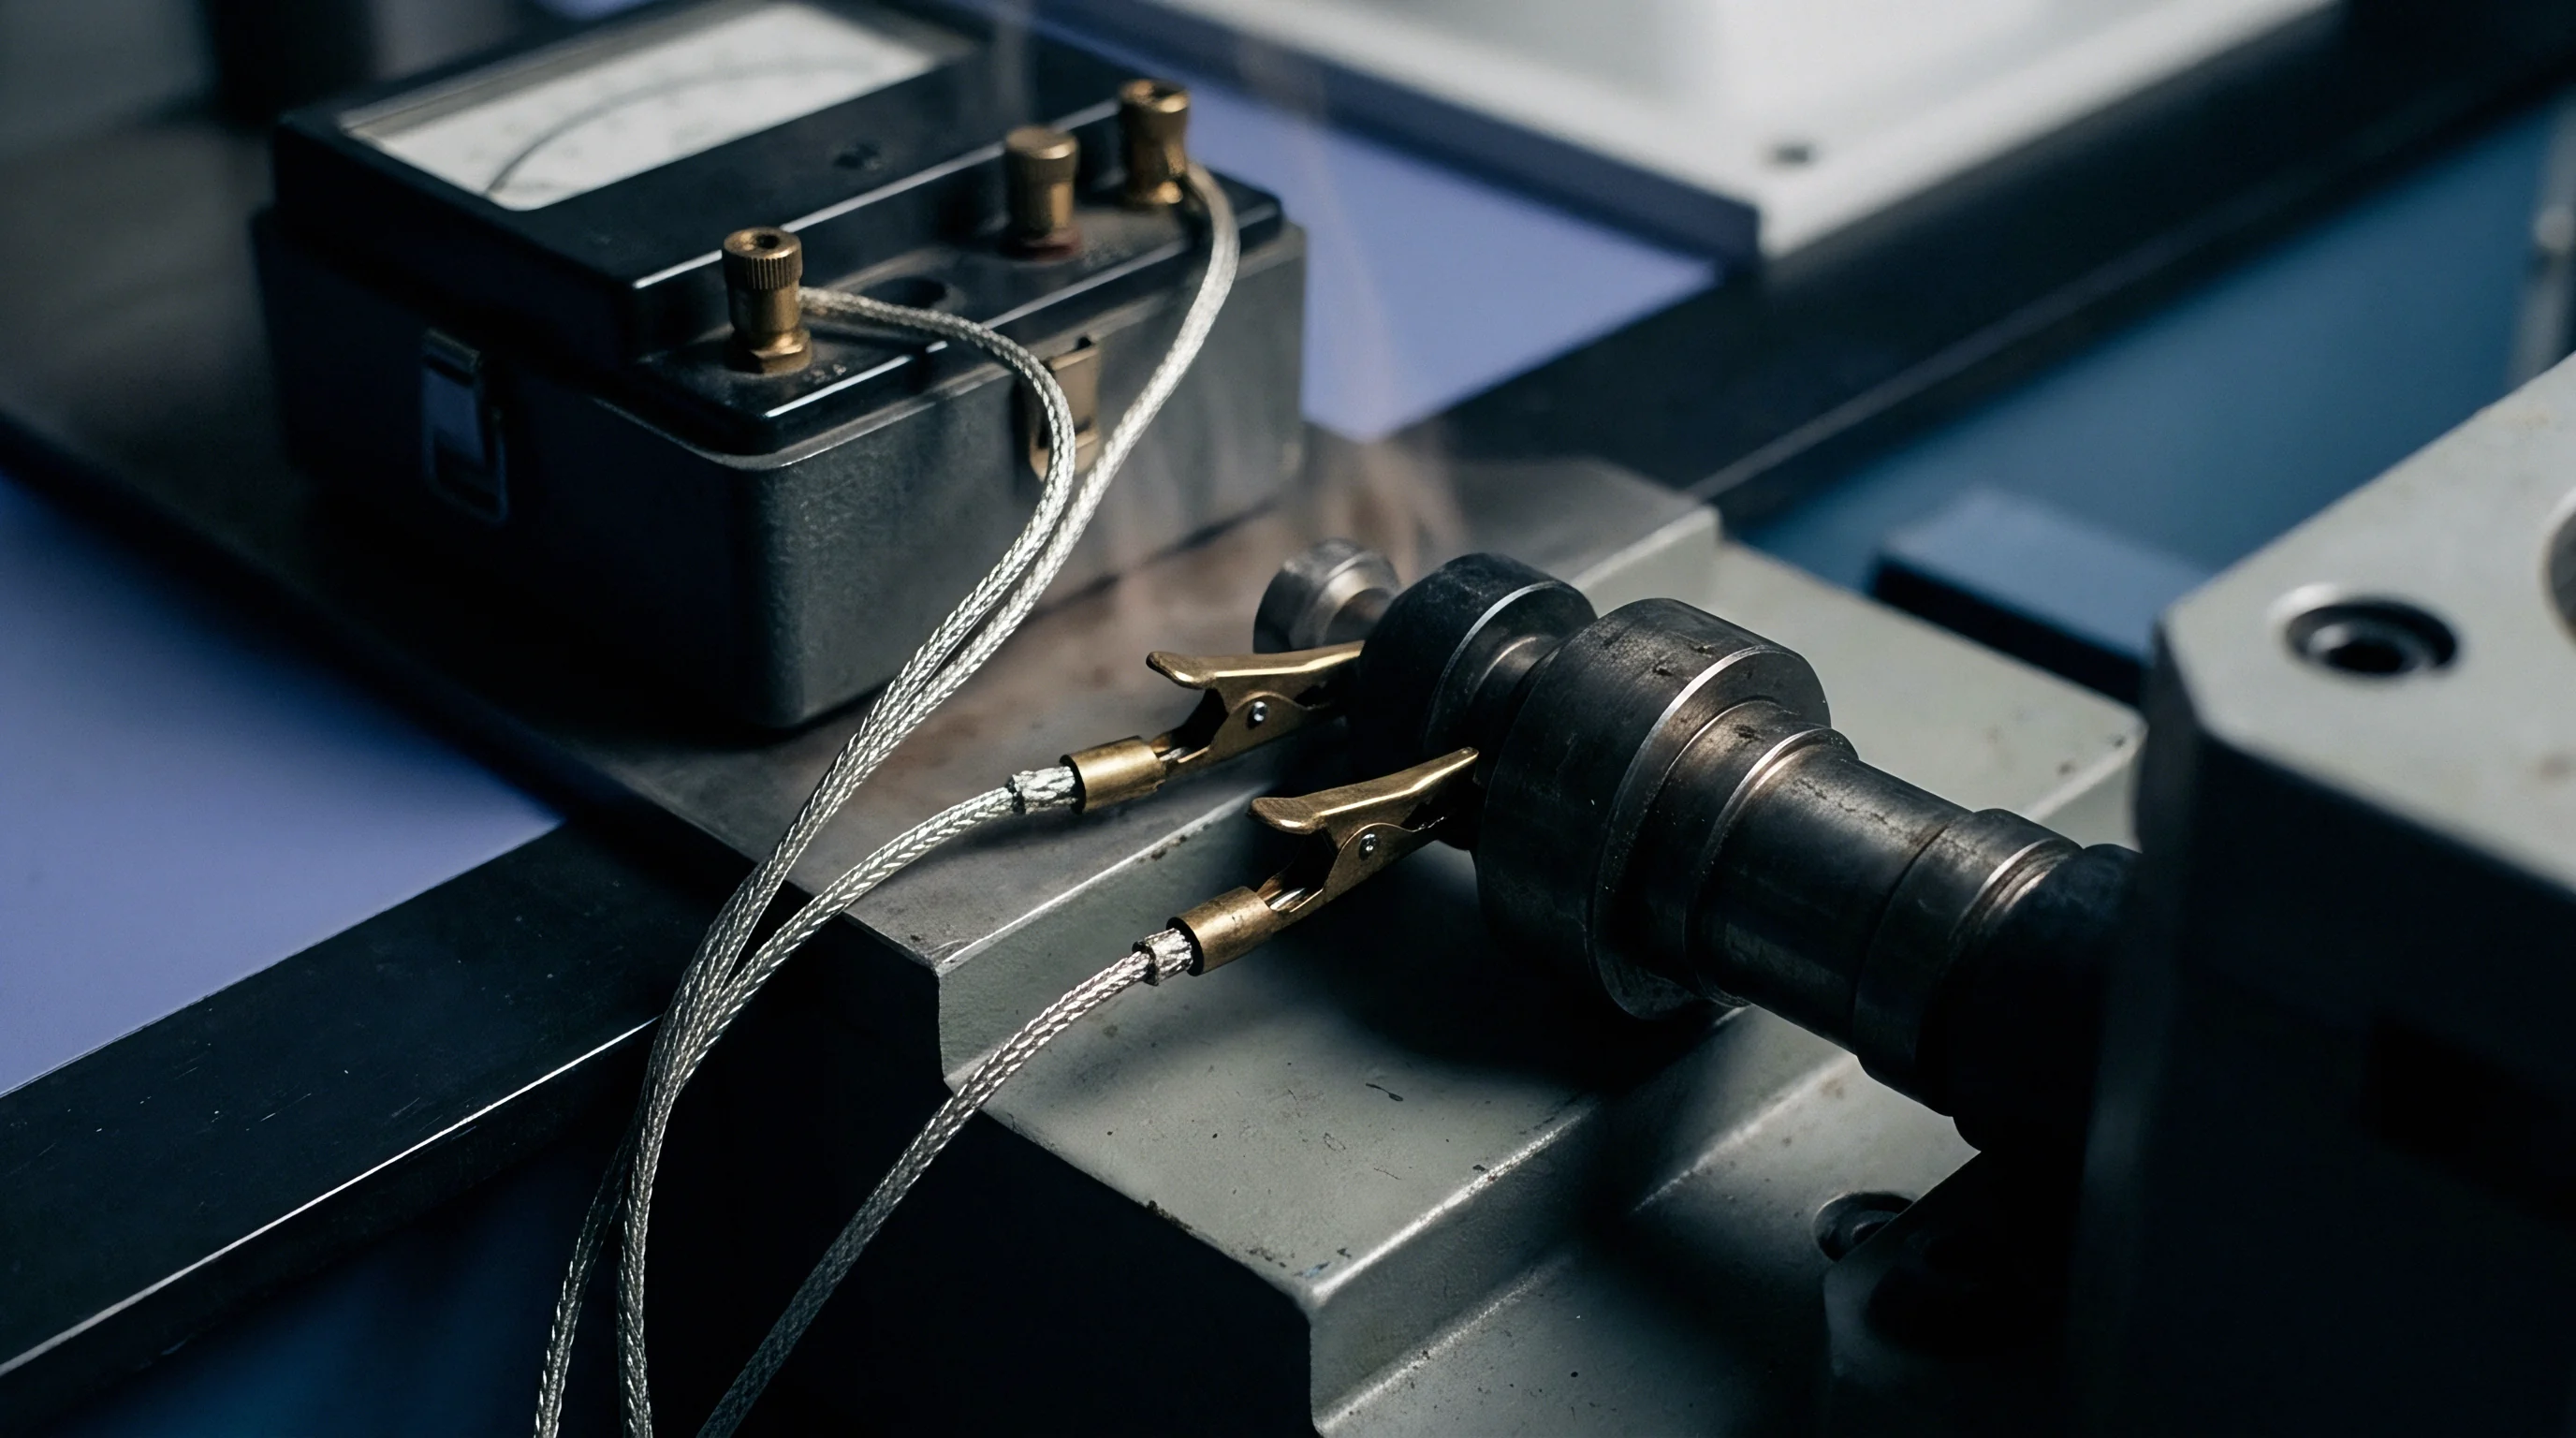
Laser doppler vibrometry and direct Wheatstone bridge voltage measurements capture continuous micro-strain changes during high temperature exposure. In-situ electrical testing applies constant-current excitation to piezoresistive bridges, measuring differential output voltages with seven-and-a-half digit multimeters. High input impedance electrometers prevent loading errors across bridge nodes, while shielded twisted-pair cables routed through ceramic conduits reduce electromagnetic interference generated by furnace heating elements.
Optical strain measurement techniques, such as digital image correlation and electronic speckle pattern interferometry, observe structural deformations directly through quartz viewports in the furnace wall. Non-contact optical methods eliminate mechanical loading imposed by contact probes, providing unbiased strain fields across the sensor die. Thermal refraction gradients inside the furnace atmosphere are suppressed by purging quartz tube chambers with steady, ultra-high-purity argon or nitrogen gas flows.
Tracking thermal soak profiles across three temperature steps bounds the empirical activation energy of micro-strain relaxation to within plus or minus zero point zero four electron-volts. Executing a defensible lot verification procedure demands strict adherence to sequential operational protocols:
- Mount sample cohort devices into fused quartz test fixtures using high-temperature ceramic alignment guides.
- Attach calibrated Platinum-Rhodium thermocouples directly to the fixture base adjacent to active sensor packages.
- Connect platinum lead wires to high-impedance digital multimeters configured for continuous, low-noise voltage sampling.
- Apply steady argon gas purge to the furnace chamber at a verified flow rate of two liters per minute to prevent surface oxidation.
- Ramp furnace temperature at two degrees Celsius per minute to the target soak temperature to minimize thermal shock stress.
- Maintain isothermal soak conditions for two hundred fifty consecutive hours while recording continuous bridge voltage output data.
- Cool furnace at one degree Celsius per minute to ambient room temperature before taking final calibration verification sweeps.
Thermal gradient imbalances inside soak chambers introduce parasitic strain signals that mimic micro-structural material relaxation.
Fixtures designed without low-expansion thermal isolation components expand unpredictably, masking true material relaxation with mechanical fixture noise.


Exposure
Commercial liabilities associated with unmonitored strain relaxation in high-temperature MEMS scale exponentially over extended service lives. When sensors deployed in gas turbines, downhole oil exploration tools, or automotive exhaust systems experience uncalibrated drift, system control loops receive false input signals. Incorrect pressure or force readings lead to inefficient combustion control, emergency system shutdowns, or catastrophic mechanical failures, triggering severe contractual warranty claims and product recall liabilities for sensor manufacturers.
Foundries and package integrators face substantial economic risk when lot acceptance thresholds are negotiated without rigorous uncertainty budgets. Accepting production lots with unquantified strain relaxation rates transfers unhedged technical risk down the supply chain. System integrators who install unconditioned sensors into subsea or aerospace modules bear the immense cost of field service replacements when sensors wander out of specification prematurely.
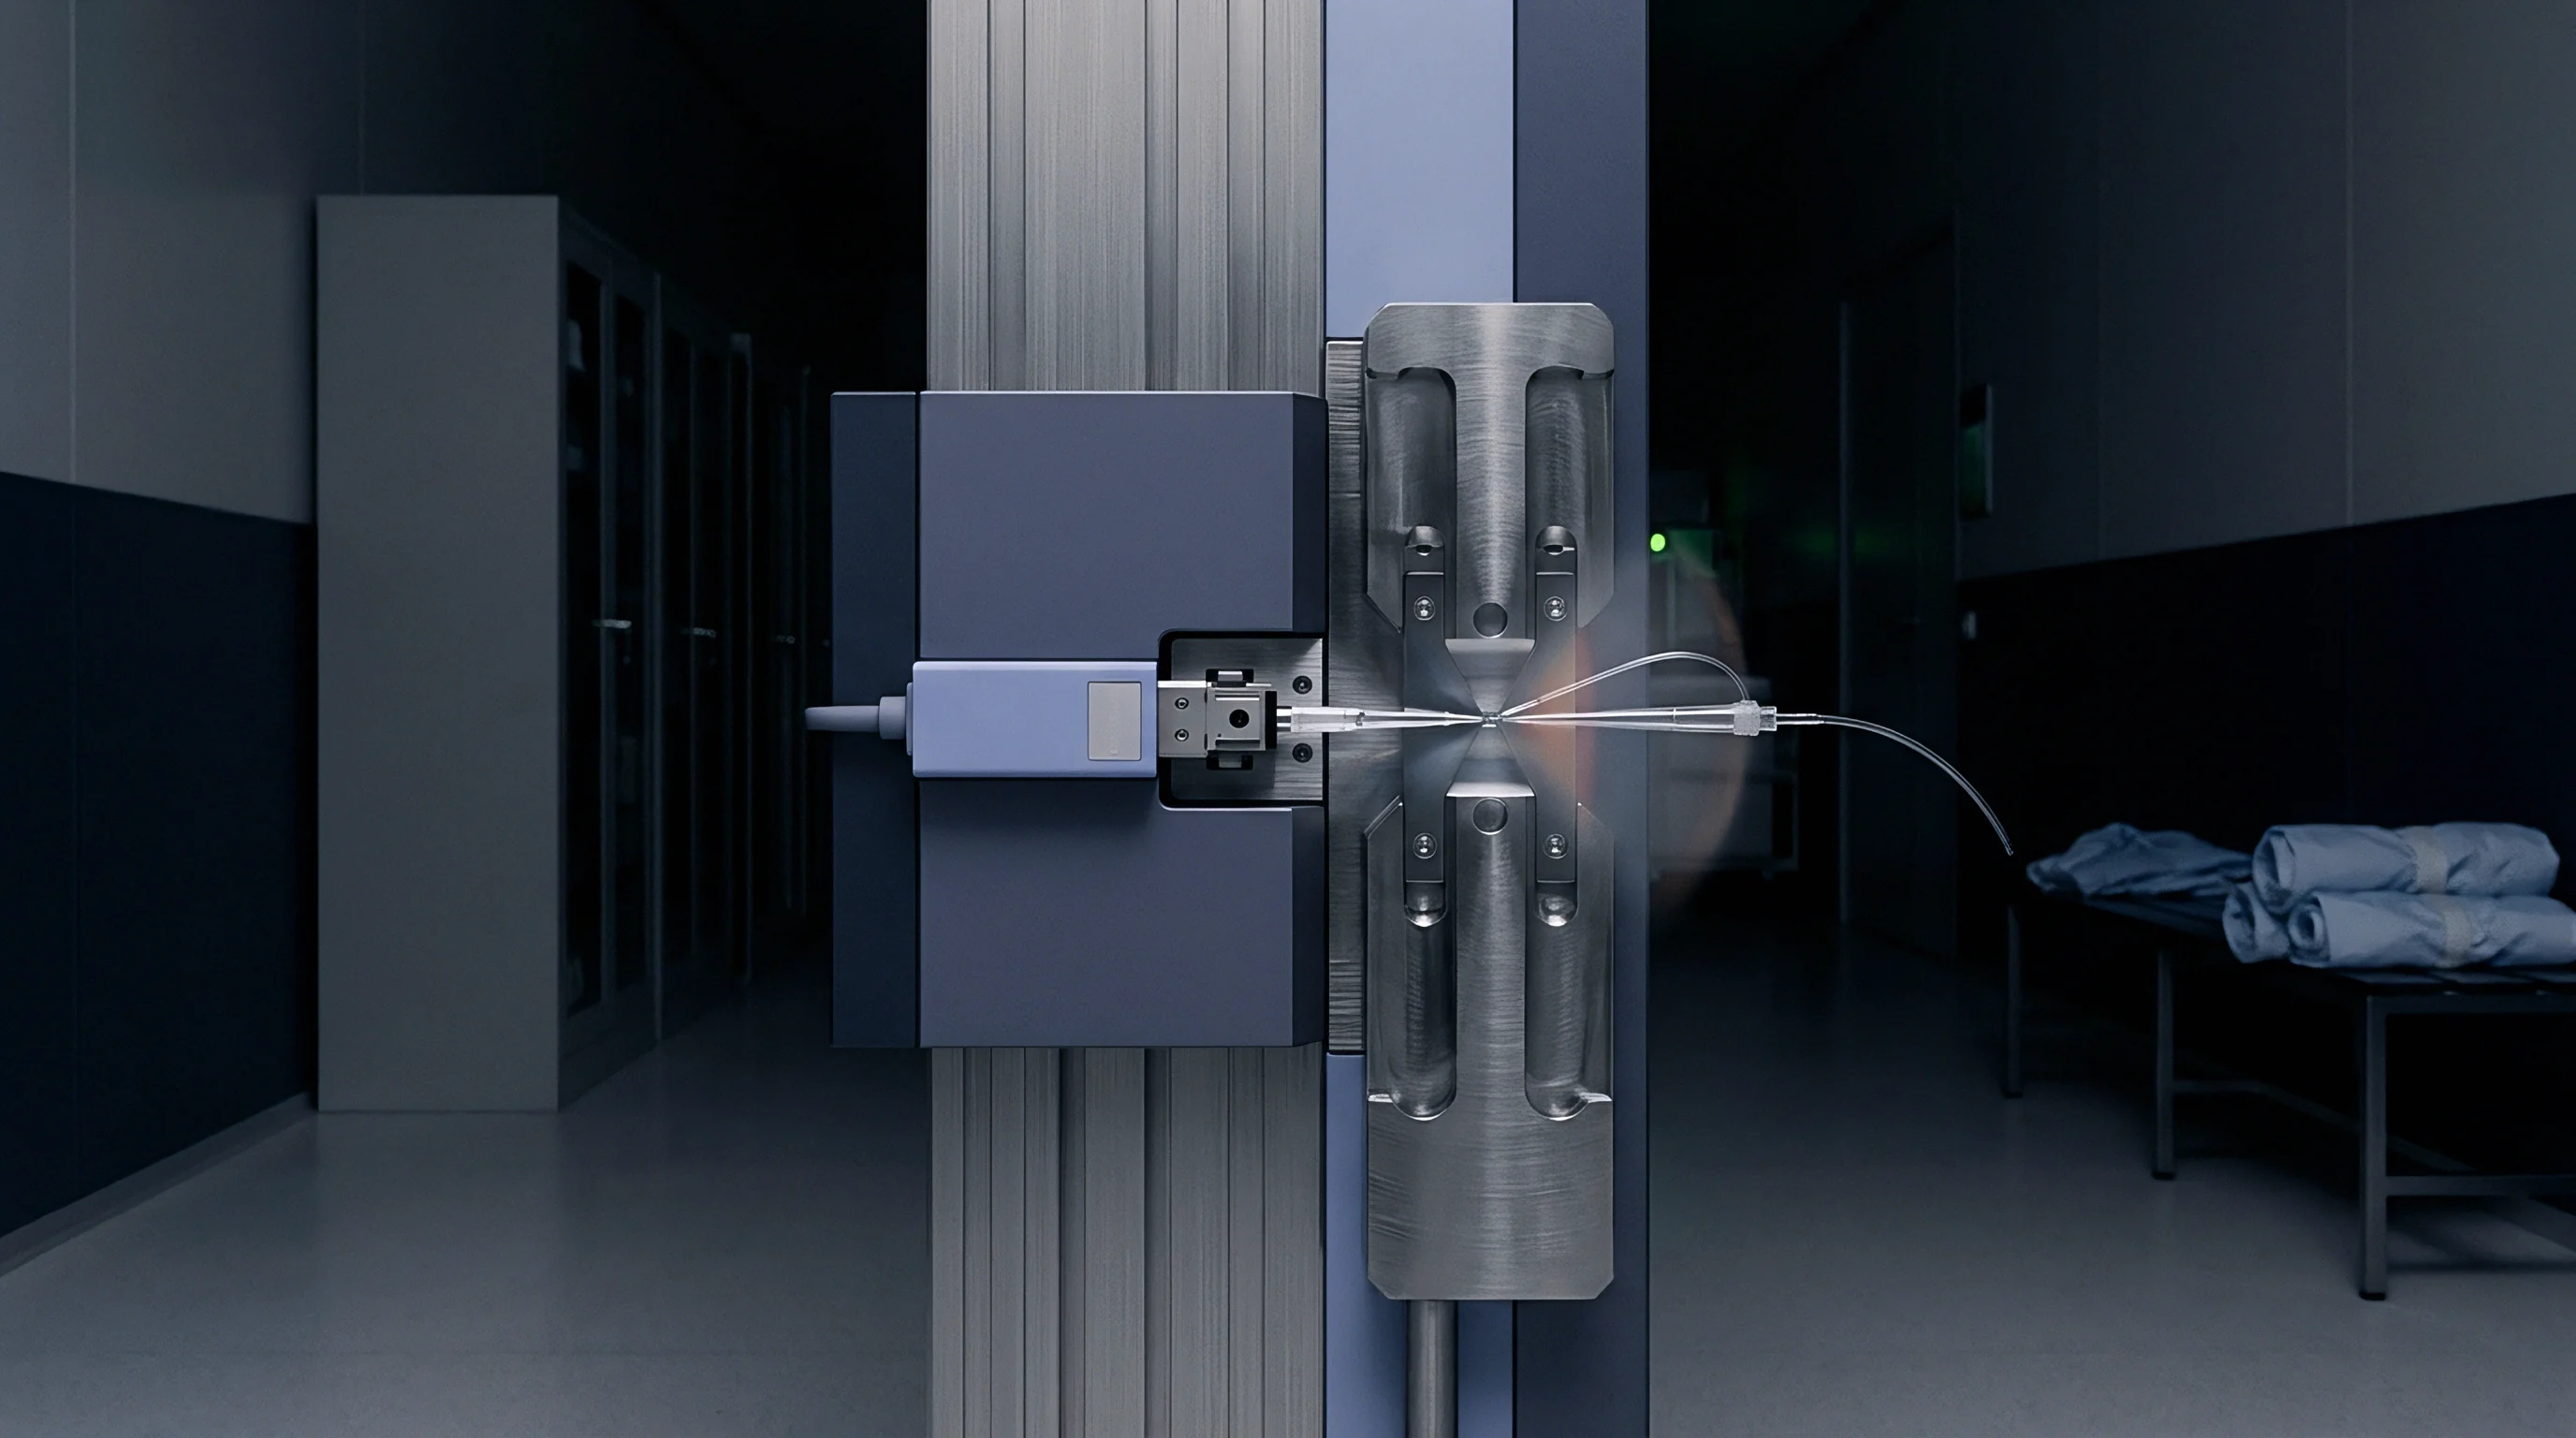
Field Calibration Intervals and Long-Term Operating Costs
Recalibration schedules for pressure and strain sensors deployed in gas turbines or downhole oil wells dictate total ownership expense. If a piezoresistive sensor exhibits a micro-strain relaxation rate of fifteen micro-strains per thousand hours at three hundred degrees Celsius, its zero-offset drift will exceed allowable system tolerances within six months of deployment. Field recalibration in downhole applications demands pulling the entire drill string, incurring downtime costs that exceed the original purchase price of the sensor by several orders of magnitude.
Field failures destroy customer confidence. Implementing rigorous lot acceptance testing using accelerated thermal soak profiles increases initial manufacturing unit costs, yet dramatically reduces lifetime field warranty exposure. Quantifying micro-strain relaxation uncertainty allows sensor vendors to provide field-proven drift guarantees, enabling end-users to extend recalibration intervals from six months to two years ~ a compelling commercial advantage in high-reliability markets.
Warranty Reserve Calculations and Lot Acceptance Penalties
Financial provisioning for field returns depends on statistical drift predictions derived from lot screening measurements. Actuarial calculation of warranty reserves incorporates the upper tolerance limit of micro-strain relaxation established during ANSI Z1.9 lot sampling. When lot screening reveals a wide statistical distribution of relaxation rates, the manufacturer must increase warranty reserve allocations per unit shipped to cover anticipated field replacement costs.
Purchase contracts between Tier 1 automotive or aerospace buyers and MEMS foundries increasingly incorporate explicit drift penalty clauses linked directly to drift calculations. These contracts mandate that if field returns due to strain-relaxation-induced zero drift exceed zero point one percent of delivered volume, the sensor foundry forfeits batch retainage funds and pays financial indemnities covering system teardown expenses. Incorporating GUM-compliant uncertainty budgets into lot acceptance certificates provides foundries with the technical evidence necessary to defend product compliance and resolve contractual supplier disputes.
What residual strain relaxation uncertainty remains acceptable when deploying silicon carbide sensors into five-hundred-degree-Celsius hypersonic propulsion control systems where recalibration is physically impossible?