GUM Uncertainty Budgeting for High Temperature MEMS Sensor Lot Acceptance
Lot acceptance for high-temperature MEMS sensors requires GUM uncertainty budgets and guardbanding to mitigate consumer risk across severe thermal envelopes.
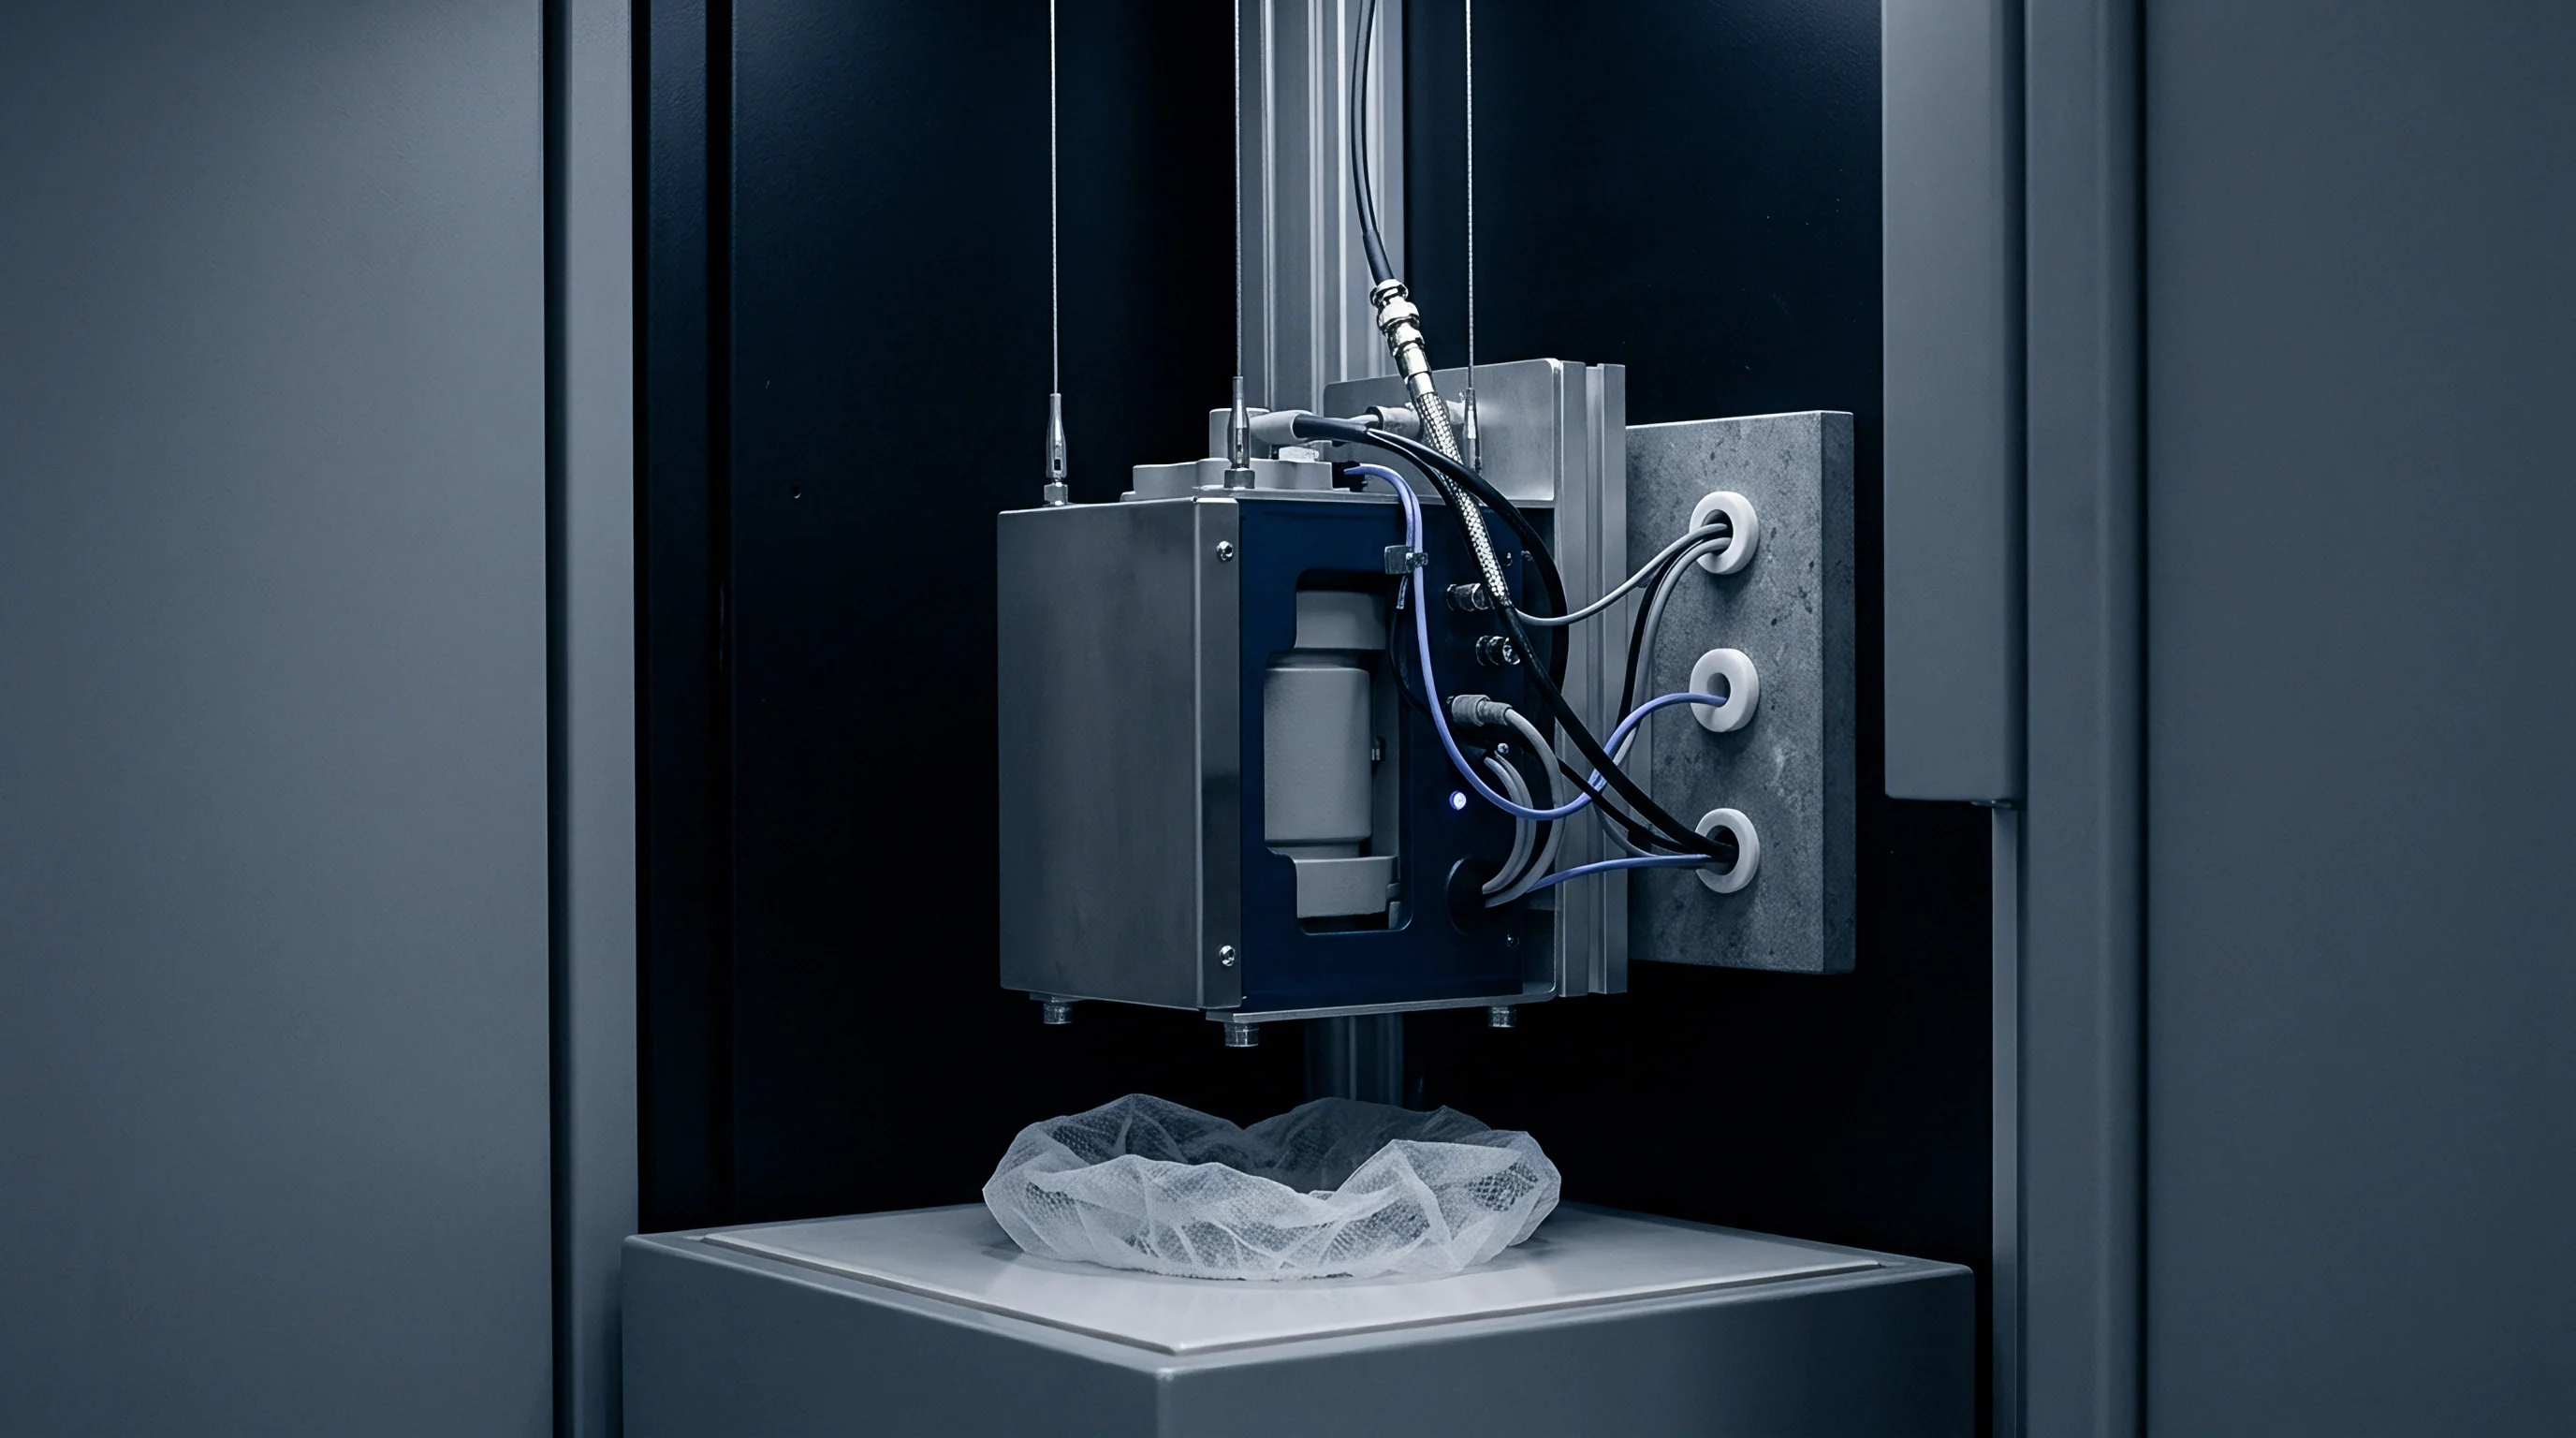
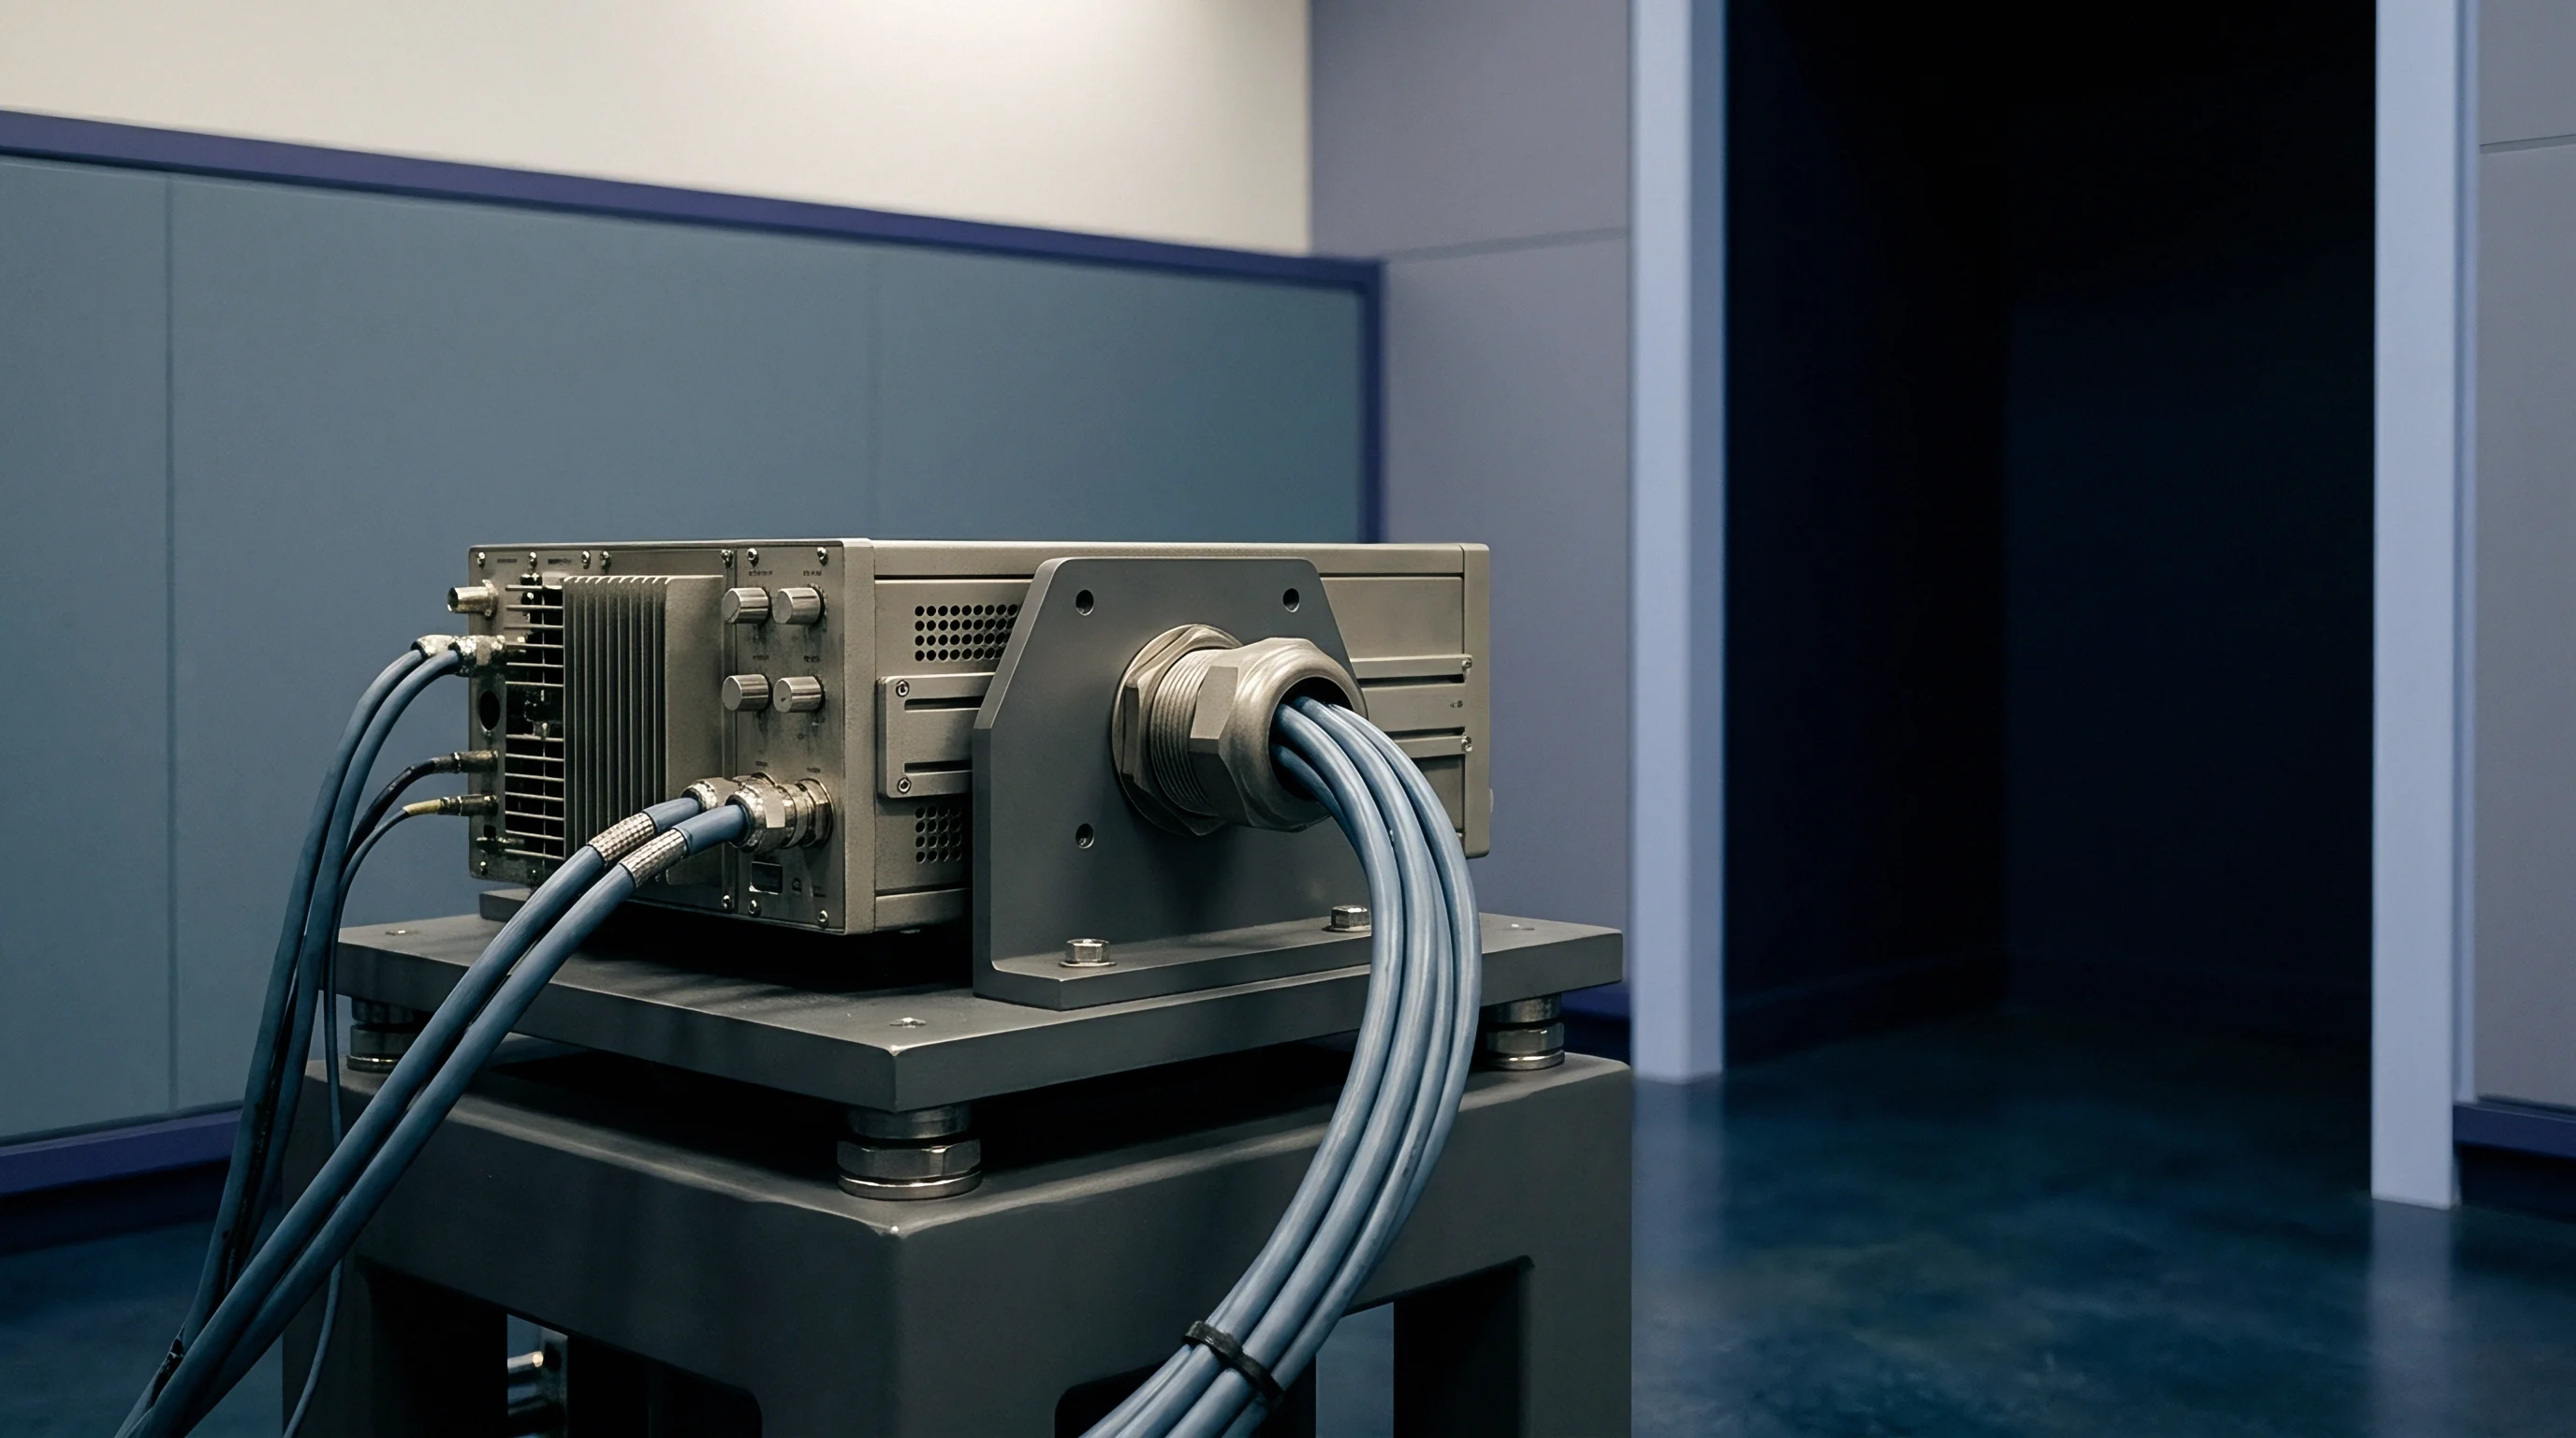
Furnace
Acceptance testing for piezoresistive and capacitive MEMS pressure and acceleration transducers operating beyond 175 degrees Celsius demands an accounting of thermomechanical degradation. Standard room-ambient lot acceptance protocols fail to detect package relaxation, wire bond intermetallic growth, and piezoresistor junction leakage that develop under sustained thermal soak. Protocols evaluating devices for downhole logging, gas turbine monitoring, or automotive exhaust manifolds test sensor sensitivity, offset voltage, and insulation resistance within a controlled thermal envelope.
The reference standard against which parts are measured must carry a Calibration and Measurement Capability (CMC) that accounts for temperature gradients across the soaking zone.
High-temperature silicon, silicon carbide, and silicon-on-insulator (SOI) MEMS dice exhibit non-linear response curves when thermal gradients alter die-attach compliance. Gold-silicon eutectic bonds and high-lead solders undergo microstructural coarsening above 200 degrees Celsius, shifting the baseline mechanical strain transmitted from the kovar or alumina header to the sensing diaphragm. When a lot acceptance station applies full-scale physical pressure across five temperature plateaus (25, 125, 200, 300, and 400 degrees Celsius), the measurement system itself introduces systematic biases through furnace wall radiation, cable thermoelectric effects, and reference transducer thermal lag.
The calibration furnace introduces a radial gradient of 0.42 degrees Celsius across a ten-device test carousel at 400 degrees Celsius steady state.
Quantifying the reference temperature requires calibrated Class A platinum resistance thermometers (Pt100 elements) conforming to IEC 60751 or Type S thermocouples embedded directly into the test manifold. Radiative heat transfer inside tube furnaces creates an emissivity mismatch between shiny gold-plated kovar headers and dull oxidized steel calibration fixtures. This mismatch generates an offset between the internal MEMS diaphragm temperature and the reading recorded by the reference thermometer.
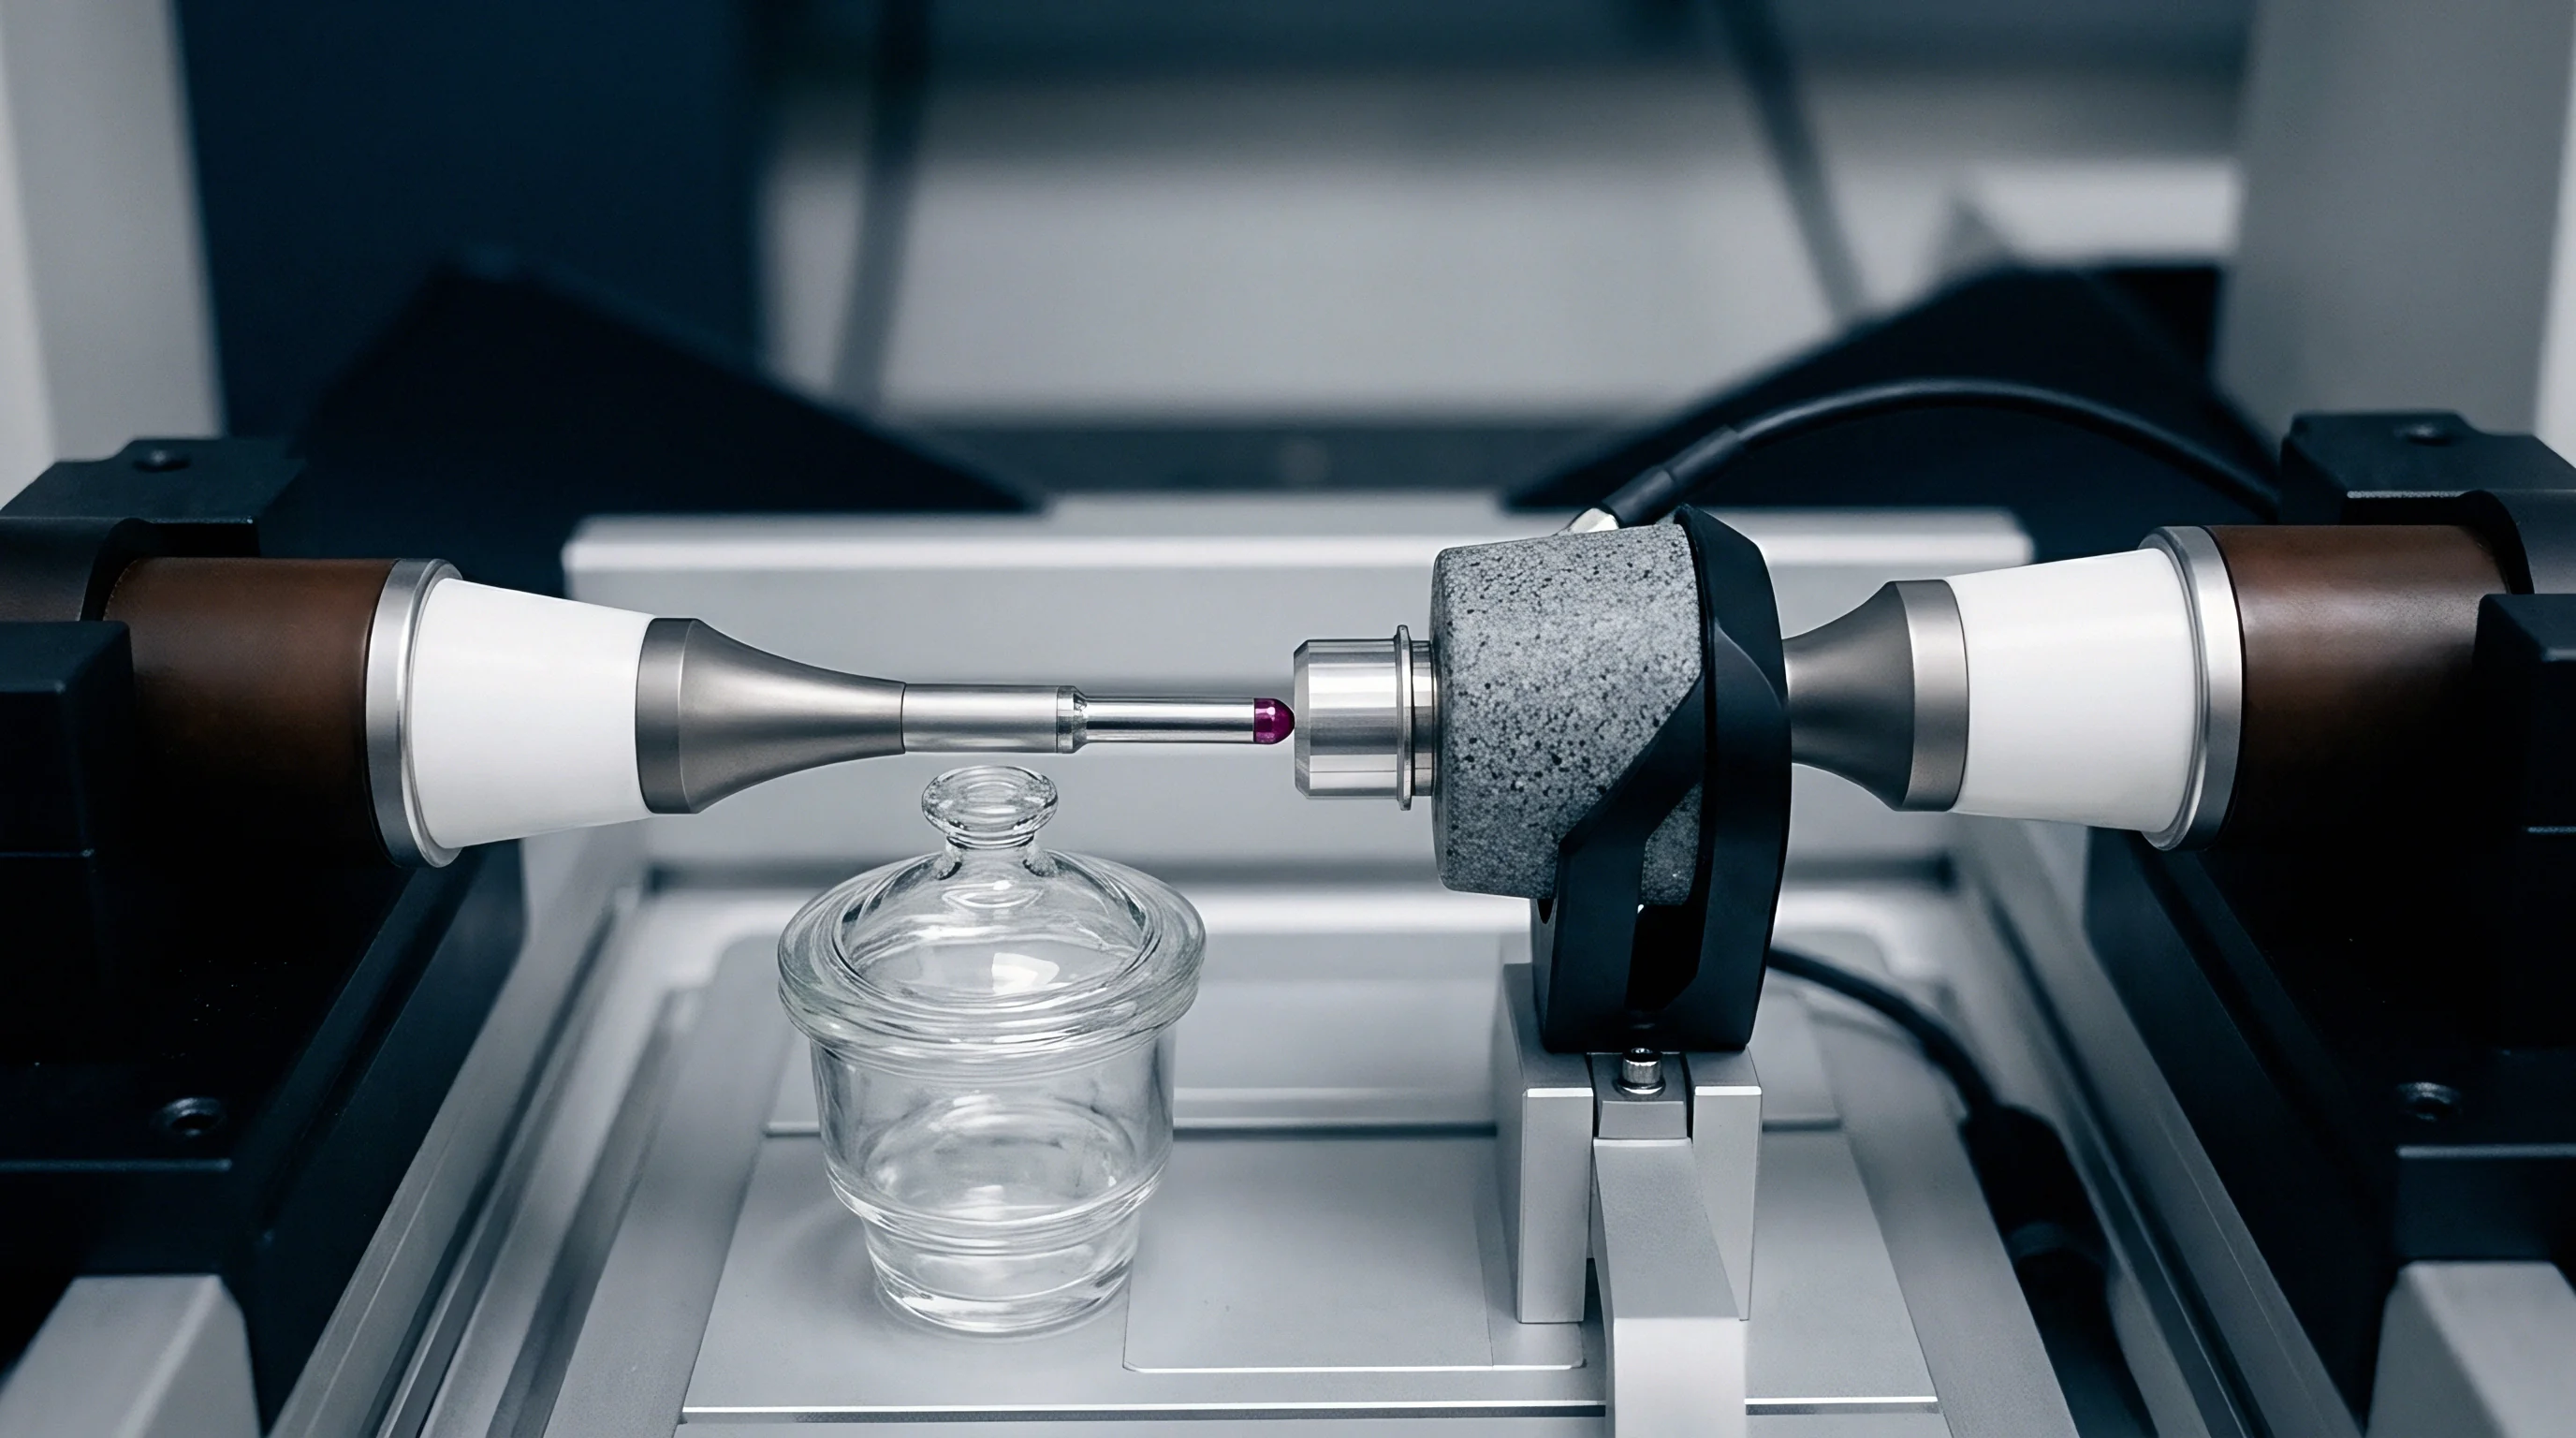
Thermal Gradients across Calibration Fixtures
Thermal equilibrium in multi-station lot acceptance manifolds requires dwell times exceeding thirty minutes per plateau. Rapid thermal cycling intended to shorten lot qualification cycles produces transient strain states that masquerade as permanent sensor offset shifts. Ceramic carrier blocks reduce conductive thermal losses toward the furnace access ports.
Signal leads exiting the hot zone generate parasitic Seebeck voltages at dissimilar metal junctions, adding microvolts of uncompensated DC offset into differential bridge outputs.
Mineral-insulated metal-sheathed cabling isolates output signals from high-temperature electrical noise. Copper-to-constantan or kovar-to-copper junctions located inside the transition zone between the furnace interior and external data acquisition systems generate thermoelectric electromotive forces exceeding forty microvolts per degree of gradient. Isothermal terminal blocks maintained at 50 degrees Celsius eliminate these spurious DC voltages before analog-to-digital conversion.
ISO/IEC 17025 Clause 7.6 mandates that testing laboratories evaluate all significant measurement uncertainty contributors, which obliges the supplier to record the physical temperature profile across the test fixture for every qualified wafer batch.

Variance
Constructing a Guide to the Expression of Uncertainty in Measurement (GUM) budget for MEMS lot acceptance separates Type A statistically evaluated random deviations from Type B externally sourced systematic bounds. The output estimate for sensor sensitivity incorporates reference pressure standard uncertainty, furnace thermal stability, digital voltmeter resolution, bridge excitation voltage instability, and polynomial curve-fitting residuals. Piezoresistive bridge sensitivity is expressed as millivolts output per volt excitation per unit pressure.
Each component within the mathematical model receives a standard uncertainty derived from its probability distribution. Reference deadweight testers contribute rectangular or normal distributions defined on accredited calibration certificates. Data acquisition quantization and temperature chamber digital readouts contribute rectangular distributions evaluated by dividing the resolution interval by the square root of three.
| Uncertainty Source | Probability Distribution | Divisor | Sensitivity Coefficient | Standard Uncertainty (u_i) |
|---|---|---|---|---|
| Reference Pressure Standard | Normal (k=2) | 2.000 | 1.000 mV/V/bar | 0.0150 % FS |
| Chamber Temperature Uniformity | Rectangular | 1.732 | 0.045 mV/V/K | 0.0260 % FS |
| Bridge Excitation Voltage Drift | Rectangular | 1.732 | 0.200 mV/V/V | 0.0087 % FS |
| DVM Voltage Measurement Linearity | Normal (k=2) | 2.000 | 1.000 mV/mV | 0.0045 % FS |
| Die Attach Thermomechanical Creep | Rectangular | 1.732 | 0.080 mV/V/h | 0.0346 % FS |
| Type A Repeatability (10 cycles) | Normal (1-sigma) | 1.000 | 1.000 mV/V/bar | 0.0210 % FS |
| Combined standard uncertainty u_c equals 0.0512 % FS; expanded uncertainty U (k=2) equals 0.1024 % FS under coverage probability 95.45 percent. | ||||
The combined standard uncertainty pools each individual variance through the law of propagation of uncertainty. Sensitivity coefficients, calculated as partial derivatives of the functional model with respect to each input parameter, scale physical deviations into output voltage equivalents. High temperatures amplify cross-sensitivity terms: the piezoresistive coefficient changes with temperature, coupling pressure-measurement uncertainty directly to thermal stability uncertainty.

Mathematical Formulation of Combined Uncertainty
The mathematical model describes sensor output voltage as a function of applied pressure, die temperature, bridge supply current, and packaging strain. Correlated input quantities arise when the same environmental chamber controls both the reference sensor and the device under test. Neglecting covariance between temperature errors and piezoresistive gauge factors underestimates the combined standard uncertainty by fifteen to twenty-five percent.
Covariance terms are evaluated by simultaneous sampling of thermal sensors during pressure ramps. When correlations exist, the evaluation uses the full matrix formulation outlined in JCGM 100:2008. The effective degrees of freedom calculated via the Welch-Satterthwaite formula determine the appropriate coverage factor k for expanded uncertainty reporting.
Type A evaluations require repeated pressure cycles at stabilized temperatures. MEMS diaphragms exhibit micro-scale mechanical hysteresis driven by grain boundary sliding in polysilicon or dislocation movement in single-crystal silicon above 300 degrees Celsius. Ten ascending and descending pressure cycles generate the variance estimate for short-term repeatability.
Silicon piezoresistors doped with boron exhibit carrier exhaustion regimes at elevated temperatures. The temperature coefficient of resistance (TCR) and temperature coefficient of gauge factor (TCGF) drift as dopants migrate under sustained high-temperature reverse bias. Quantifying these effects converts uncharacterized physical drift into bounded Type B budget entries.


Guardband
Establishing lot acceptance rules without guardbanding introduces consumer risk, allowing out-of-specification sensors into high-reliability supply chains. ISO 14253-1 and JCGM 106:2012 define decision rules that reduce the customer tolerance by an offset proportional to the expanded measurement uncertainty. When an oil-exploration tool operator specifies a full-scale error band of 0.50 percent at 250 degrees Celsius, the test acceptance boundary must contract to accommodate the uncertainty of the furnace calibration bench.
Simple acceptance rules declare conformity when the observed value falls anywhere inside the upper and lower specification limits. Guardbanded acceptance contracts the boundary by a guardband factor w, ensuring that the probability of false acceptance remains below a designated threshold, typically two percent or 0.1 percent.

Which Guardband Multiplier Preserves High Temperature Consumer Risk?
Binary decision rules rely on the test uncertainty ratio (TUR), defined as the span of the tolerance divided by twice the expanded measurement uncertainty. At elevated temperatures, calibration uncertainty widens, dropping the TUR from typical values of 4:1 down to 1.5:1. Maintaining consumer risk below one percent under a 1.5:1 TUR requires an expanded guardband multiplier of 1.2 times the combined standard uncertainty.
Contracting acceptance limits by 1.64 times the combined standard uncertainty holds the joint customer risk below one device per thousand tested.
Specific risk calculations evaluate the probability that a single accepted unit violates specification limits. Global risk calculations evaluate the total proportion of non-conforming units within an accepted lot. The prior distribution of the manufactured lot, obtained from wafer-probe electrical test data, establishes the baseline process capability index (Cpk).
| Decision Rule Strategy | Upper Acceptance Limit Formula | Consumer Risk (P_C) | Producer Risk (P_P) | Yield Impact |
|---|---|---|---|---|
| Simple Acceptance (Zero Guardband) | USL | 4.85 % | 0.45 % | Baseline Yield |
| Strict Guardbanding (w = 1.0 U) | USL – U (95%) | 0.12 % | 8.60 % | -8.15 % |
| Root-Sum-Square Guardband | USL – sqrt(U^2 – u_ref^2) | 0.85 % | 3.40 % | -2.95 % |
| Economic Optimized Guardband | USL – 0.65 U | 1.00 % | 2.10 % | -1.65 % |
High producer risk increases false lot rejections, discarding compliant sensor lots and inflating production costs. Balancing producer and consumer risk involves setting acceptance limits based on the cost ratio between false acceptance field failures and false rejection scrap expenses. A sensor failure during a deep-well drilling run incurs rig downtime costs exceeding several hundred thousand dollars, justifying aggressive guardbands at the factory gate.
Ignoring measurement uncertainty during lot screening shifts thermal drift errors directly to field operations, producing early system shutdowns and commercial warranty claims that exceed the landed purchase price of the components.


Screening
Lot screening executes guardbanded criteria across sample populations drawn in accordance with ANSI/ASQ Z1.4 or ISO 2859-1 sampling standards. High-temperature MEMS devices require static or dynamic burn-in prior to acceptance sampling to eliminate infant mortality caused by die metallization voiding, silicon oxide pinhole breakdown, and ionic contamination drift. High-temperature operating life (HTOL) screens subject sample coupons to maximum operating temperature and electrical bias for 168 to 1000 hours.
Screening plans categorize failure mechanisms by physical activation energy using the Arrhenius model. Gold-aluminum wire bond interfaces develop Kirkendall voids with an activation energy of approximately 1.0 electron-volt, accelerating failure rates at 250 degrees Celsius by two orders of magnitude relative to room temperature operation. Packaging integrity testing complements electrical screening by verifying hermeticity under helium mass spectrometer leak detection conforming to MIL-STD-883 Method 1014.

When Is Static Burn in Sufficient for Silicon Piezoresistors?
Static burn-in applies DC bridge excitation at maximum rated temperature without pressure modulation. This screening exposes gate oxide breakdown and bulk leakage across p-n isolation junctions. Dynamic screening exercises the mechanical diaphragm with pulsed pressure cycles during thermal soak, exposing mechanical fatigue, micro-cracking in protective passivation layers, and hysteresis growth in SOI active layers.
- Thermal Hysteresis Screening quantifies output offset divergence between upward and downward thermal ramps from 25 degrees Celsius to 350 degrees Celsius.
- High Temperature Reverse Bias detects mobile ionic migration across silicon dioxide layers by monitoring leakage currents under maximum supply voltages.
- Die Attach Resonant Frequency Check uses acoustic micro-imaging to identify delamination zones within the gold-germanium or glass-frit bond lines.
- Bridge Resistance Stability Verification tracks ohmic baseline shift across 100 thermal hours to confirm the stability of platinum thin-film metallization.
Sample sizes for lot acceptance depend on the Limiting Quality (LQ) level agreed between buyer and vendor. An Acceptance Quality Limit (AQL) of 0.40 percent requires a tight inspection plan where a single failure in a sample of 125 units results in rejection of the entire manufacturing batch. Rejected lots undergo root-cause failure analysis to isolate wafer-level processing defects from packaging assembly flaws.
| Screening Stage | Test Parameters | Sample Size / Standard | Rejection Threshold |
|---|---|---|---|
| Pre-Seal Electrical Verification | Bridge resistance, offset, leakage at 25 C | 100 % Wafer Probe | Offset > 2.0 mV/V |
| High-Temperature Stabilization Bake | 350 C for 48 hours, unpowered | 100 % Lot Assembly | Visual package defect |
| Thermal Shock Screening | -40 C to +300 C, 50 cycles, liquid-liquid | Sample per MIL-STD-883 | Zero hermeticity failures |
| Final Guardbanded Acceptance Test | Full pressure sweep at 25 C, 150 C, 300 C | ANSI/ASQ Z1.4 Level II | Offset drift > 0.15 % FS |
Factory-level calibration algorithms can compensate for thermal shifts, holding uncompensated offset wander within published mathematical model envelopes regardless of test soak duration.


Disposition
Batch disposition represents the final commercial crossroad where metrological evidence dictates shipment acceptance, rework, or complete scrappage. Incoming inspection teams must verify the traceable measurement hierarchy documented in the supplier’s Certificate of Conformance. A certificate stating sensor accuracy without an attached expanded uncertainty value and stated coverage factor lacks legal and metrological validity under international trade norms.
Lot disposition dossiers require full traceability to national metrology institutes such as NIST, PTB, or NPL. The uncertainty budget must account for calibration equipment drift between annual calibration cycles. When an incoming lot demonstrates high baseline offset variability during receiving verification, the buyer exercises contractual rights to require third-party accredited laboratory audits.
Lot disposition stands on evidence, which requires every recorded reading to trace back through unbroken calibrations to physical standards.
Contractual agreements specify lot re-testing provisions when sample lots fail guardbanded acceptance by marginal boundaries. Retesting protocols mandate doubling the original sample size without permitting a single additional failure across the extended coupon group. If the secondary batch confirms the elevated drift rate, the entire wafer production run is quarantined.

Verification Checklist for Incoming Acceptance Dossiers
Procurement specifications govern the minimum documentation required before financial release of high-temperature MEMS sensor shipments.
- Accredited Calibration Certificate containing the ISO/IEC 17025 logo, laboratory CMC scope numbers, and specific temperature limits for each calibration run.
- Expanded Uncertainty Statement explicitly listing coverage factor k=2, coverage interval, and complete Type A and Type B component breakdowns.
- Thermal Run Record documenting soaking dwell times, temperature gradients, and thermocouple positions inside the lot screening furnace.
- Hermeticity Test Log detailing gross and fine leak rates measured under helium bomb conditions per MIL-STD-883 specifications.
Costs associated with unverified high-temperature MEMS components escalate through long-term drift. A sensor deployed in an aircraft turbine monitoring system cannot undergo field re-calibration without full engine teardown. Packaging degradation, silicon piezoresistor oxidation, and metal migration continue throughout the sensor operating life, demanding that initial lot acceptance boundaries account for projected three-year drift envelopes.
The metrological community continues to evaluate how silicon-carbide and gallium-nitride MEMS structures alter long-term drift mechanisms when operating continuously above 500 degrees Celsius in corrosive combustion environments.