Coupled Hygrothermomechanical Finite Element Reflow Stress Modeling
Coupled hygrothermomechanical finite element reflow modeling resolves moisture diffusion, steam pressure, and thermal expansion to prevent package delamination.
Field
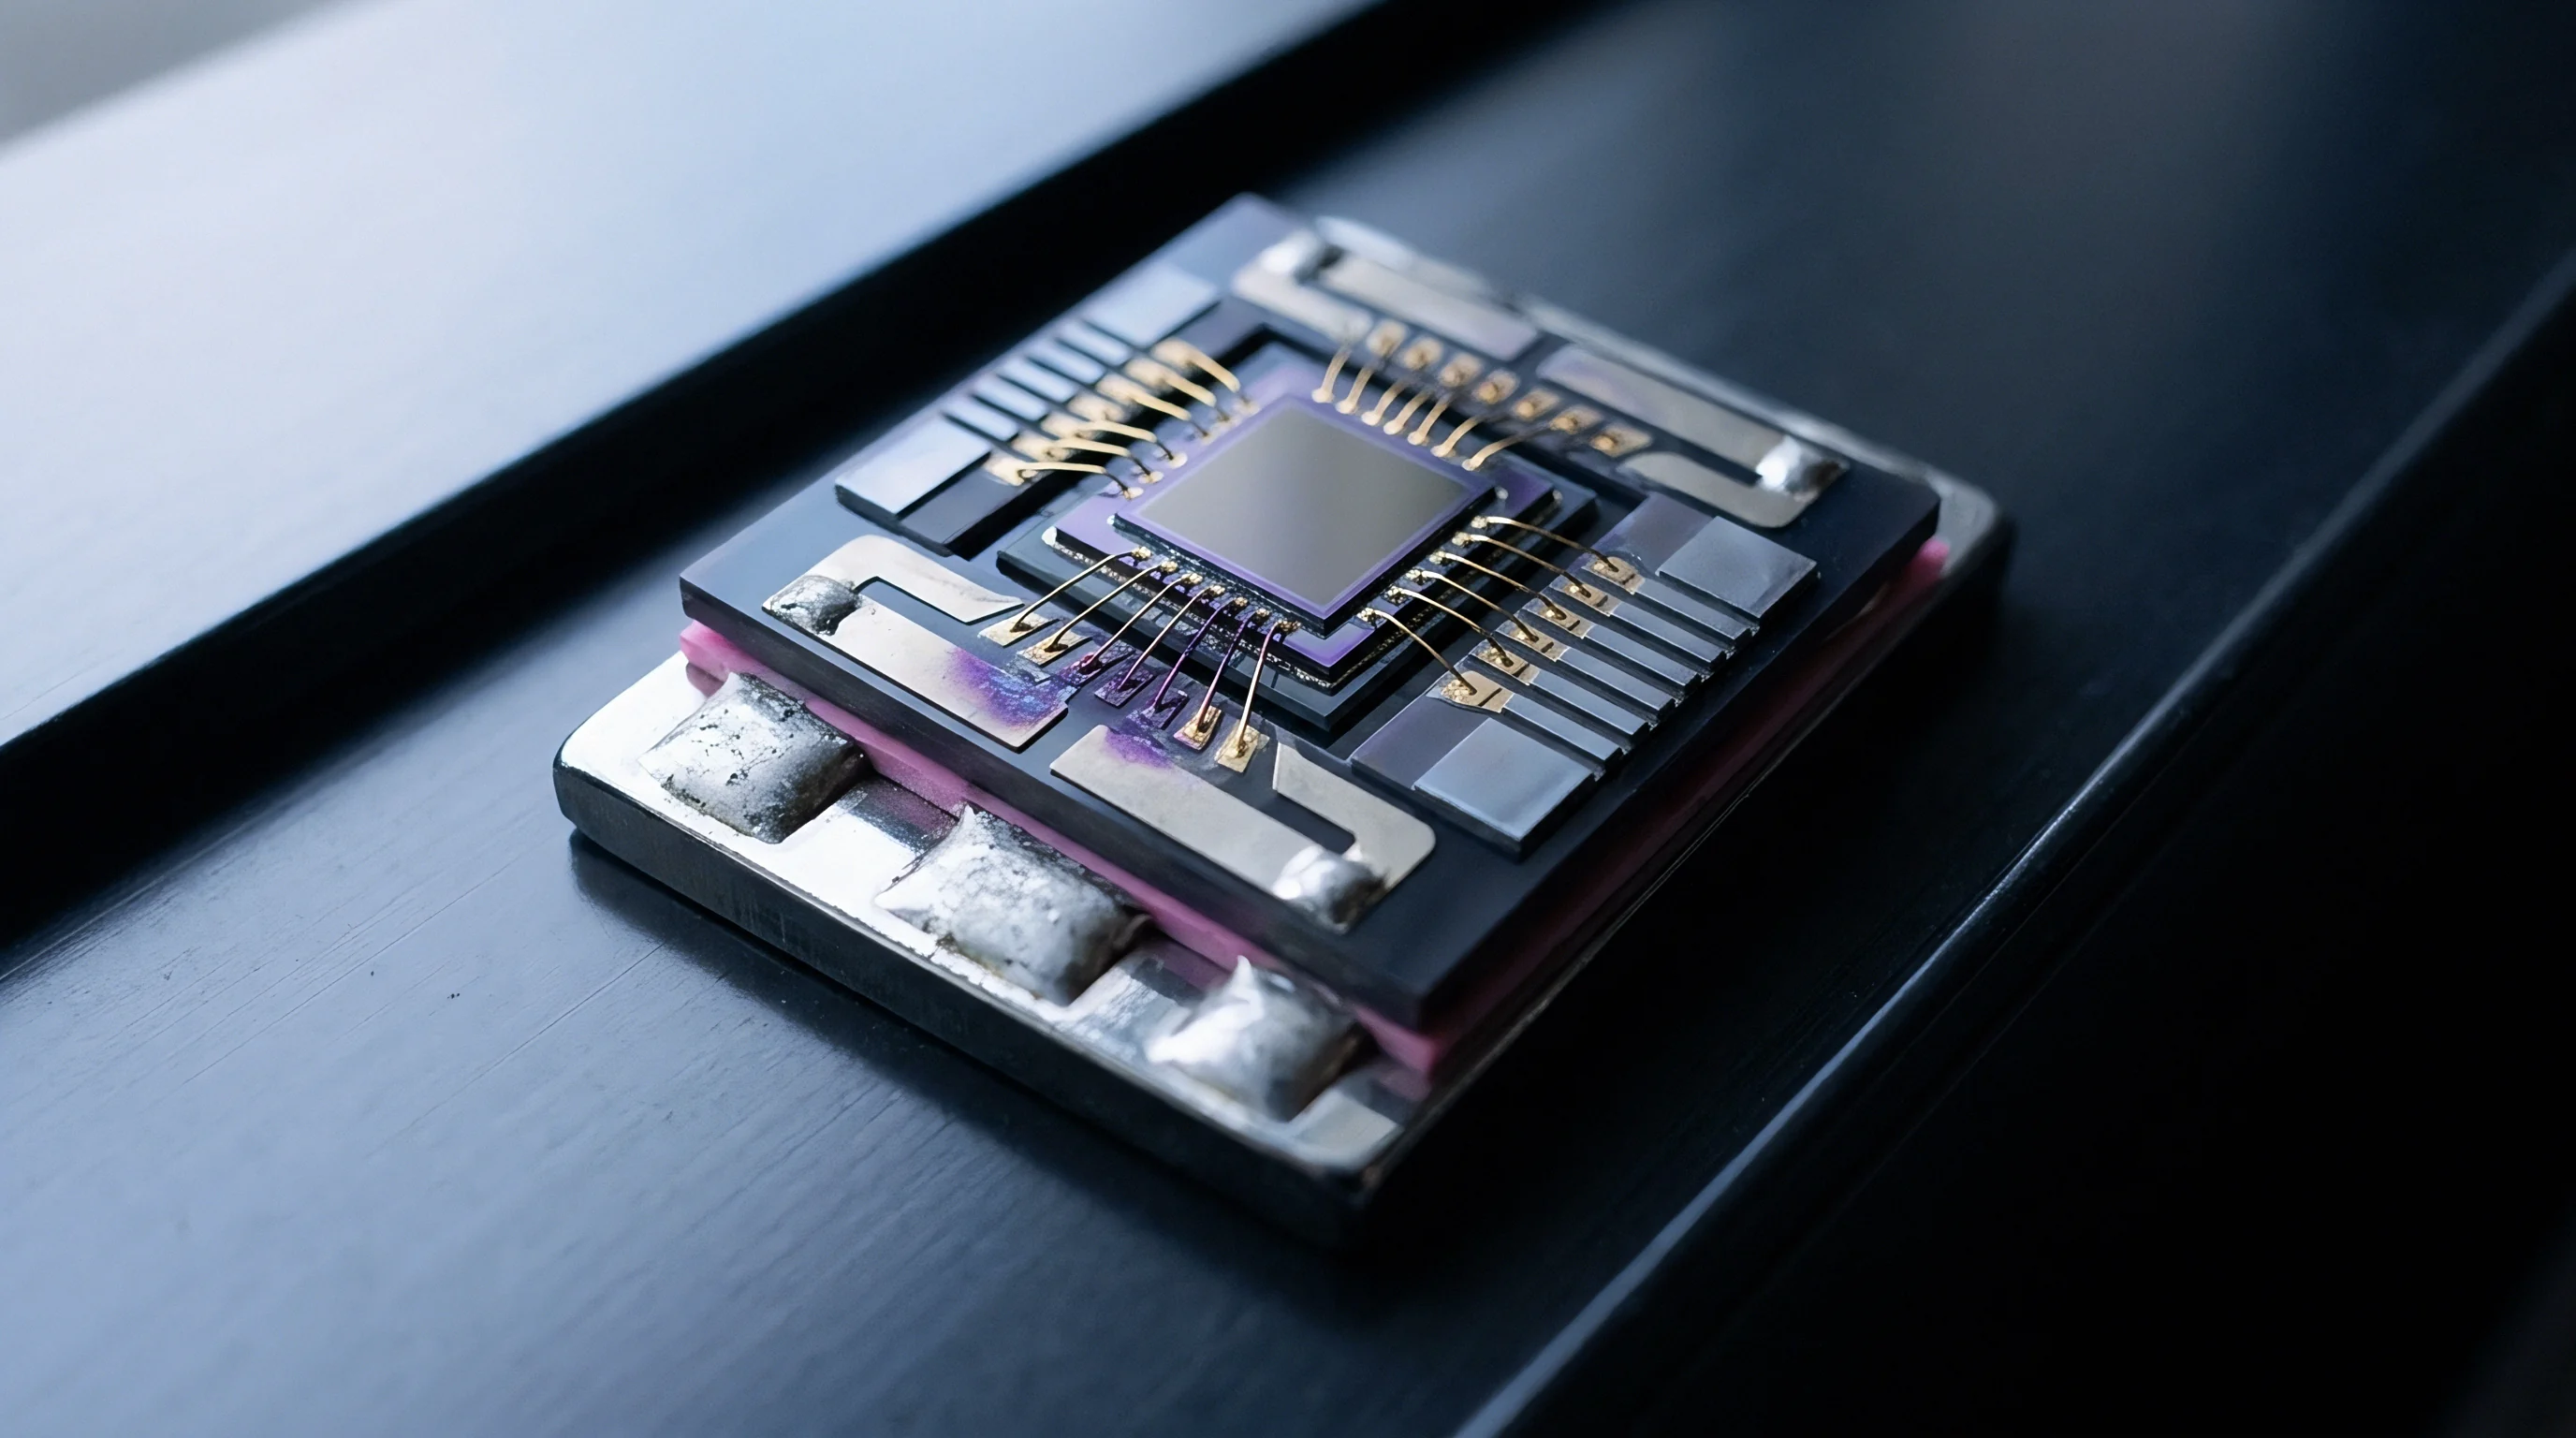
Solder reflow convection profiles peak at 260 °C, driving thermal expansion differentials across copper leadframes, silicon dies, and epoxy molding compounds while trapped ambient moisture vaporizes inside internal package micropores. The physical expansion of absorbed moisture during rapid heating generates localized internal steam pressures up to 4.7 MPa. Combined with thermal mismatch stresses exceeding 120 MPa along die edges, this vapor load initiates catastrophic package rupture.
Preventing these failures requires numerical simulations that track three distinct physical domains simultaneously: transient heat conduction, moisture diffusion, and stress generation.
Thermal gradients develop through the package bulk within 40 seconds of entering the peak reflow zone. The governing equation for heat transfer balances transient thermal storage against conductive flux:
ρ Cp (∂T/∂t) = ∇ · (k ∇T) + Q
Here, ρ represents material density, Cp denotes specific heat capacity, k is thermal conductivity, and Q defines internal heat generation. Because mold compounds and organic substrates exhibit low thermal conductivities between 0.6 and 1.2 W/(m·K), significant temperature gradients appear across the package thickness during standard reflow ramps of 2 °C/s to 3 °C/s.
Sorption Coupled Governing Relations
Fickian mass transport equations describe water molecule movement through polymer networks. Local moisture concentration C varies with time and spatial coordinates according to the second law of diffusion:
∂C/∂t = ∇ · (D ∇C)
Diffusivity D depends directly on absolute temperature T through an Arrhenius relationship:
D(T) = D0 exp(-Ed / (R T))
In this formulation, D0 represents the diffusion pre-factor, Ed is the activation energy for diffusion, and R denotes the universal gas constant. Saturated moisture concentration Csat exhibits a similar exponential temperature dependence governed by sorption activation energy. As reflow temperatures surpass 200 °C, moisture desorption outpaces diffusion rates observed during standard room-temperature floor storage.
The moisture loss rate accelerates sharply.
Lead-free peak reflow at 260 °C generates internal steam pressures exceeding 4.5 MPa inside saturated epoxy micropores.
Finite element discretizations encounter severe numerical instabilities at bimaterial interfaces where moisture solubility jumps discontinuously between adjacent layers. A direct solution applies normalized moisture wetness, defined as w = C / Csat. Because chemical potential remains continuous across material boundaries at thermodynamic equilibrium, wetness remains continuous across interfaces between epoxy molding compound, die attach adhesive, and solder mask.
The modified diffusion relation scales with wetness:
∂w/∂t = D ∇2w + ∇D · ∇w
This formulation eliminates artificial concentration discontinuities at silicon-epoxy boundaries. It allows standard continuous-Galerkin finite element formulations to solve the mass transfer field without specialized interface jump terms.
Vapor Pressure within Encapsulant Voids
Internal moisture converts into gas within microscopic cavities, cracks, and delamination gaps. Saturated vapor pressure inside these cavities follows the Clausius-Clapeyron relation. Between 100 °C and 260 °C, steam tables approximate this saturation pressure curve accurately:
Psat(T) = P0 exp((ΔHvap / R) (1/T0 – 1/T))
Below the critical moisture limit, vapor behaves as an ideal gas inside closed voids. Partial pressure Pv scales with the quantity of desorbed moisture mass mv and cavity volume V:
Pv = (mv R T) / (Mw V)
Mw denotes the molecular weight of water. When local moisture concentration provides excess vapor mass, Pv reaches the saturated vapor pressure ceiling Psat(T). At the lead-free reflow peak of 260 °C, saturated steam pressure reaches 4.69 MPa.
True saturated vapor pressure inside sub-micron interfacial micro-voids at 260 °C rests on equilibrium steam tables. The engineering desk cannot verify whether non-equilibrium desorption kinetics depress local vapor density before mechanical venting occurs; buyers enforce dry-pack controls rather than relying on unvented void pressure margins.
Total mechanical strain εtotal combines elastic, plastic, creep, thermal, and hygroscopic expansion components:
εtotal = εel + εpl + εcr + β (C – C0) + α (T – T0)
The coefficient of chemical hygroscopic swelling β quantifies mechanical expansion per unit of absorbed moisture concentration. In typical commercial mold compounds, β spans 0.15 to 0.35 mm³/(mg·mm). Total stress σ couples to strain through the stiffness tensor Cijkl:
σij = Cijkl (εkl – αkl ΔT – βkl ΔC)
Vapor pressure inside internal package cavities acts as a distributed mechanical surface traction normal to void boundaries. This pressure superimposes directly onto the thermal and hygroscopic stress tensor fields, driving localized crack opening displacements along adhesive interfaces.

Viscoplasticity
Polymer matrix behavior changes dramatically as component temperatures pass through the glass transition zone. Below the glass transition temperature Tg, epoxy molding compounds maintain an elastic modulus between 20 GPa and 28 GPa. Above Tg, which typically ranges from 120 °C to 160 °C for standard green packaging compounds, polymer chains mobilize freely.
The rubbery modulus drops to 1.0 GPa or lower. This modulus loss reduces mechanical confinement around internal leadframe features. Simultaneously, the coefficient of thermal expansion increases threefold, transitioning from 8 ~ 12 ppm/°C below Tg to 30 ~ 45 ppm/°C above Tg.

Anand Parameters for Solder Interconnects
Tin-silver-copper interconnects exhibit pronounced rate-dependent viscoplastic deformation during thermal excursions. SAC305 and SAC405 alloys exceed half their absolute melting temperatures even at room temperature. At reflow temperatures reaching 260 °C, solder turns liquid, losing all shear resistance.
During the cooling ramp, solder solidifies near 217 °C. Rapid thermal contraction generates viscoplastic shear strains in the newly formed joints. The Anand constitutive model captures this behavior using an internal state variable s that represents deformation resistance:
dεp/dt = A exp(-Q / (R T)) 1/m
Evolution of the internal state variable s follows a dynamic hardening and recovery relationship:
ds/dt = { h0 |1 – s/s |a sign(1 – s/s ) } (dεp/dt)
The saturation resistance s depends on deformation rate:
s = ŝ n
Nine material parameters define the solder response: pre-exponential factor A, activation energy Q, stress multiplier ξ, strain rate sensitivity m, hardening constant h0, coefficient a, saturation resistance parameter ŝ, strain rate sensitivity for saturation n, and initial internal state value s0.
The following engineering data summarizes typical thermo-mechanical parameters across constitutive package elements used in hygrothermomechanical modeling routines:
| Material Layer | Modulus (GPa) at 25 °C | Modulus (GPa) at 260 °C | CTE Below Tg (ppm/°C) | CTE Above Tg (ppm/°C) | Tg (°C) | Sorption β (mm³/mg) |
|---|---|---|---|---|---|---|
| Silicon Die | 165.0 | 160.0 | 2.6 | 2.6 | N/A | 0.00 |
| Copper Leadframe (C7025) | 131.0 | 120.0 | 17.0 | 17.0 | N/A | 0.00 |
| Epoxy Mold Compound (EMC-A) | 24.5 | 1.2 | 9.5 | 36.0 | 135 | 0.28 |
| Epoxy Mold Compound (EMC-B) | 21.0 | 0.8 | 8.0 | 32.0 | 155 | 0.22 |
| Die Attach Paste (Silver Filled) | 8.5 | 0.3 | 28.0 | 85.0 | 95 | 0.35 |
| Die Attach Film (DAF) | 4.2 | 0.08 | 42.0 | 130.0 | 110 | 0.45 |
| SAC305 Solder (Anand Solidus) | 48.0 | Liquid | 21.5 | 21.5 | N/A | 0.00 |
| FR4 Organic Substrate (In-Plane) | 22.0 | 12.0 | 14.0 | 16.0 | 170 | 0.18 |

Epoxy Modulus Degradation across Glass Transition
Dynamic mechanical analysis measures storage modulus retention as a function of temperature and moisture preconditioning. Absorbed water acts as a chemical plasticizer within cross-linked epoxy matrices. Hydrogen bonding between water molecules and epoxy hydroxyl groups increases free volume within the polymer network.
This plasticization depresses Tg by 10 °C to 25 °C for every 1.0 weight percent of absorbed moisture.
Simulating reflow stress without accounting for moisture-induced Tg depression introduces gross errors. When Tg shifts downward from 145 °C to 125 °C due to moisture saturation, rubbery state thermal expansion initiates earlier during the reflow profile ramp. The package experiences elevated volumetric expansion over a wider thermal window.
Epoxy formulations undergo several key property shifts during reflow:
- Viscoelastic relaxation modulus drops by two orders of magnitude within forty degrees above the glass transition.
- Moisture diffusivity coefficients surge by an order of magnitude as free volume expands within the rubbery polymer matrix.
- Interfacial chemical adhesion weakens rapidly through combined thermal bond degradation and moisture displacement at metal surfaces.
- Bulk moisture desorption releases water into micro-cavities faster than vapor can vent through the dense external package perimeter.
Suppliers frequently state that moisture-induced shifts in glass transition temperatures balance out under rapid reflow ramps due to brief exposure times, but interfacial strain data shows complete plasticization occurring well before peak temperatures are reached.
Delamination
Interfacial peeling occurs when out-of-plane tensile stresses exceed the adhesive fracture resistance along package material interfaces. The weakest interface within plastic surface-mount packages sits between the copper die paddle and the die attach adhesive, closely followed by the boundary between the molding compound and the silicon die active surface. When moisture vapor pressure acts on an initial interfacial micro-defect, normal traction separates the bonded surfaces.
Thermal expansion mismatch between the metal leadframe and the encapsulant drives forward shear displacement.

Why Does Solder Solidus Trigger Delamination?
Solidification mechanics during cooling impose critical shear loads on bonded joints. Liquid solder maintains zero shear stiffness between 220 °C and 260 °C. The assembly rests in a zero-stress state at peak temperature only within the solder volume. Encapsulants and adhesives, however, accumulate thermal and vapor loads throughout the ramp.
As solder drops below its 217 °C solidus, rapid elastic stiffness recovery locks in the geometric distortion of the package.
The mechanism resembles steam ruptures in high-pressure industrial boiler tubes, where localized thin-wall yield accelerates rapidly once internal pressure outpaces external structural restraint. Steam venting cannot relieve internal pressure fast enough when heating rates exceed 2 °C/s.
The mixed-mode stress intensity factor K balances opening Mode I (tensile) and Mode II (in-plane shear) displacements along the crack front:
K = KI + i KII
Because adjacent materials exhibit elastic modulus mismatch, the phase angle of loading ψ shifts with distance r from the crack tip:
ψ = arctan(Im(K riε) / Re(K riε))
Here, ε represents the bimaterial oscillation parameter derived from Dundurs parameters α and β:
ε = (1 / 2π) ln((1 – β) / (1 + β))
Crack propagation occurs when the total energy release rate G exceeds the critical interfacial fracture toughness Gc(ψ), which varies strongly with the phase angle.
Interfacial fracture energy at copper leadframe boundaries drops by 40 percent following moisture preconditioning at 85 °C and 85 percent relative humidity.
Virtual crack closure technique (VCCT) formulations compute GI and GII directly from finite element nodal forces and displacements. For four-node plane strain elements with crack tip element length Δa, the energy release rates resolve into nodal components:
GI = (1 / (2 Δa)) Fy,i Δuy,i-1
GII = (1 / (2 Δa)) Fx,i Δux,i-1
Fx,i and Fy,i denote forces at the crack tip node, while Δux,i-1 and Δuy,i-1 represent relative displacements behind the crack tip. Interfacial steam pressure Pv acts directly on opened crack faces. This adds an external work term that increases GI independently of the thermal expansion mismatch.

Fracture Mechanics Energy Release Thresholds
Critical energy release rates drop steeply at reflow temperatures. Dry copper-epoxy interfaces exhibit Gc values near 35 J/m² at room temperature. At 260 °C, thermal degradation of adhesive bonds reduces dry toughness to approximately 12 ~ 18 J/m².
Saturated moisture absorption further lowers Gc through interfacial hydrolysis.
Critical strain energy release rate Gc of 24.5 J/m² at the copper-die attach boundary measured at 260 °C rests on three-point end-notched flexure testing under JEDEC dry-bake conditions at 50 mm/min crosshead displacement. This toughness shifts downward by 40 percent under 85 °C / 85% RH preconditioning. Moisture concentrations displacing secondary van der Waals bonds along metal oxide surfaces account for this loss.
| Interface Boundary | Dry Toughness G_c (J/m²) | Moisture Saturated G_c (J/m²) | Phase Angle ψ (deg) | Critical Separation δ_n (μm) | Maximum Traction σ_max (MPa) |
|---|---|---|---|---|---|
| Silicon Die to EMC | 14.2 | 6.8 | 38 | 0.45 | 28.0 |
| Die Attach to Copper Paddle | 24.5 | 14.7 | -25 | 0.80 | 32.0 |
| Die Attach to Silicon Backside | 18.0 | 9.2 | 12 | 0.60 | 24.0 |
| EMC to Copper Leadframe (Bare) | 12.5 | 4.2 | 45 | 0.35 | 18.0 |
| EMC to Roughened Copper Paddle | 32.0 | 19.5 | 42 | 1.10 | 45.0 |
| Solder Mask to EMC | 16.8 | 8.4 | 18 | 0.50 | 22.0 |
Interfacial delamination progresses through specific observable physical stages:
- Micro-void nucleation develops at chemical contamination sites or smooth metal topography zones along the leadframe paddle.
- Vapor phase pressurization forces initial separation as trapped moisture turns into steam at 100 °C to 180 °C.
- Unstable crack extension occurs during the peak reflow plateau as combined energy release rates exceed degraded interfacial toughness.
- Bulk encapsulant rupture develops when expanding steam domes deform the package floor beyond polymer flexural limits.
Omitting coupled moisture vapor pressure from reflow modeling causes severe underestimation of crack driving forces, resulting in unexpected package cracking, sheared wirebonds, and field line failures during first-pass surface mount assembly.
Offset
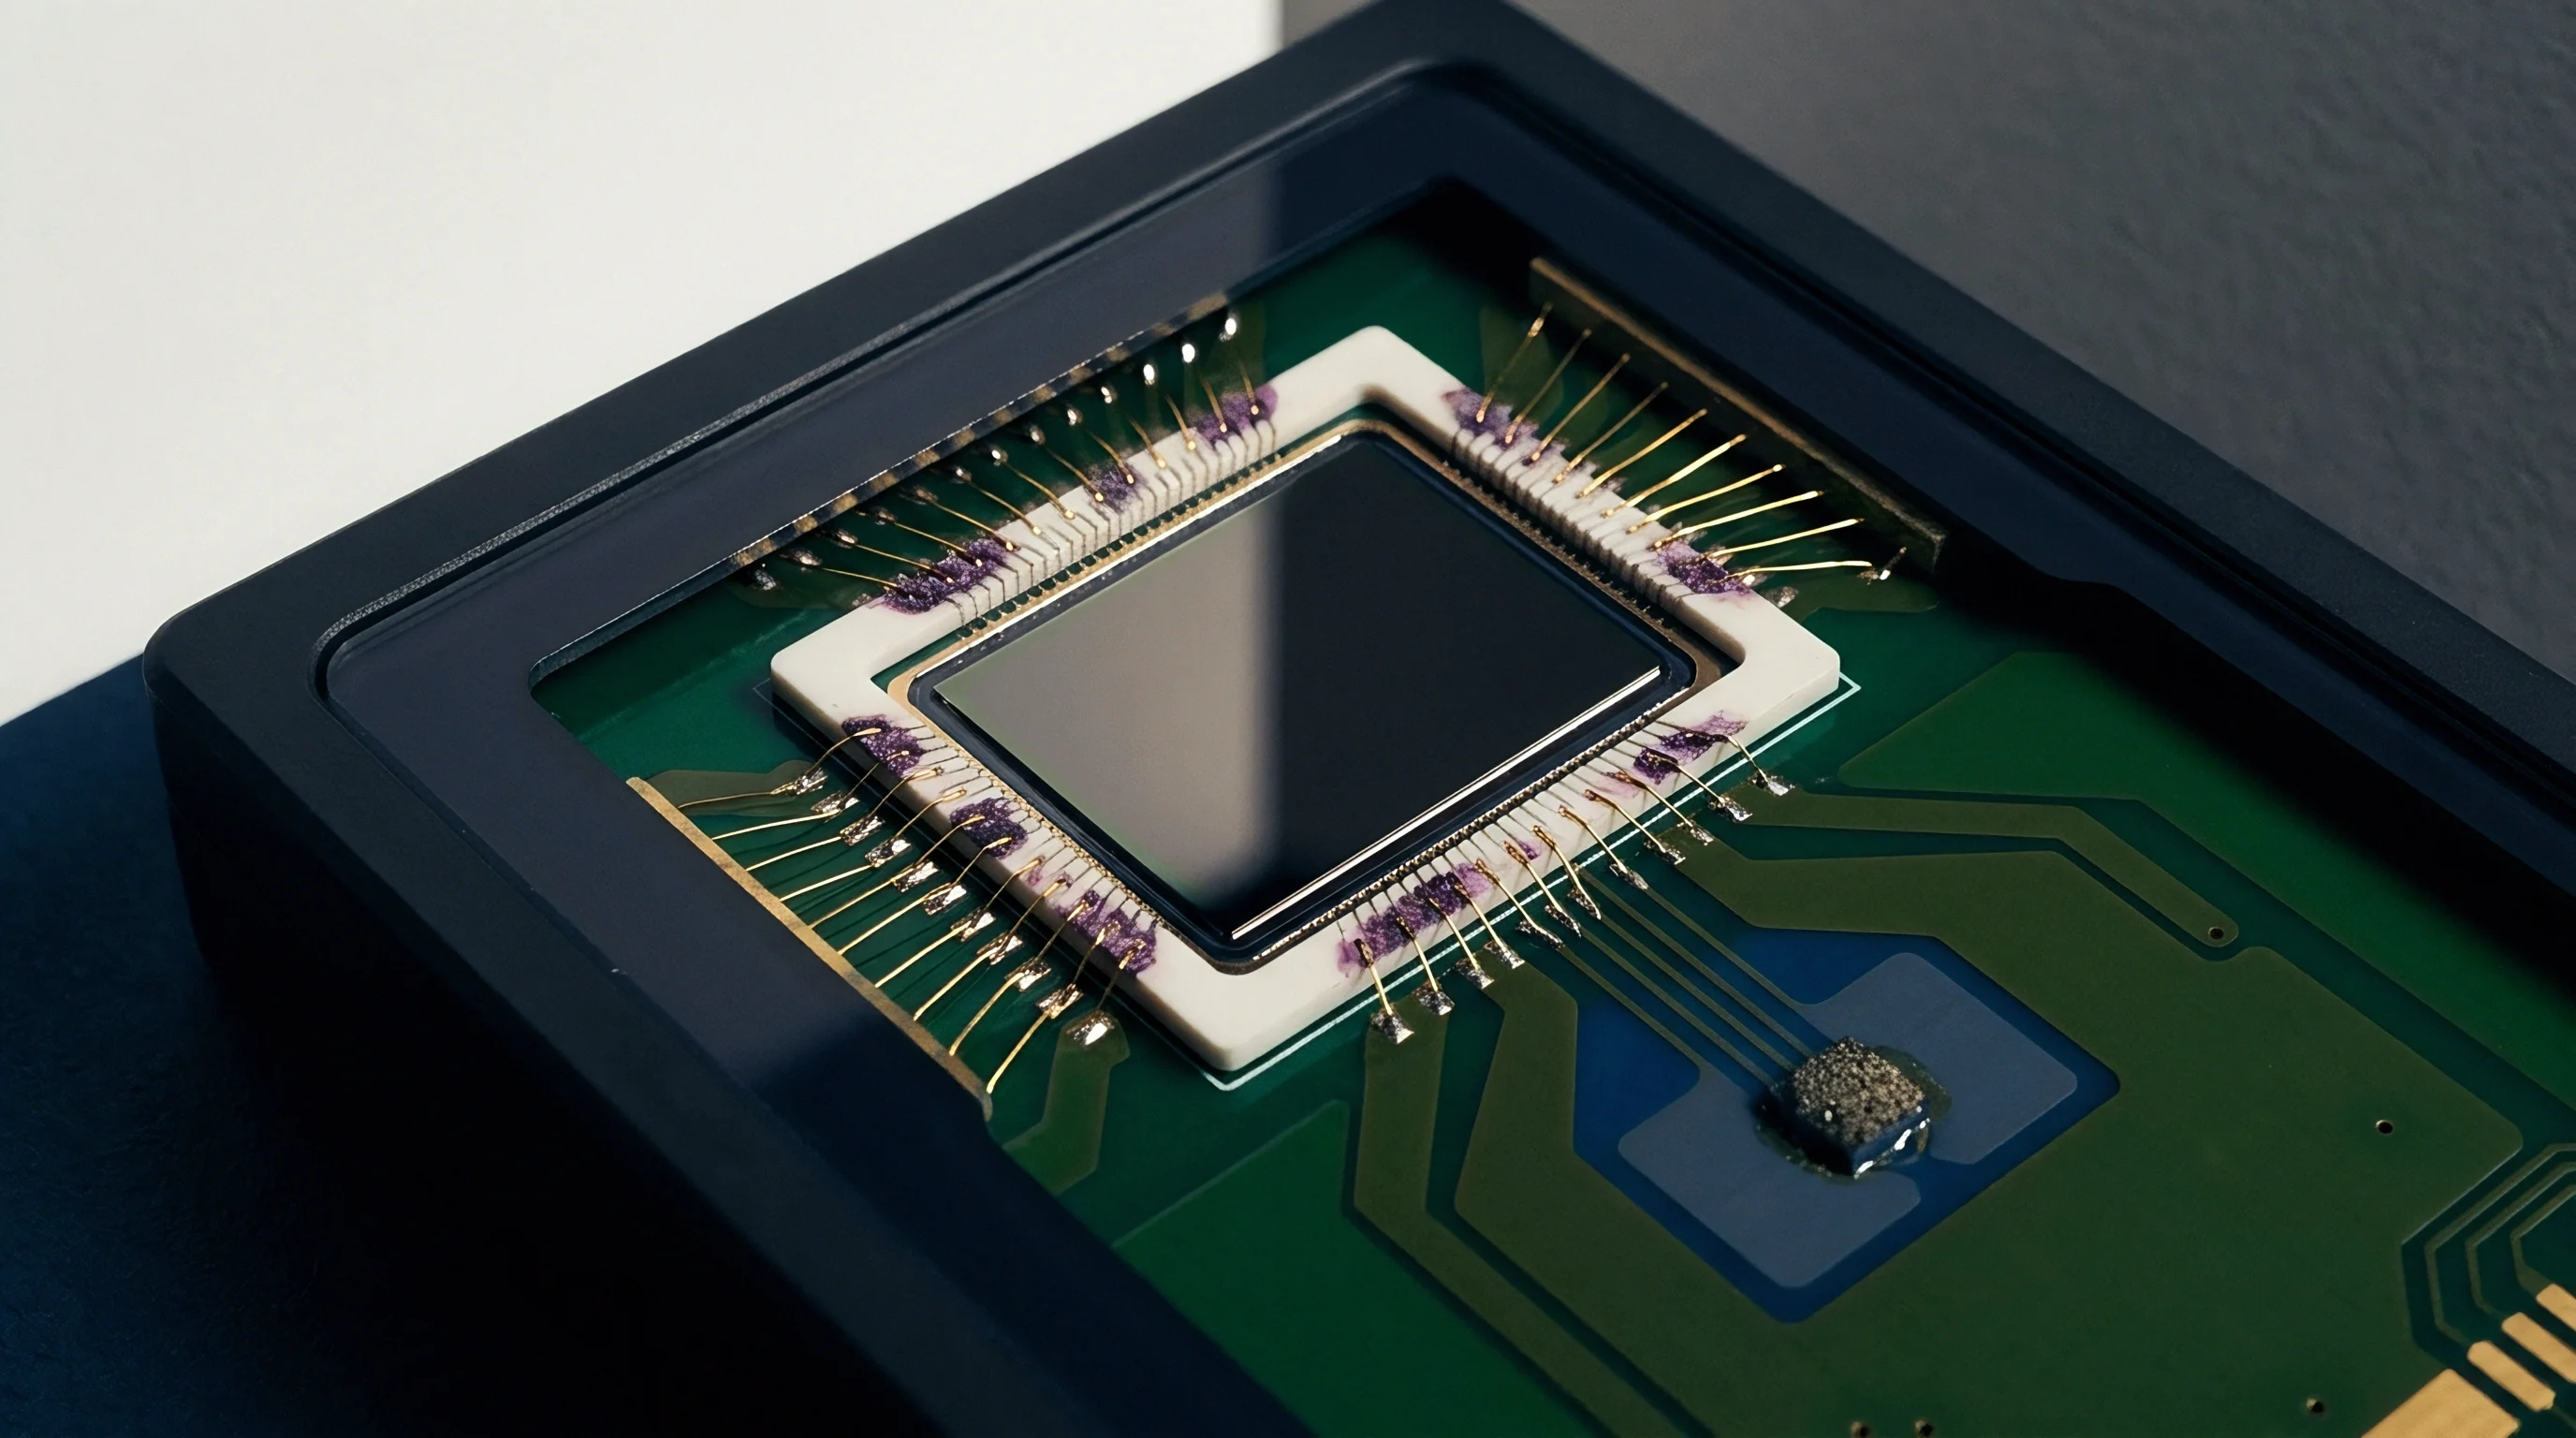
Residual packaging stresses alter integrated sensor signal baselines. Silicon exhibits significant piezoresistive effects. Normal and shear stresses change the electrical resistivity of doped silicon resistors embedded in MEMS diaphragms or ASIC analog reference circuits.
Piezoresistive bridge offset shift of 1.85 mV/V after lead-free peak reflow rests on four-point bending calibration on 300 mm wafers with 15-micron epitaxial layers. This value shifts upward if the solder pad aperture ratio deviates beyond 1:1.
Mechanical Transfer to Sensing Elements
The fractional change in electrical resistance ΔR / R couples to silicon stress tensors through piezoresistive coefficients πij:
ΔR / R = π11 σ11 + π12 (σ22 + σ33)
For p-type diffused resistors aligned along the crystallographic direction on a (100) silicon wafer, differential bridge offset shifts link directly to in-plane normal stress differentials:
ΔVout / Vin = (1/2) π44 (σxx – σyy)
Packaging stress is rarely uniform across the die surface. Compressive stresses peak near die center, often reaching -150 MPa. Significant shear stress concentrations appear at die corners, exceeding 80 MPa.
Moisture absorption expands the molding compound, partially counteracting thermal contraction stresses. Subsequent desorption during reflow reverses this effect. The sensor experiences large stress swings during soldering, followed by a gradual post-reflow stabilization period lasting several weeks.
Packaging stress shifts analog bridge outputs out of factory calibration windows unless decoupling leadframes or low-modulus die attach layers isolate the die.
Mechanical stress translates directly into firmware bring-up complexity. When an environmental pressure sensor or three-axis accelerometer undergoes reflow soldering, its factory zero-g or zero-pressure offset shifts. Solder pad land patterns directly govern this stress transfer.
Asymmetrical board layouts, uneven copper balance, or non-uniform stencil printing introduce asymmetric mechanical moments across the package. The host microcontroller cannot distinguish these mounting stresses from true environmental inputs.
Can Polyimide Buffers Prevent Signal Offset?
Polyimide stress buffer coatings applied to the active wafer surface reduce mechanical stress transfer. A 5-micron to 10-micron layer of photosensitive polyimide redistributes localized shear stresses from the molding compound. It spreads point loads away from sensitive analog reference circuitry.
The buffer reduces in-plane differential stress (σxx – σyy) across the die surface by 40 to 65 percent.
Compensating for reflow-induced zero-point shifts requires a structured engineering procedure:
- Assemble the sensor onto the printed circuit board using qualified reflow temperature curves and symmetrical stencil apertures.
- Store assembled boards under controlled ambient conditions for 168 hours to permit post-reflow moisture re-equilibration and viscoelastic relaxation.
- Establish communications over I2C or SPI at bus speeds no higher than 100 kHz to verify base register readability.
- Read raw uncompensated analog-to-digital converter registers at two known reference points, logging the raw offset value.
- Calculate individual channel offset correction coefficients and write them into local non-volatile host memory registers.
- Verify digital output linearity across operating limits at maximum specified bus clock rates up to 10 MHz.
A symmetrical land pattern on a rigid substrate prevents package twisting better than software calibration routines can fix it.

Exposure
Moisture Sensitivity Level (MSL) ratings dictate the factory handling procedures required before components pass through reflow ovens. Standard J-STD-020 classifies packages from MSL 1 (unlimited floor life at ≤30 °C / 85% RH) down to MSL 6 (mandatory bake before use). Most high-density quad-flat no-lead (QFN) and ball grid array (BGA) sensor packages achieve MSL 3.
This rating permits an operational floor life of 168 hours at ≤30 °C / 60% RH after opening the moisture barrier bag.
Moisture Sensitivity Sourcing Economics
Floor life management adds ongoing operational costs to manufacturing lines. Once the 168-hour floor life window expires, components undergo baking cycles before assembly. IPC/JEDEC J-STD-033 specifies bake schedules: 24 hours at 125 °C in high-temperature trays, or up to 192 hours at 40 °C (≤5% RH) for parts remaining on standard tape and reel.
Baking at 125 °C oxidizes solder terminations and promotes intermetallic compound growth at lead interfaces. This degrades solderability and lowers board assembly yields.
Low-temperature baking at 40 °C preserves packaging tape, but introduces an eight-day delay in assembly operations. Sourcing engineers balance unit package purchase costs against downstream surface-mount processing costs:
| Package Variant | MSL Rating | Unit Price (100k pcs) | Board Area (mm²) | Firmware Bring-Up (Weeks) | Reflow Stress Risk |
|---|---|---|---|---|---|
| Standard Molded QFN (3×3 mm) | MSL 3 | $0.72 | 9.0 | 3 | High (Die edge peeling) |
| Exposed Pad QFN (Polyimide Buffer) | MSL 2 | $0.86 | 9.0 | 3 | Moderate (Buffer isolates die) |
| Gull-Wing SOIC-8 (Cavity Type) | MSL 1 | $1.15 | 30.5 | 1 | Low (Compliant leads decouple) |
| Ceramic LGA (Hermetic Cavity) | MSL 1 | $3.40 | 16.0 | 2 | Minimal (Zero moisture sorption) |
| Pre-Calibrated Modular Probe | N/A | $14.50 | 120.0 | 0.5 | Zero (Pre-soldered internal assembly) |

Procurement Clauses Governing Floor Life
Purchasing contracts for moisture-sensitive components require precise language specifying barrier packaging standards. Standard procurement clauses state: “All moisture-sensitive devices must be packaged in vacuum-sealed moisture barrier bags with indicating desiccant and a fresh humidity indicator card conforming to IPC/JEDEC J-STD-033. The remaining shelf life at point of delivery must exceed twelve months from the seal date indicated on the bag label.”
Missing or degraded desiccant pouches allow ambient moisture to penetrate bag micro-tears during trans-oceanic freight. If incoming goods exhibit a tripped 10 percent humidity card spot upon arrival, the receiving dock holds the lot for mandatory testing.
The standard procurement contract line stipulating that any opened moisture barrier bag with a tripped humidity indicator invalidates supplier liability for reflow solder defects shifts all financial burden for subsequent package delamination directly onto the buyer unless incoming quality audits document bag vacuum integrity upon arrival.