Thermomechanical Solder Joint Reliability Modeling for Wafer Level Chip Scale Packages under Thermal Cycling
Thermomechanical fatigue modeling for WLCSP solder arrays requires mapping viscoplastic Anand strain energy density to predict field thermal cycling failures.


Strain
Wafer Level Chip Scale Packages (WLCSP) attach direct silicon die to printed circuit boards through exposed solder spheres without an intermediate substrate. Eliminating the package substrate reduces footprint area and parasitic inductance, but exposes solder interconnects directly to thermal expansion differentials. Silicon exhibits an isotropic thermal expansion coefficient of approximately 2.6 ppm/°C, whereas standard glass-epoxy FR4 printed circuit board laminates expand at 14 to 18 ppm/°C along the in-plane axes.
Surface mount assembly bonds these materials at reflow temperatures exceeding 217 °C. Operating environments subsequently cycle the assembly between cold and elevated temperature extremes.
Silicon expands slowly under temperature. FR4 laminate expands much faster. Solder bridges this expansion gap.
Mechanical displacement during thermal swings translates into severe cyclic shear deformation within the individual solder bumps.
Distance to Neutral Point Kinematics
Thermal expansion mismatch between the silicon die and the underlying printed circuit board drives localized shear displacement during ambient temperature transitions. Magnitude of this shear displacement increases linearly with distance from the package neutral point, defined as the geometric center of the bump array where relative lateral motion equals zero. Outer array corners experience maximum mechanical displacement during thermal cycling.
The fundamental engineering expression for nominal shear strain amplitude in an unencapsulated array ball is derived through kinematic geometric relations:
γ = (DNP · Δα · ΔT) / hsolder
Within this relationship, DNP represents distance to neutral point from the die center, Δα defines thermal expansion coefficient differential between silicon die and board substrate, ΔT specifies temperature cycling range, and hsolder designates effective standoff height of the reflowed solder ball. Shear strains concentrate at package corners. Bumps situated at extreme radial distances undergo the highest plastic strain ranges per thermal loop, initiating microstructural degradation ahead of interior bumps.

Dominant Failure Modes in Unencapsulated Interconnects
Cyclic thermomechanical loading induces progressive damage across the solder array structural interface. Corner bumps fail first. Material deformation accumulates unevenly across the solder volume, localizing stress concentrations near package and board metallization interfaces.
- Intermetallic compound microcracking develops at the brittle solder-to-pad interfacial layer where tin-rich phase transformations create mechanical stress riser regions under cyclic shear.
- Recrystallization driven void coalescence occurs along strain localization bands, forming continuous grain boundary networks that facilitate rapid crack growth across the solder ball bulk.
- Pad cratering at PCB copper interface emerges when high shear loads fracture the resin matrix directly beneath surface copper pads on high-density circuit boards.
- Solder fatigue damage accumulation proceeds along primary shear planes, converting plastic strain work into micro-voids that coalesce into macro-cracks across temperature cycles.
The neutral point distance dictates maximum shear displacement in unencapsulated wafer scale packages.
Whether board-level strain relief can be reliably achieved solely through land-pattern geometry optimization without introducing high-cost underfill processes remains open to debate across fast-turn hardware programs.


Creep
Near-eutectic lead-free solder alloys such as SAC305 operating at room temperature sit above half their absolute melting point in Kelvin. Operating environments reaching 85 °C to 125 °C shift solder into elevated homologous temperature regimes where time-dependent plastic deformation dominates mechanical behavior. Thermomechanical reliability modeling requires constitutive material relationships capable of capturing concurrent elastic, rate-independent plastic, and rate-dependent viscoplastic deformation under variable temperature conditions.

Anand Constitutive Model Formulation
Unified viscoplastic formulations capture both rate-dependent plastic flow and internal strain hardening within lead-free solders. Anand’s constitutive model avoids separate yield criteria by employing a single scalar internal state variable representing deformation resistance. The flow equation for equivalent plastic strain rate expresses as a function of equivalent stress and internal state variable:
dεp/dt = A · exp(-Q / (R · T)) · 1/m
Evolution of the internal state variable s follows a hardening-softening functions relationship driven by strain rate and instantaneous stress state:
ds/dt = {h0 · |1 – s / s |a · sign(1 – s / s )} · (dεp/dt)
Where s defines saturation value for internal state resistance:
s = s_hat · n
| Parameter Symbol | Physical Definition | Value (SAC305) | Units |
|---|---|---|---|
| A | Pre-exponential factor | 1.79 × 10⁷ | 1/sec |
| Q/R | Activation energy / Universal gas constant | 9.97 × 10³ | Kelvin |
| ξ | Stress multiplier | 0.35 | Dimensionless |
| m | Strain rate sensitivity exponent | 0.303 | Dimensionless |
| h0 | Hardening / softening constant | 2.62 × 10⁵ | MPa |
| s_hat | Coefficient for deformation resistance saturation | 2.53 × 101 | MPa |
| n | Deformation resistance strain rate sensitivity | 0.022 | Dimensionless |
| a | Strain hardening evolution exponent | 1.78 | Dimensionless |
| s0 | Initial value of deformation resistance variable | 2.15 × 101 | MPa |
Inelastic Strain Energy Density Dissipation
Calculating accumulated damage per thermal loop requires integrating plastic work density across the critical solder joint volume. Darveaux’s energy-based fatigue approach correlates crack initiation cycle count and crack growth rate directly to plastic strain energy density accumulated per thermal cycle (ΔWacc). Inelastic strain energy density divides into plastic work and viscoplastic work accumulated across the thermal dwell and ramp periods:
ΔWacc = ∫ σ dεinelastic = ∑ (ΔWplastic + ΔWcreep)
High thermal dwell temperatures relax shear stress rapidly, converting stored elastic strain energy into creep work. Dwell times drive creep saturation. Low temperature holds preserve internal stress, driving plastic strain work during subsequent thermal ramps.
Total inelastic energy density accumulated per cycle serves as input parameter for empirical life estimation functions.
Extended temperature dwell times allow inelastic stress relaxation to complete fully within the solder matrix.
Thicker circuit boards drive higher shear stress into outer array solder balls during thermal ramps.

Mesh
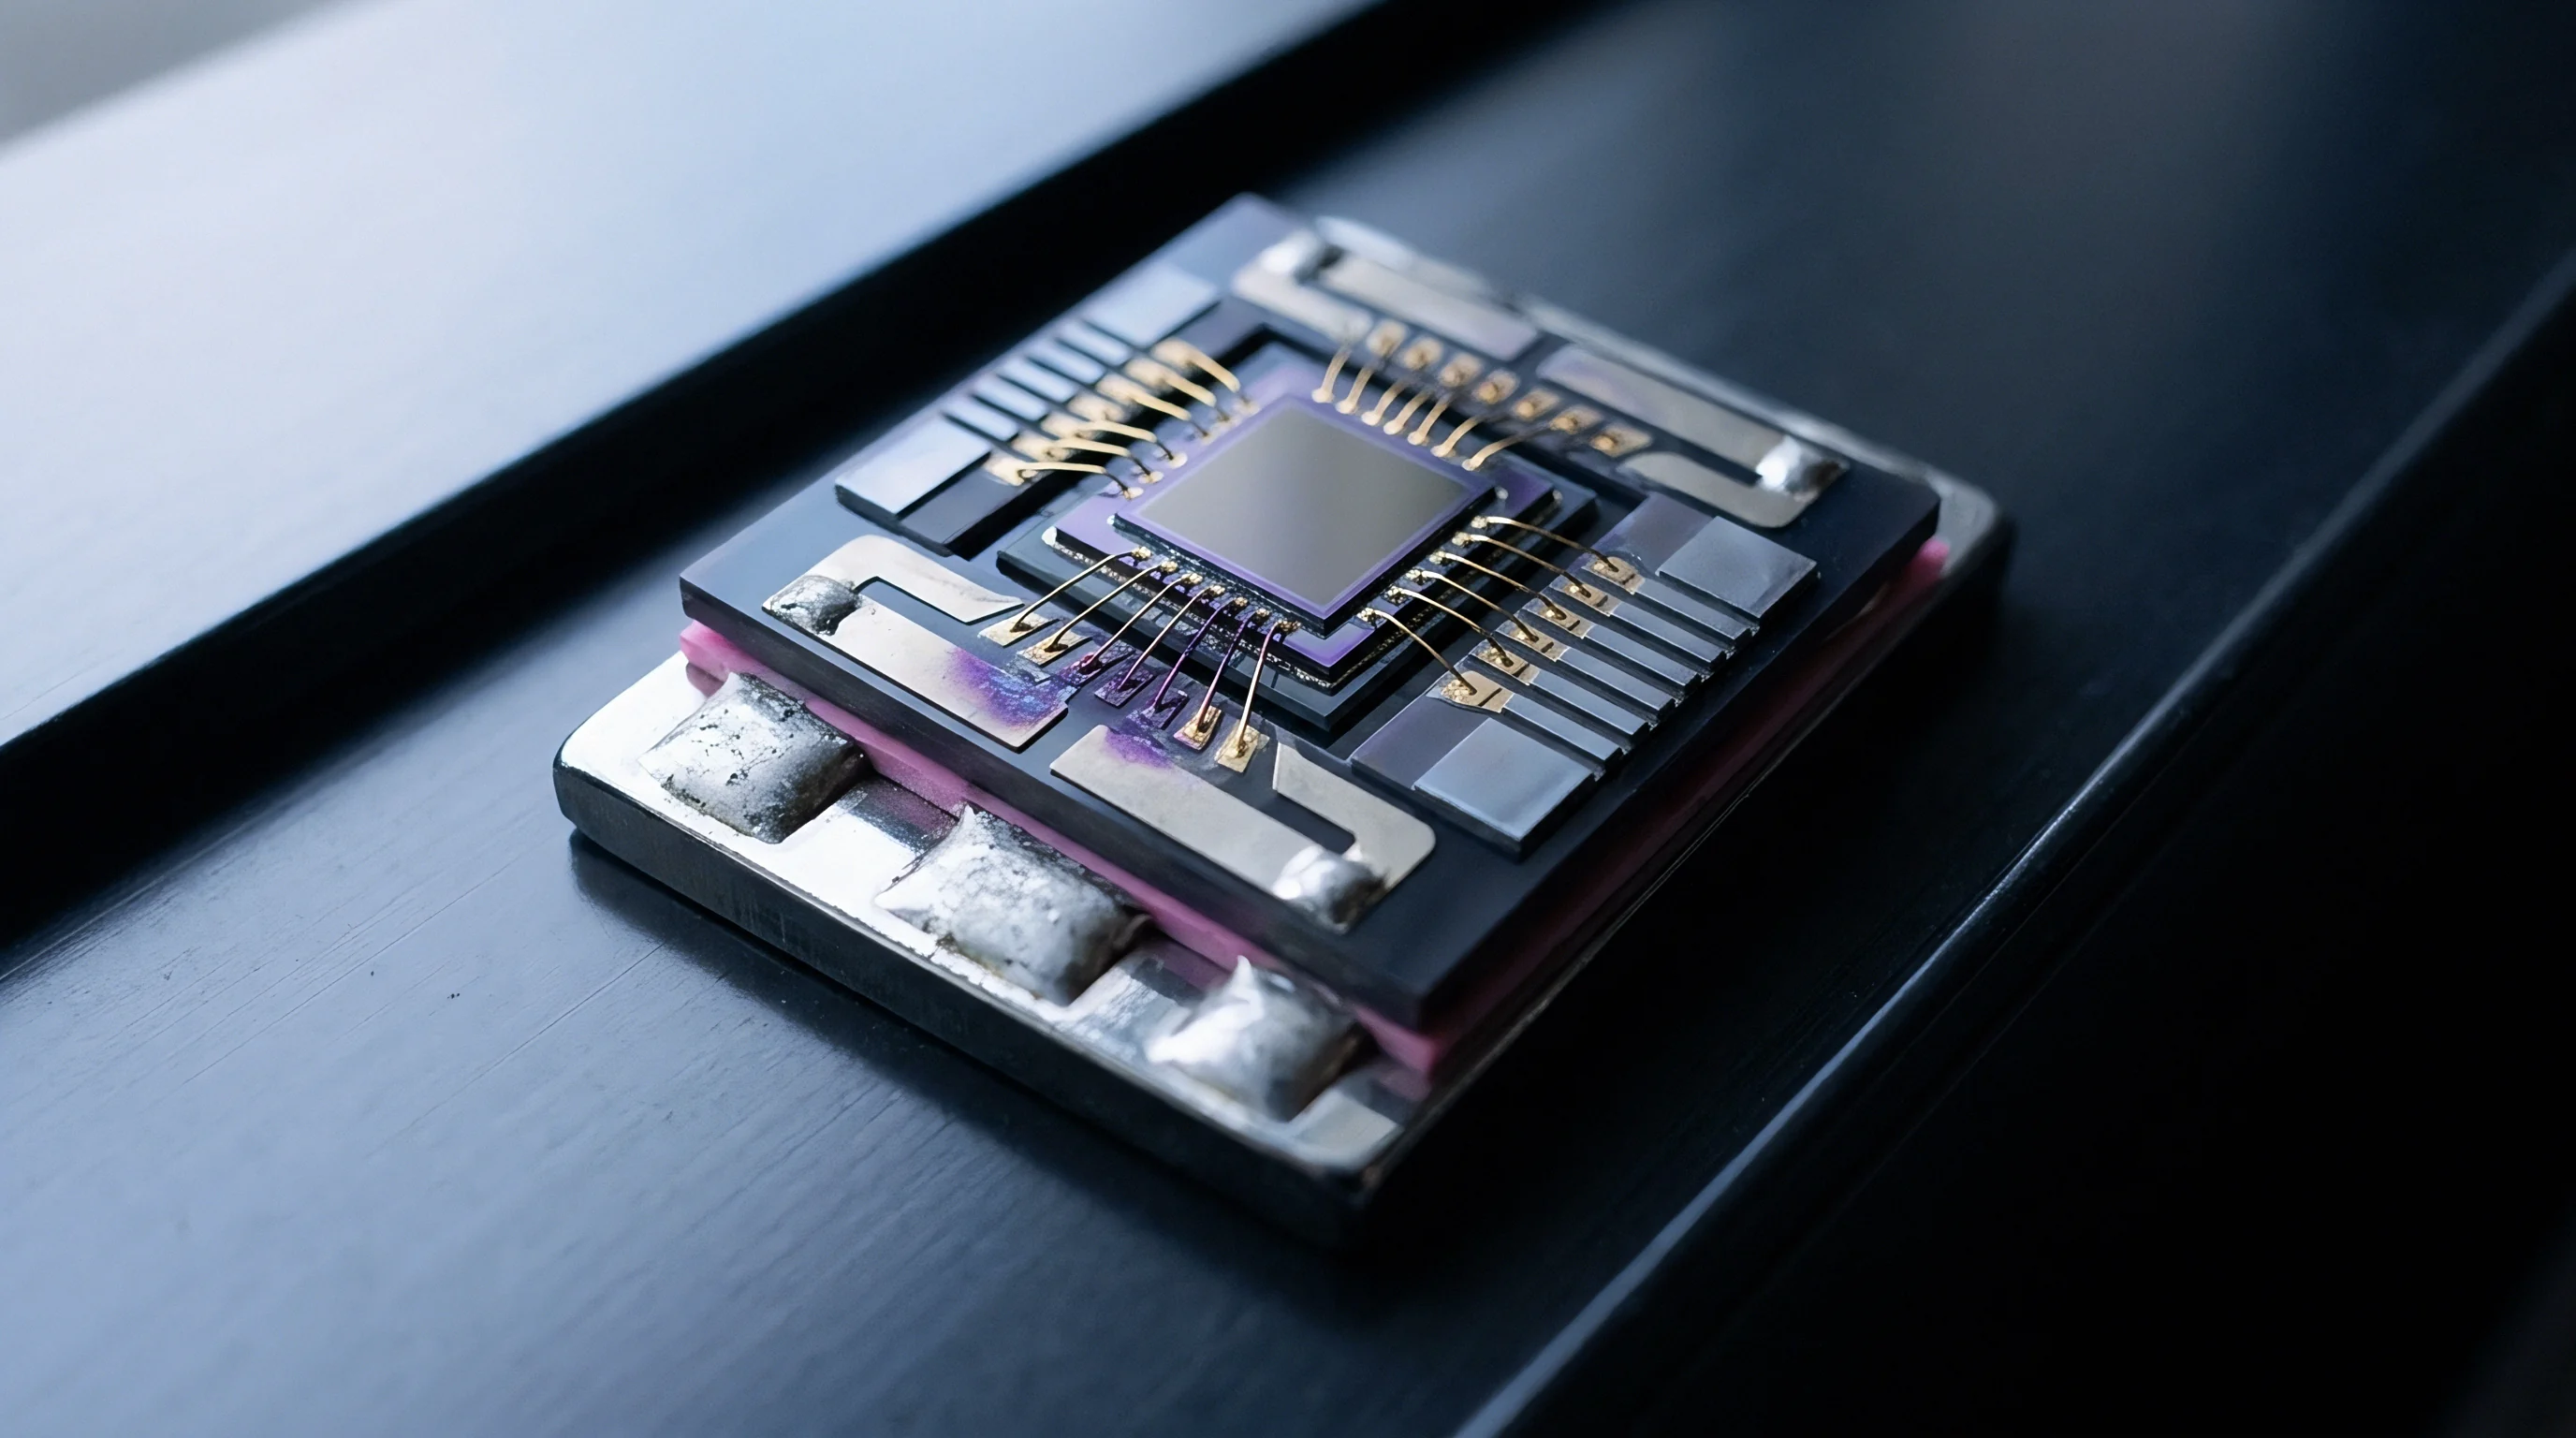
Predictive thermomechanical simulation of wafer-scale package arrays requires balancing numerical resolution at critical solder interfaces with global structural compliance modeling. Analyzing a full electronic assembly containing dozens of high-density interconnects demands discrete spatial discretization strategies to prevent excessive computational execution times without sacrificing local stress accuracy.
Global-to-Local Submodeling Architecture
Full-scale three-dimensional finite element representations of entire circuit board assemblies demand excessive computational memory. Submodeling techniques resolve localized stress gradients by partitioning global structural calculations from refined local component geometries. Cut-boundary displacement pass-through enables accurate multiscale simulation.
- Construct a global quarter-symmetry model incorporating the silicon die, solder array, and multi-layer printed circuit board using hex elements.
- Execute a non-linear transient thermal-stress analysis applying JEDEC temperature profile boundary conditions to solve global displacements.
- Extract cut-boundary displacement vectors from the global model at the outer corner bump location experiencing peak stress.
- Construct a refined local submodel of the critical solder ball and adjacent pad structures with twenty-micrometer element density.
- Map global displacement boundary conditions onto submodel cut boundaries and re-evaluate non-linear stress-strain response.
- Compute averaged inelastic strain energy density dissipation across the thin intermetallic interface layer to input into crack initiation models.

Interface Element Convergence and Singularity Handling
Stress concentrations arising at sharp geometric corners near copper pads produce unphysical stress peaks as grid element size approaches zero. Linear elastic stress values at re-entrant corners do not converge. Inelastic volume-weighted averaging mitigates numerical sensitivity to spatial discretization near interface boundaries.
Coarse meshes underestimate plastic deformation. Intermetallic layers fracture under stress. Darveaux’s failure formulation applies volume-averaging across a controlled layer of elements located directly along the crack interface.
The volume-weighted inelastic energy density (ΔWave) calculates across the element layer adjacent to the pad interface according to spatial weighting:
ΔWave = (∑ ΔWi · Vi) / (∑ Vi)
Where ΔWi represents inelastic strain energy density of element i, and Vi specifies element volume. Establishing element layer thickness at 25 micrometers maintains consistency with empirical material constant calibrations, rendering life predictions independent of local element refinement levels.
Failing to average inelastic energy density across a fixed element thickness causes crack propagation predictions to diverge uncontrollably, leading teams to approve unviable physical package dimensions.

Cycles
Accelerated thermal reliability testing subjects populated printed circuit assemblies to repetitive temperature swings inside environmental chambers. Standard test profiles accelerate fatigue mechanisms to compress years of operational thermal exposure into weeks of qualification testing. Accurate model correlation relies on converting chamber performance data into operational field failure predictions through acceleration factor calculations.

JESD22 Condition Standard Mapping
Environmental testing profiles establish standardized temperature limits and dwell durations to validate electronic hardware. JEDEC JESD22-A104 standards govern component and board-level thermal cycling test conditions. Standardized cycling condition parameters dictate ramp rates, peak exposure temperatures, and dwell durations necessary to induce creep stress relaxation.
| Test Condition | Min Temp (°C) | Max Temp (°C) | ΔT (°C) | Nominal Dwell (min) | Typical Ramp Rate (°C/min) |
|---|---|---|---|---|---|
| Condition A | -40 | +85 | 125 | 10 to 15 | 10 to 15 |
| Condition B | -40 | +100 | 140 | 10 to 15 | 10 to 15 |
| Condition C | -65 | +150 | 215 | 10 to 15 | 10 to 15 |
| Condition G | -40 | +125 | 165 | 10 to 15 | 10 to 15 |
| Condition J | -55 | +125 | 180 | 10 to 15 | 10 to 15 |
When Does Thermal Dwell Time Saturate Creep Damage?
Holding a package at high temperature extremes permits internal stresses within lead-free solder to decay toward zero. Creep relaxation rates slow exponentially as stress drops. Extending high-temperature dwell durations beyond twenty minutes yields diminishing additions to cyclic inelastic energy dissipation while increasing test campaign length.
Norris-Landzberg modifications to the Coffin-Manson relationship calculate acceleration factors (AF) connecting field operating environments to accelerated test condition cycles:
AF = (Nfield / Nlab) = (ΔTlab / ΔTfield)m · (ffield / flab)n · exp
Within this empirical relationship, exponent m equals 1.9 for SAC solder alloys, frequency exponent n equals 0.33, activation energy Ea equals 0.12 eV, and k represents Boltzmann’s constant (8.617 × 10⁻⁵ eV/K). Weibull statistical distributions fit failure datasets, yielding shape parameter β reflecting failure mode consistency and characteristic life parameter η defining cycles to 63.2% cumulative population failure.
A temperature swing from minus forty to one hundred twenty-five degrees Celsius reduces SAC305 characteristic life by sixty-five percent compared to eighty-five degree peak cycling.
Packaging vendors routinely attribute early field returns to customer board-reflow profile deviations rather than fundamental shear strain mismatches inherent in unencapsulated die layout.

Pad
Printed circuit board land pattern design establishes the physical geometry and mechanical boundary conditions of the solder joint array. Solder mask opening definitions directly alter stress concentration profiles along pad edges, governing whether cracks initiate within the solder bulk or at board metallization interfaces.

Non Solder Mask Defined versus Mask Defined Geometries
Copper trace definitions at the board bonding site dictate solder ball collapse profiles during surface mount reflow. Non-Solder Mask Defined (NSMD) pads expose copper sidewalls, permitting molten solder to wet around pad edges. Solder Mask Defined (SMD) pads cover trace edges with polymer mask, restricting solder wetting exclusively to the top copper surface.
| Design Feature | NSMD Land Pattern | SMD Land Pattern | Reliability Impact & Trade-off |
|---|---|---|---|
| Pad Diameter Ratio | 0.80 to 0.85 × Bump Diameter | 1.00 to 1.05 × Bump Diameter | NSMD provides higher fatigue life under thermal cycling. |
| Stress Concentration | Distributed across copper edge radius | Focused at sharp solder mask edge | SMD creates stress risers that accelerate microcracking. |
| Interfacial Adhesion | High (top surface + copper sidewall) | Moderate (top surface area only) | NSMD resists trace peeling during mechanical shock. |
| Solder Mask Clearance | 50 μm minimum web requirement | Not applicable (mask overlaps copper) | NSMD requires tight mask registration manufacturing tolerances. |
| Trace Routing Space | Greater space between pads | Reduced space due to mask overhang | NSMD enables denser escape routing on outer board layers. |
Underfill Dispensing and Corner Bond Reinforcement
Polymeric encapsulation around array solder spheres reduces shear displacement during thermal expansion cycles. Capillary Underfill (CUF) flows beneath die surfaces via capillary forces, enveloping solder balls in rigid epoxy resin with matched CTE (22 to 30 ppm/°C). Underfill redistributes localized shear loads across the entire die area, converting localized solder joint shear into global package bending stress.
- Trace exit alignment symmetry balances mechanical stiffness by routing trace exits radially away from the package neutral point.
- Solder mask registration tolerances maintain uniform pad areas across fine-pitch arrays, preventing unsymmetrical bump collapse height variations.
- Underfill fillet epoxy dispensing clearance requires keeping a three-hundred-micrometer keep-out zone around die edges clear of passive passives.
- Board stiffness ratio management limits primary PCB thickness to 1.0 mm where unencapsulated die exceed four millimeters in length.
Adherence to IPC seven three five one land pattern guidelines prevents asymmetrical joint formation during surface mount reflow.
Enforcing IPC J-STD-001 Class 3 acceptance criteria for minimum standoff height forces assembly lines to reject assemblies with excessive bump collapse, preventing premature fatigue cracking in high-reliability applications.

Outlay
Selecting between standard WLCSP, underfilled array, and land grid array package variants involves calculating cumulative manufacturing expenses against qualification risks. Hardware programs evaluate component cost against secondary manufacturing steps, testing duration, and field return liabilities.

Qualification Chamber Time and Yield Cost Drivers
Long environmental testing durations impact project release schedules and commit engineering capital during hardware verification. Thermal cycling qualification per JESD22 Condition G requires running environmental chambers for 1,000 to 3,000 continuous hours to log 1,000 cycles at standard ramp rates. Test chamber allocation expenses run between $8,000 and $22,000 per qualification run depending on channel monitoring density.
Thicker substrates increase strain energy. Voiding reduces effective joint area. Secondary underfill processing introduces capital equipment requirements and throughput bottlenecks onto surface mount assembly lines.
Automated underfill dispensing units add $90,000 to $180,000 per placement line, while liquid epoxy dispensing and curing cycles add $0.08 to $0.22 per board unit. Eliminating secondary underfill processes through footprint optimization or switching to encapsulated ball grid array variants reduces assembly cycle time by twelve to eighteen seconds per circuit board.
Integrating thermomechanical fatigue simulation into early package architecture selection eliminates late-stage board redesigns, preserving target margin structures across high-volume production runs.