Allan Variance Noise Identification Parameters in Closed Loop Inertial Navigation Systems
Closed loop inertial sensor Allan variance noise parameters require isolating active rebalance filter artifacts before populating discrete Kalman filter process noise matrices.
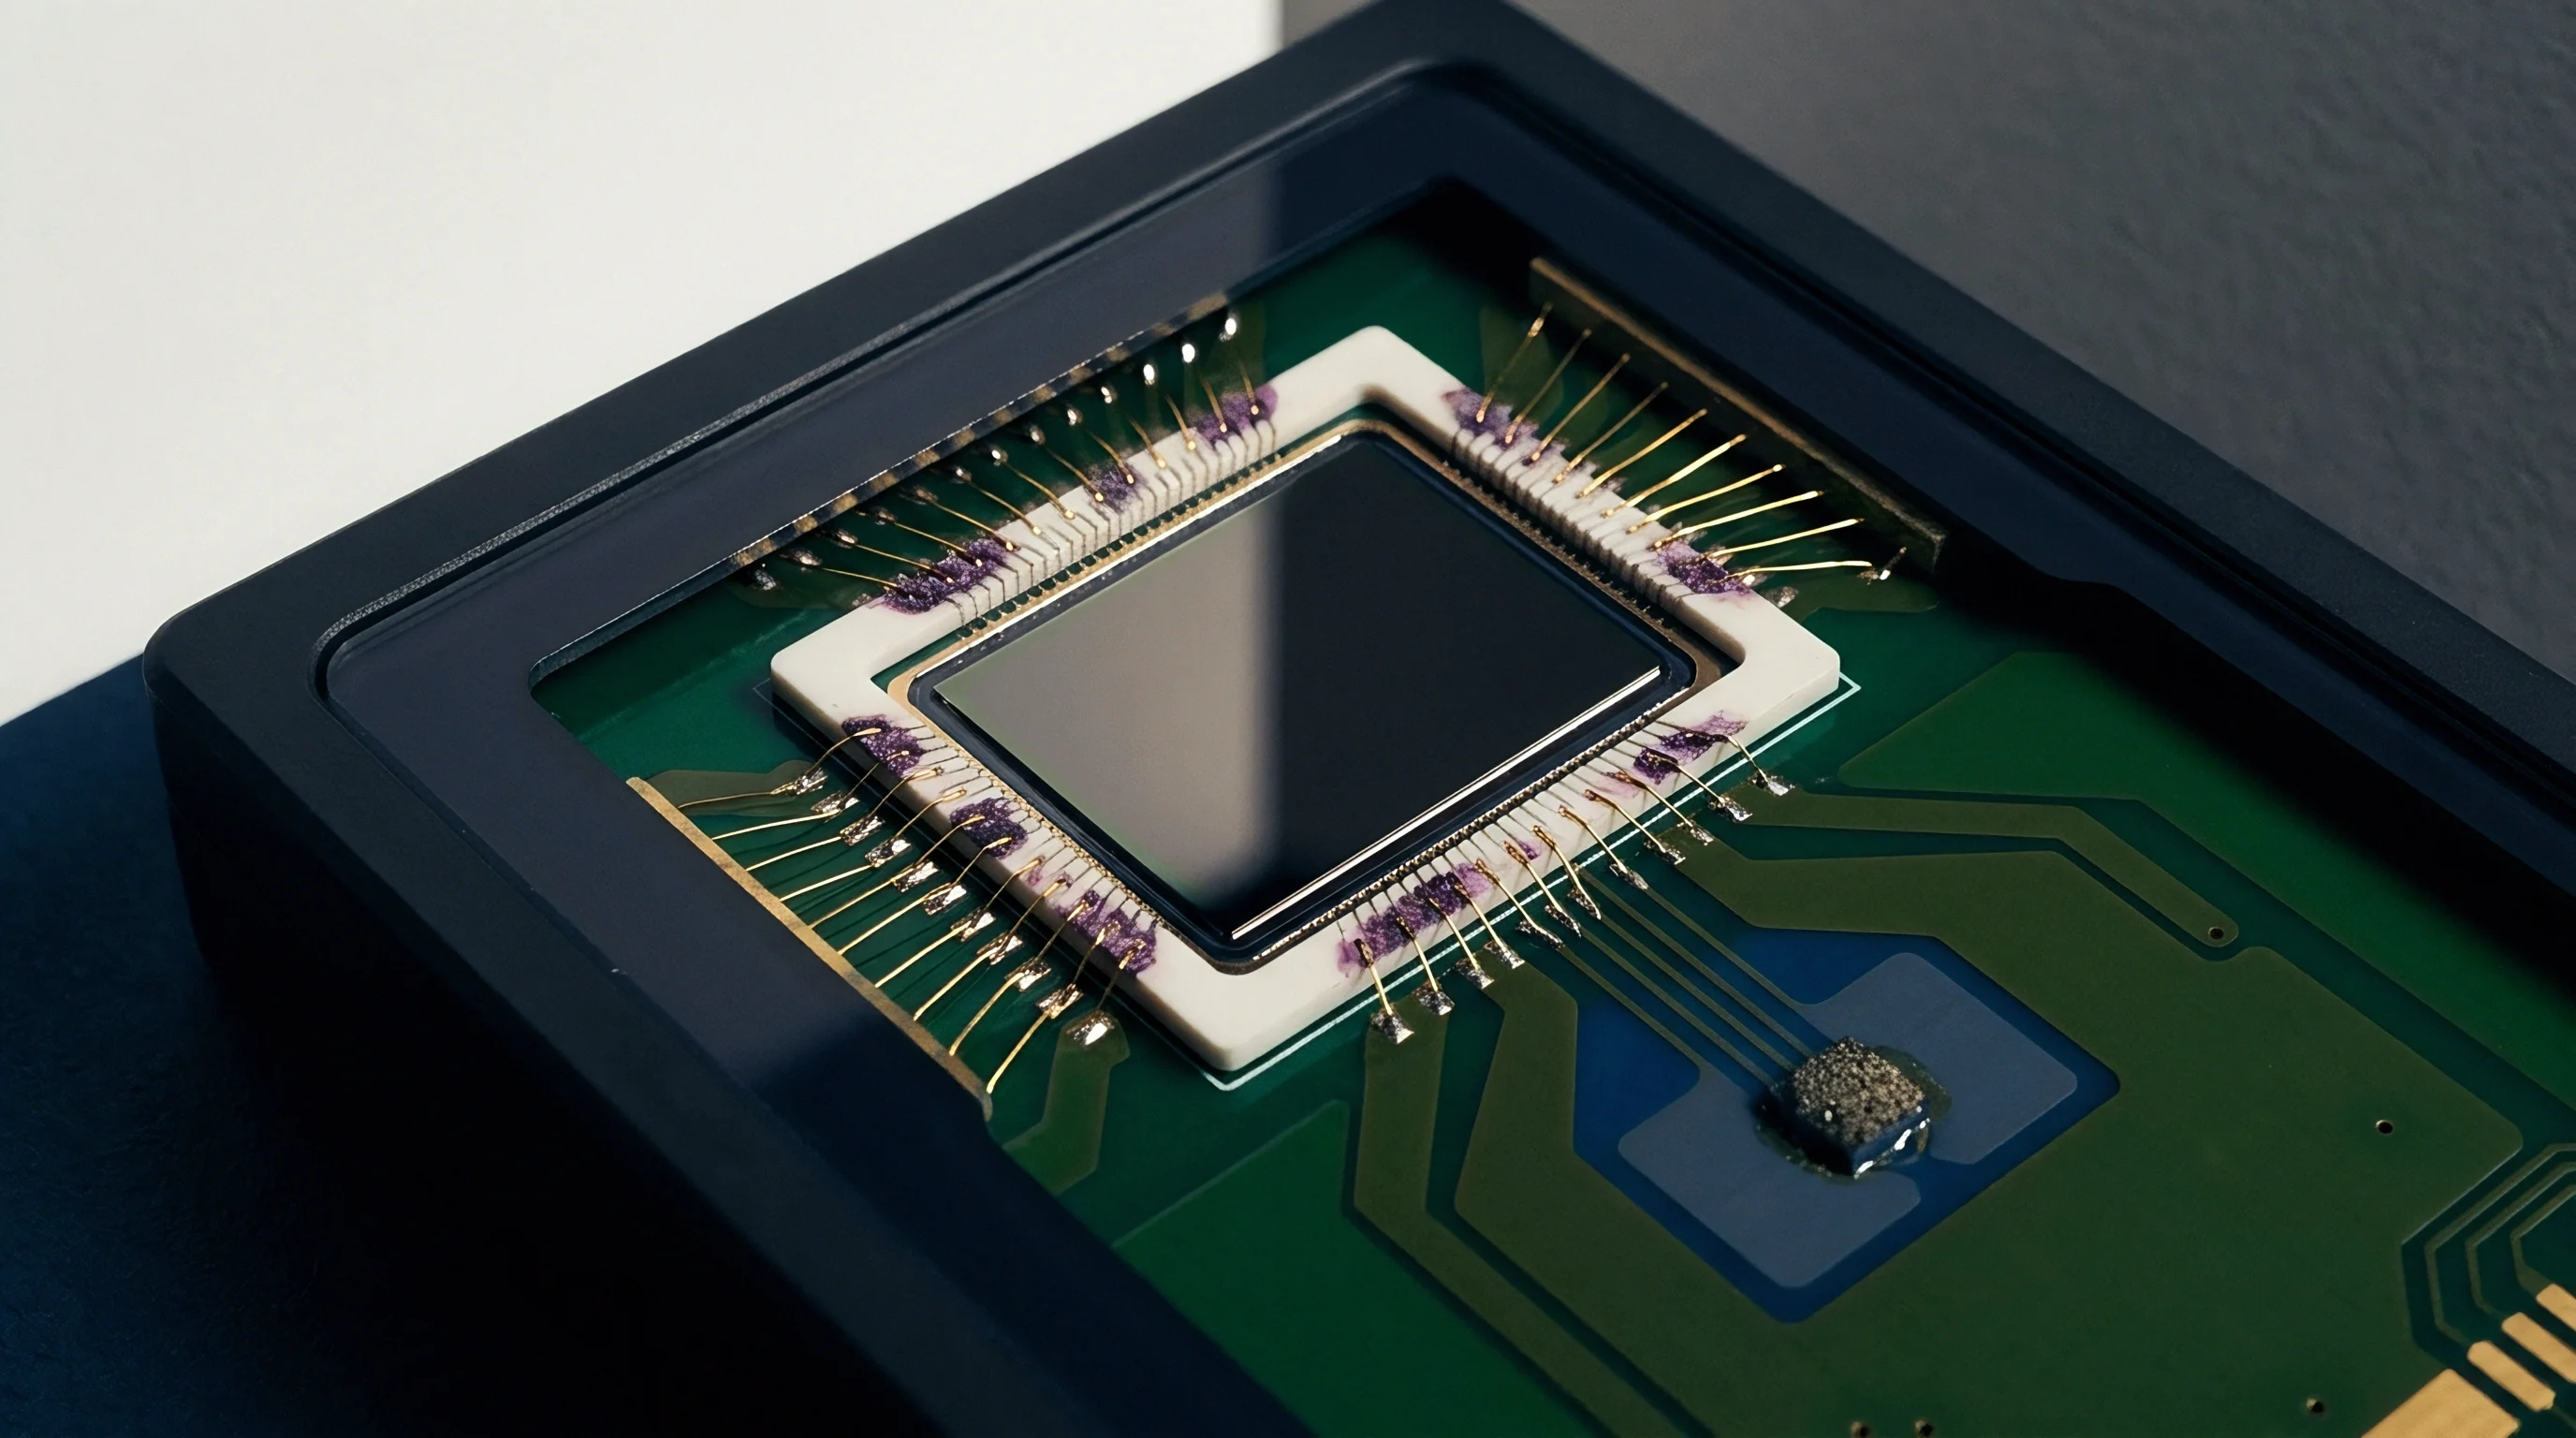

Feedback
Closed-loop inertial sensors apply active electrostatic or optical rebalancing forces to hold internal sensing elements near zero physical deflection. Open-loop sensors measure physical displacement directly through capacitive, piezoresistive, or optical phase changes under angular rate or linear acceleration. Closed-loop architectures convert that displacement into an error signal, process it through a loop feedback amplifier, and drive an actuator to generate an opposing physical force.
Active rebalancing expands dynamic range, reduces cross-axis sensitivities, and improves scale factor linearity over operating temperature bounds. Active force balancing introduces dynamic feedback loop compensation networks, digital pulse-rebalance electronics, and actuation noise components into raw sensor outputs. Allan variance noise identification parameters in closed loop inertial navigation systems must isolate intrinsic sensor noise mechanisms from artifacts created by loop dynamics, demodulation filtering, and quantization rebalance schemes.
In closed-loop micro-electro-mechanical systems (MEMS) accelerometers and gyroscopes, as well as closed-loop Interferometric Fiber Optic Gyroscopes (IFOG) and Hemispherical Resonator Gyroscopes (HRG), output signals do not reflect raw physical displacement alone. The measured signal represents the drive voltage or digital pulse train required to restore proof mass equilibrium or optical zero-phase condition. Dynamic loop filters inside active rebalancing systems alter high-frequency noise transmission, creating sharp attenuation curves at tau integration times below loop response limits.
Signal processing logic inside closed-loop platforms changes how physical error mechanisms manifest across different time scales on log-log Allan deviation curves.

Force Rebalance Loop Dynamics
Active nulling keeps sensor proof masses stationary under external angular acceleration. Capacitive pickoffs sense picometer-scale motion off nominal position, passing voltage error signals to analog proportional-integral-derivative compensation circuits or discrete digital signal processors. Drive electronics apply proportional electrostatic forces through feedback electrodes to drive mass displacement back toward zero.
Open-loop sensors allow physical proof masses to displace proportionally to input acceleration, subjecting sensing flexures to non-linear mechanical restorative forces. Closed-loop architecture transfers mechanical linearity burdens onto electrostatic feedback actuators.
Transfer functions across rebalance loops shape stochastic noise density before data leaves sensor sub-assemblies. Sensing elements possess mechanical resonance frequencies set by proof mass weight and flexure stiffness. Rebalance loops maintain stable control margins by applying high-order low-pass filters or lead-lag compensators.
These compensation networks impose high-frequency phase shifts and magnitude rolloffs. Short-term Allan variance regions, corresponding to integration times under one millisecond, exhibit steep artificial slopes where rebalance filter gain rolloff suppresses physical white noise. The identified angle random walk parameter on an Allan variance plot reflects a combination of thermomechanical Brownian motion noise and high-frequency active feedback control loop shaping.
At an integration time of 0.01 seconds and 25°C thermal stabilization, the short-tau Allan deviation is dominated by closed-loop rebalance filter attenuation rather than physical sensing mass Brownian noise.
In optical closed-loop sensors such as IFOGs, active phase ramp modulators adjust phase differences between counter-propagating light waves inside fiber coils. Closed-loop phase rebalancing eliminates optical intensity non-linearities at the photodetector output. Optical phase rebalance circuits introduce high-frequency phase-step quantization noise and digital-to-analog converter voltage ripple.
The resulting noise profile exhibits distinct quantization noise slopes at low integration times, shifting into angle random walk and bias instability at intermediate tau values.
Mechanical Proof Mass Demodulation
Piezoresistive and capacitive displacement pickoffs convert physical displacement into proportional voltage signals. Vibrating structure gyroscopes depend on precise synchronous demodulation to extract angular rate signals from high-frequency carrier signals. Drive loops excite proof masses along drive axes, while Coriolis forces transfer kinetic energy onto orthogonal sense axes.
Synchronous demodulation electronics multiply sense signals with drive carrier references, filtering residual carrier ripple through low-pass filters.
Phase alignment between drive carriers and demodulation clocks governs quadrature error rejection. Phase errors introduce drive axis coupling into sense outputs, injecting additive white rate noise into rate readings. Closed-loop drive control circuits hold drive amplitudes constant through automatic gain control loops.
When automatic gain control loops exhibit subtle thermal or low-frequency amplitude fluctuations, those fluctuations propagate through sense circuits as low-frequency rate bias noise. These fluctuations mask true bias instability parameters during log-log Allan variance curve parameter extraction.
Electrostatic Actuator Non-Linearities
Voltage-squared force relations introduce harmonic distortions into drive currents. Electrostatic actuators generate force proportional to the square of applied voltage across feedback electrode gaps. Feedback electronics use bias voltage offsets or square-root voltage drivers to linearize actuation forces.
Electrostatic spring softening effects occur when applied electric fields alter effective mechanical flexure stiffness.
Temperature shifts modify electrode gaps, die seal stresses, and amplifier gains. When temperature swings alter feedback electrode gap spacing by mere nanometers, rebalance scale factors drift. Thermal drifts appear on Allan deviation plots as rate random walk or rate ramps at long integration times exceeding one thousand seconds.
Closed loop inertial sensors utilize embedded digital thermal compensation tables to subtract high-order thermal bias drift. Residual uncompensated thermal noise creates long-term slope shifts on log-log variance plots, corrupting long-tau noise identification if environmental conditions are not controlled within fractions of a degree Celsius during bench calibration.
Failure to isolate feedback loop shaping from raw sensor noise profiles results in incorrect process noise covariance entries in navigation Kalman filters, causing filter divergence and degraded position state estimation under rapid dynamic maneuvers.
Spectrum
Stochastic process characterization relies on variance computed over varying cluster integration intervals. Allan variance, standardized in IEEE Std 952 for gyroscopes and IEEE Std 1554 for accelerometers, evaluates variance across adjacent time-averaged clusters extracted from high-frequency rate or acceleration logs. Taking log-log plots of Allan deviation against cluster integration time tau allows engineers to visually and analytically identify distinct stochastic noise parameters based on characteristic logarithmic slope values.
In closed-loop systems, these parameter slopes align with physical noise processes, provided filtering and loop dynamics do not distort specific tau regions.
Log-log slope identification operates on specific mathematical relationships between Allan deviation slope b and noise power spectral density exponent α. Slopes on Allan deviation plots map directly to standard noise modes: slope minus one represents quantization noise, slope minus one-half represents angle random walk or velocity random walk, slope zero represents bias instability, slope plus one-half represents rate random walk or acceleration random walk, and slope plus one represents rate ramp. Closed-loop sensors introduce complex control loop poles and digital finite impulse response filters that tilt or bend these ideal slopes, demanding rigorous slope isolation techniques during parameter identification.
Five Core Stochastic Noise Parameters
Inertial sensor noise breakdown spans quantization error, angle random walk, bias instability, rate random walk, and rate ramp. Each parameter occupies a distinct temporal region on Allan variance plots, defining specific noise mechanisms inside closed-loop sensor architectures.
Evaluating raw rate logs requires calculating root Allan variance values across tau ranges spanning from inverse sample rates up to one-third of total test duration. Allan deviation log-log plots are evaluated by strictly separating low-frequency thermal variations from stochastic noise floors. Parameter values extracted from these plots directly populate continuous and discrete state estimation algorithms.
Quantization noise dominates shortest tau regions with a slope of minus one on log-log plots. Closed-loop digital rebalance schemes convert analog displacement or phase signals into digital pulse trains using sigma-delta modulators or pulse-width modulators. Digital word rounding and discrete pulse quantization create short-term uncertainty in angular rate or acceleration readings.
The coefficient for quantization noise Qz is extracted at a tau integration time equal to the square root of three seconds.
Angle random walk represents high-frequency white rate noise, appearing with a slope of minus one-half. Physical sources in closed-loop gyroscopes include photon shot noise in IFOG photodetectors, thermomechanical Brownian noise in MEMS proof masses, and laser frequency jitter in ring laser gyroscopes. Angle random walk grows with the square root of integration time, setting short-term orientation integration accuracy limits.
The angle random walk coefficient N is read directly from the log-log plot at tau equal to one second.
Bias instability represents flick noise in sensor electronics and mechanical suspension elements, characterized by a flat Allan deviation curve with slope zero. Closed-loop rebalance electronics introduce low-frequency flickering in reference voltages, sensing amplifiers, and demodulation switches. Bias instability sets the absolute baseline measurement floor for sensor drift before long-term systematic errors dominate.
The bias instability parameter B is identified at the minimum point of the Allan deviation curve, scaled by a factor of 0.6648 as specified in IEEE Std 952.
Rate random walk manifests at longer tau integration times with a slope of plus one-half. Physical drivers include low-frequency environmental fluctuations, structural strain release inside sensor packages, and long-term feedback loop component aging. Rate random walk models unbounded drift accumulation over operational missions.
The rate random walk coefficient K is determined at tau equal to three seconds on the plus one-half slope line projection.
Rate ramp appears at longest integration times with a steep slope of plus one. Continuous uncompensated thermal drift, linear temperature gradients, and systematic electronic voltage reference aging generate rate ramp signatures. Rate ramp represents deterministic drift rather than pure stochastic processes, requiring deterministic polynomial compensation before stochastic modeling.
The rate ramp parameter R is measured at tau equal to the square root of two seconds on the plus one slope line.
Logarithmic Slope Region Identification
Log-log representations map Allan deviation against integration time to isolate distinct physical error mechanisms. Slope region identification requires automated line-fitting algorithms that search for contiguous data points conforming to target slopes within predefined error bounds. Overlapping noise modes cause smooth transitions rather than sharp slope breaks, distorting parameter extraction if fit windows are selected improperly.
| Identified Parameter | Standard Symbol | Log Log Slope b | Closed Loop Physical Mechanism | Evaluation Tau Point |
|---|---|---|---|---|
| Quantization Noise | Qz | -1 | Rebalance digital pulse rounding, sigma delta modulation | τ = sqrt3 s |
| Angle Random Walk | N | -1/2 | Thermomechanical Brownian noise, photodetector shot noise | τ = 1 s |
| Bias Instability | B | 0 | Flicker noise in rebalance voltage reference and amplifiers | τ = τmin |
| Rate Random Walk | K | +1/2 | Package strain relaxation, thermal gradient drift | τ = 3 s |
| Rate Ramp | R | +1 | Uncompensated environmental temperature drift, power supply drift | τ = sqrt2 s |
When closed-loop sensor data contains significant digital filtering, slope region extraction algorithm logic fails. Low-pass rebalance filters attenuate high-frequency noise, forcing short-tau Allan deviation slopes from minus one-half down to zero or even positive slopes at tau values below the filter cutoff frequency. Extraction algorithms must exclude data regions below five times the inverse loop bandwidth to prevent erroneous parameter fit results.
Overlapping Averaging Algorithms
Data utilization increases significantly when sliding sample windows process identical time-series records. Standard Allan variance calculates cluster averages from non-overlapping adjacent data blocks, causing statistical uncertainty to grow rapidly at long tau integration times where few independent clusters exist. Overlapping Allan Variance (OAVAR) shifts cluster starting points by single sample increments, drastically increasing equivalent degrees of freedom for long-tau estimates.
Calculating overlapping Allan variance requires continuous execution of sliding sum operations across time-series arrays. For a dataset containing Ns discrete samples logged at interval Δ t, the overlapping Allan variance for cluster time τ = m Δ t is computed using second differences of cumulative integrated rate angles:
σ2(τ) = frac12 m2 Δ t2 (Ns – 2m + 1) sumk=1Ns – 2m + 1 left( thηk + 2m – 2thηk + m + thηk right)2
where thηk represents integrated angle values at sample index k. Overlapping computation reduces parameter confidence interval widths at long tau values, enabling precise extraction of rate random walk and rate ramp parameters without requiring multimonth test logs.
Noise identification across closed-loop sensor outputs requires analyzing potential corruption mechanisms that corrupt visual and numerical parameter identification routines.
- Filter Rolloff Indirection occurs when closed-loop rebalance anti-aliasing filters artificially suppress short-tau variance, mimicking quantization noise attenuation or low-amplitude angle random walk.
- Limit Cycle Oscillations create localized bump peaks on Allan deviation curves at cluster times matching half the limit cycle oscillation period.
- Quantization Noise Dominance conceals physical thermomechanical white noise floors when rebalance logic operates at low bit-resolution modes.
- Thermal Hysteresis Saturation shifts flat bias instability curves into positive rate random walk slopes during uncompensated temperature sweeps.
- Correlated Rebalance Sampling introduces cross-axis noise leakage when triaxial sensors share multiplexed analog-to-digital converter reference rails.
Logarithmic slope fit regions must be bounded by statistical confidence limits to ensure extracted noise parameters accurately reflect physical stochastic processes rather than transient bench artifacts.

Distortion
Digital rebalance loops introduce discrete sampling artifacts into high-frequency angular rate readings. Closed-loop control systems execute high-rate digital rebalance logic, often operating at tens of kilohertz, to generate opposing actuator control forces. Sensor output registers decimate and filter high-rate internal control signals before delivering downsampled rate frames to host inertial navigation processors.
Demodulation switches, pulse-width modulation drivers, and internal finite impulse response filters alter intrinsic noise spectra, creating physical noise parameter distortion across short integration times.
Decimation filtering inside closed-loop sensor electronics alters Allan deviation plot shapes below tau values of one second. Downsampling algorithms eliminate high-frequency aliasing but inject phase delay and residual ripple into output data streams. When downsampling filters exhibit sharp transition bands, short-tau Allan variance curves display characteristic dip and bounce shapes.
Engineers examining these distorted plots risk misinterpreting filter ripple dips as superior angle random walk performance, underestimating true operational white noise levels.
Rebalance Pulse Width Modulation Artifacts
Binary force pulses inject high-frequency switching energy into proof mass sensing structures. Pulse-width modulated (PWM) and pulse-density modulated (PDM) rebalance schemes maintain fixed voltage amplitudes, varying pulse duty cycles or pulse density distributions to balance applied inertial loads. Fast voltage switching transients couple capacitively into sensitive pickoff amplification channels, creating high-frequency switching noise spikes.
Quantization noise in digital rebalance systems behaves differently than theoretical uniform roundoff noise. Pulse-density rebalance circuits using first-order or second-order sigma-delta modulators push quantization noise energy out of primary signal bands into high-frequency spectral regions. Pushed high-frequency quantization noise creates steep minus-one slopes on Allan deviation plots at small tau values.
Filtering must suppress this high-frequency quantization noise without introducing phase delays that distort intermediate angle random walk slope identification regions.
Why Do Closed-Loop Rebalance Filters Distort Rate Random Walk Slopes?
Phase lag across digital notch filters forces stochastic rate power into adjacent integration frequencies. Closed-loop rebalance loops employ notch filters to suppress mechanical resonance modes of sensor proof masses and structural mounting frames. Notch filters modify low-frequency noise phase distributions, spreading power across adjacent Fourier frequencies.
Spreading noise energy elevates Allan deviation points near intermediate integration times, artificially tilting flat bias instability curves into positive slope rate random walk profiles.
Raw rate logging without post-filtering preserves true physical Allan variance slope signatures required by IEEE Std 952 parameter identification protocols.
Digital filtering alter signal auto-correlation lengths in sensor output arrays. When digital low-pass filters process rate readings, consecutive samples become statistically correlated over time spans equal to filter impulse response lengths. Correlated noise structures reduce effective degrees of freedom during statistical parameter extraction.
Auto-correlation artificially reduces short-tau variance, giving false indications of low angle random walk while masking physical sensor noise floors.
Digitization Aliasing at Nyquist Limits
Unfiltered sensor signals folding across the sampling boundary create artificial low-frequency noise floors. Closed-loop sensors process physical rate inputs containing dynamic bandwidths exceeding digital sampling capabilities. Broadband mechanical vibration, structural acoustic noise, and sensor drive carrier leakage fold across Nyquist boundaries when analog-to-digital conversion occurs before adequate continuous anti-alias filtering.
Aliased high-frequency noise accumulates near zero frequency in sampled digital outputs. Folded noise energy elevates flat bias instability floors on Allan variance plots, disguising true sensor flicker noise performance. Structural vibration peaks near motor drive harmonics fold into long-tau regions, appearing as artificial rate random walk or rate ramp curves.
Anti-aliasing continuous-time filter topologies must precede high-speed rebalance sampling stages to prevent spectral folding from destroying parameter accuracy.
Executing an Allan variance test protocol requires strict control over sampling rates, environmental stability, and raw data logging modes to extract valid sensor noise parameters.
- Mount sensor test assembly onto a thermally stabilized, vibration-isolated optical bench inside an environmental chamber.
- Connect ultra-stable low-noise linear power supplies, verifying rail voltage ripple remains under fifty microvolts peak-to-peak.
- Disable internal digital post-filtering and decimation smoothing routines in sensor firmware to log raw high-rate rebalance data.
- Initialize data acquisition logging hardware synchronized to a atomic time standard or GPS-disciplined oscillator reference.
- Perform thermal soak at reference temperature for four hours to eliminate residual package thermal stress gradients.
- Log continuous un-decimated angular rate and acceleration data at maximum native rebalance sampling rate for twenty-four consecutive hours.
- Verify chamber thermal stability remains within plus or minus 0.1 degrees Celsius throughout data logging duration.
- Process raw time-series rate logs through overlapping Allan variance calculation algorithms without applying pre-smoothing filters.
- Identify logarithmic slope breakdown points, applying correction scale factors for residual filter phase delays.
Published Allan variance figures often reflect internal raw die pickoff signals recorded before digital rebalance loop filters, digital-to-analog converters, and interface firmware introduce signal chain degradation, accounting for discrepancies between datasheet parameter claims and bench verification measurements.

Matrix
System error propagation models require discrete-time noise covariance terms mapped directly from stochastic parameters. Operational inertial navigation systems employ Kalman filters to integrate sensor measurements, estimate navigation errors, and perform in-flight sensor bias corrections. Discrete Kalman filter process noise covariance matrices Qk model continuous accumulation of sensor uncertainties over time.
Correctly mapping Allan variance identified parameters into discrete process noise equations ensures Kalman filter gain values accurately reflect physical sensor performance.
Process noise parameters mapped incorrectly cause severe filter performance degradation. Underestimating angle random walk or bias instability leads to filter overconfidence, where Kalman gain matrices scale down, causing estimated state matrices to ignore real-world sensor drift. Overestimating noise values increases filter gains, rendering state estimates overly sensitive to transient measurement noise.
Parameter mapping maps physical stochastic processes into continuous spectral density parameters S, which undergo discrete-time discretization over navigation filter update intervals Δ t.

Discrete Kalman Process Noise Mapping
State estimation filters depend on accurate process noise covariance values derived from continuous time noise spectral density. Mapped Allan variance parameters convert to continuous noise spectral density terms based on standard IEEE translation relations. Parameter continuous noise power spectral density values map through discrete transition integrals to form discrete state propagation variance terms.
| Identified Parameter | Continuous Spectral Density S | Discrete Error State Model | Discrete Process Noise Covariance Qk Entry |
|---|---|---|---|
| Angle Random Walk N | SN = N2 | White Rate Noise | Qthη = N2 Δ t |
| Velocity Random Walk V | SV = V2 | White Acceleration Noise | Qv = V2 Δ t |
| Bias Instability B | Sb = frac2 B2π ln(2) | First-Order Markov Process | Qb = frac2 B2π ln(2) left(1 – e-2 Δ t / Tcright) |
| Rate Random Walk K | SK = 3 K2 | Random Walk Bias Model | Qbrw = frac13 K2 Δ t3 |
| Rate Ramp R | SR = 2 R2 | Deterministic Ramp Vector | Qramp = R2 Δ t4 |
Angle random walk N converts directly to white rate power spectral density SN = N2, generating discrete angle process noise covariance Qthη = N2 Δ t. Velocity random walk V maps similarly to velocity covariance Qv = V2 Δ t. Discrete variance terms grow linearly with step interval Δ t, reflecting classic Brownian diffusion processes inside attitude and velocity integration loops.

State Vector Augmentation Techniques
First-order Markov processes represent exponentially correlated bias errors inside state propagation differential equations. Pure flicker noise underlying bias instability B possesses infinite memory, yielding non-rational power spectral density functions that cannot be directly modeled in finite dimensional state space matrices. Kalman state augmentation approximates flicker bias instability using first-order Gauss-Markov processes characterized by driving white noise variance qGM and correlation time constant Tc.
Selecting correlation time Tc requires evaluating the flat minimum region on Allan deviation plots. Time constant Tc corresponds to the tau value at which Allan deviation reaches its absolute minimum before rate random walk curves begin rising. Continuous driving noise power spectral density SGM for the augmented bias state relates to identified bias instability parameter B through:
SGM = frac2 B2π ln(2)
The discrete process noise matrix entry for augmented bias state bk over update step Δ t assumes the closed-form expression:
Qbk = fracSGM Tc2 left( 1 – e-2 Δ t / Tc right)
Augmenting state vectors with first-order Gauss-Markov bias states enables navigation filters to track slow baseline drifts in closed-loop rebalance electronics, maintaining dynamic covariance bounds during extended global navigation satellite system (GNSS) outage conditions.
Cross-Correlation Residual Offsets
Off-diagonal elements reflect cross-axis coupling during dynamic maneuvers. Dynamic cross-axis angular rates create structural flexure deflection and cross-talk inside triaxial sensor assemblies. Closed-loop rebalance circuits sharing common reference voltages or high-speed clock lines exhibit cross-axis noise correlation.
Ignoring off-diagonal process noise terms assumes sensor channels operate completely independently. When cross-axis coupling occurs, independent single-axis error models underestimate position uncertainty growth during combined roll, pitch, and yaw dynamic maneuvers. Discrete process noise covariance matrices Qk must include non-zero off-diagonal covariance blocks Qxy, Qxz, Qyz mapped from multi-axis Allan covariance matrix extraction testing.
Selecting sensor noise parameters for discrete Kalman filter process noise matrices demands precise evaluation against structural verification criteria.
- Bandwidth Matching Verification ~ Confirm logging sample rates used during Allan variance testing match host Kalman filter discrete execution time steps Δ t.
- Temperature Sensitivity Bounding ~ Ensure rate random walk parameter K accounts for maximum expected operational thermal ramp rates experienced by sensor enclosures.
- Augmentation State Isolation ~ Verify selected Gauss-Markov time constants Tc exceed maximum GNSS update intervals to prevent filter state instability.
- Gauss-Markov Variance Scaling ~ Apply the standard IEEE scaling factor of two divided by pi times natural log of two when mapping flat bias instability parameter B into continuous driving noise density.
- Quantization Residual Accounting ~ Include residual quantization variance Qz in discrete measurement noise matrices Rk when high-rate rate integration occurs inside host navigation computers.
How do closed-loop rebalance cross-coupling terms alter non-diagonal process noise matrices when multi-axis sensor arrays experience simultaneous multi-g shock events along orthogonal axes?

Tolerance
Procurement specifications for inertial measurement units specify strict operational bounds across temperature, vibration, and aging. Closed-loop sensor vendors publish headline performance parameters on component datasheets, highlighting ideal bench performance while masking noise floor degradation occurring under real-world operational environments. System integrators and sourcing managers must establish rigorous incoming lot acceptance testing, parameter tolerance verification, and vendor specification auditing protocols to protect production yields and system field reliability.
Datasheet parameter discrepancies emerge when vendors measure Allan variance parameters under pristine laboratory environments that deviate from operational reality. Manufacturer tests routinely run with sensors mounted on massive granite isolation tables inside temperature-controlled chambers holding thermal stability within hundredths of a degree Celsius. When installed inside compact avionics chassis or industrial vehicle enclosures subjected to thermal shock, high-frequency vibration, and power supply noise, closed-loop sensors exhibit noise parameter degradation reaching an order of magnitude above published datasheet claims.

Environmental Chamber Testing Protocols
Thermal sweep chambers isolate rate sensor bias variations from room-temperature stochastic noise levels. Incoming acceptance testing requires placing sample components from incoming production lots onto multi-axis rate tables enclosed within environmental test chambers. Test sequences run Allan variance screening profiles across full operating temperature ranges, typically minus forty degrees Celsius to plus eighty-five degrees Celsius.
Thermal ramp testing evaluates residual rate random walk K and rate ramp R parameters under active temperature shifts. A sensor displaying superb bias instability under static twenty-five degree conditions may fail rate random walk limits when ambient temperature ramps at one degree Celsius per minute. Closed-loop thermal compensation tables baked into sensor EEPROM firmware must hold drift parameters within spec across full operating temperature envelopes.
Compliance with MIL-STD-810H vibration qualification protocols reveals that closed-loop optical and MEMS sensors exhibit rate random walk parameter degradation up to eight hundred percent under random vibration environments.
Vibration-induced noise corruption requires executing Allan variance logging while subjecting operating sensors to random vibration profiles. Acoustic and mechanical vibration energy feeds into closed-loop rebalance electronics, rectifying into artificial DC rate offsets through anisoelastic mechanical flexure effects and demodulation phase errors. Parameter screening must establish vibration rectification error limits to ensure navigation filters do not diverge during high-vibration launch or flight phases.
Vendor Datasheet Discrepancy Audits
Manufacturer noise specifications often reflect ideal laboratory bench conditions rather than installed sensor performance. Comparative audits between datasheet claims and incoming bench test logs frequently uncover significant discrepancies in short-tau angle random walk N and flat bias instability B. Technical procurement specifications must mandate that published Allan variance figures reflect integrated component performance with all digital rebalance loops, internal filtering, and power conditioning stages active.
Evaluating vendor testing methodologies requires auditing how raw rate logs were processed prior to parameter extraction. Vendors frequently employ heavy post-processing decimation or moving-average pre-filters that smooth raw rate data before running Allan variance algorithms. Pre-filtering suppresses high-frequency noise points, artificially lowering reported angle random walk coefficients on published datasheets.
Contracts must stipulate that Allan variance parameter verification logs utilize raw, un-filtered time-series data recorded directly at maximum internal rebalance sampling frequencies.
Yield Risk in Closed Loop Sourcing
Production line yields drop when raw sensor noise parameters fail acceptance thresholds after assembly. Sourcing closed-loop inertial sensors requires establishing multi-tiered vendor qualification programs that couple statistical process control audits at sensor wafer and assembly levels with thorough incoming parameter screening. Sole-sourcing closed-loop inertial sensors introduces extreme supply chain risk, as minor wafer fab process shifts or packaging epoxy chemistry changes can alter internal stress distributions, degrading bias instability performance across entire manufacturing lots.
Design qualification plans must incorporate secondary supply sources for critical closed-loop sensor modalities. Cross-qualifying alternate sensor suppliers requires matching physical mechanical mounting footprints, digital communication protocol timing, power supply rejection performance, and baseline Allan variance parameter bounds. Defining standardized incoming parameter screening protocols ensures alternate sensor sources integrate seamlessly into host navigation architectures without requiring recalibration of discrete Kalman filter process noise matrices.
Procurement agreements for tactical and navigation grade inertial measurement units specify that incoming lot acceptance testing shall reject entire shipment batches if more than two percent of screened units exceed an Angle Random Walk threshold of 0.015 degrees per root-hour or a Bias Instability floor of 0.05 degrees per hour when tested across the full operating temperature range under IEEE Std 952 environmental test conditions.