Wafer Level Die Attach Thermal Impedance Variance Analysis under Transient Thermal Stress
Transient thermal impedance variance in wafer-level die attach stems from micro-voiding and bondline shifts, identifiable via differential structure functions.

Pulse
Under intermittent duty cycles, semiconductor power devices generate rapid internal thermal dissipation that creates steep spatial temperature gradients across thin structural interfaces. In automotive traction inverters, power grid switches, and pulsed RF transmitters, die attach layers absorb energy fluxes exceeding several hundred watts per square millimeter over microsecond timescales. Standard steady-state thermal resistance measurements miss these transient dynamics, whereas evaluating transient thermal impedance shows localized heating before heat diffuses into the package heat sink.

Transient Thermal Dynamics in Thin Bondlines
A step-function electrical input drives high heat flux density through the silicon substrate toward the underlying attach layer, following the path of least resistance. For the first few microseconds after a power pulse, heat remains largely confined within the silicon die volume. Conduction into the die attach layer then depends strictly on the localized heat capacity and thermal conductivity of the bonding medium, governed by the one-dimensional transient heat conduction equation:
ρ · c_p · (∂T / ∂t) = ∂/∂z (k(z) · ∂T / ∂z)
Where ρ represents density, c_p is specific heat capacity, k(z) is position-dependent thermal conductivity along the vertical conduction axis z, and T is temperature at time t. In wafer-level attach layers where bondlines span five to fifty micrometers, spatial non-uniformities in k(z) alter the transient thermal response curve long before the package heat sink experiences any temperature rise. When evaluating high-power transient steps, tracking junction temperature decay isolates localized thermal resistance contributions.
Transient thermal impedance, defined as Z_th(t) = (T_j(t) – T_ref) / P_loss, shifts dynamically as heat moves across sequential material interfaces. During microsecond power pulses, the die attach layer initially acts as a capacitive heat store before transitioning into a resistive heat transfer channel. Variations in local density or chemical composition alter this response curve, revealing structural anomalies that steady-state measurements obscure entirely.

Thermal Relaxation Time Constants in Micro-Scale Attachments
Heat propagates through sub-fifty-micrometer bondlines over characteristic durations set by localized volumetric heat capacity and thermal conductivity. The thermal time constant τ of a structural layer is expressed by:
τ = R_th · C_th = (d / (k · A)) · (ρ · c_p · A · d) = (d^2 · ρ · c_p) / k
Where d represents layer thickness, A is active conduction area, R_th is thermal resistance, and C_th is thermal capacitance. For a twenty-micrometer sintered silver die attach layer, the characteristic thermal time constant typically falls between fifty microseconds and two milliseconds. For polymeric adhesives, lower thermal conductivity stretches τ into the tens of milliseconds.
A 100-microsecond transient power pulse of 150 watts applied to a 20-square-millimeter SiC die reveals an initial thermal impedance offset of 0.04 K/W when bondline thickness varies by 5 micrometers.
Variations in bondline thickness across a single wafer generate a proportional distribution of thermal time constants. Regions that are too thick delay heat transfer, forcing the active silicon junction to operate at elevated transient temperatures during power spikes and driving localized micro-cracking and parametric drift.
Microsecond thermal spikes produce localized temperature gradients across thin bondlines rather than dispersing harmlessly into the silicon die bulk.

Interface
Wafer-level assembly processes deposit metallic or polymeric bonding layers to connect active silicon die to direct bonded copper substrates. Heat dissipation and mechanical stability both rely on the structural integrity of this bondline. However, manufacturing variations during wafer-scale printing, dispensing, and thermo-compression sintering cause localized differences in material density, bondline thickness, and void distributions across individual die positions.
Microstructural Metallurgy of Sintered and Eutectic Materials
Pressureless and pressure-assisted silver formulations consolidate through solid-state diffusion, forming porous metallic matrices with effective conduction values ranging from fifty to two hundred watts per meter-kelvin. Microstructural evolution during sintering relies on neck formation between sub-micron silver particles. If compaction pressure or thermal fields vary during wafer processing, the resulting density distribution across the die area becomes uneven.
Eutectic gold-tin (Au80Sn20) attachments offer high mechanical strength and thermal conductivity near fifty-seven watts per meter-kelvin. Solidification of AuSn eutectic melt forms complex intermetallic phases, primarily Au5Sn and AuSn phases. Thermal gradient shifts during rapid cooling produce phase segregation and localized stress concentrations that alter transient heat conduction.
Transient liquid phase bonding (TLPB), utilizing copper-tin or nickel-tin systems, converts low-melting-point elements into high-melting-point intermetallic compounds. TLPB layers exhibit microstructural porosity if liquid-state reaction times remain incomplete. The presence of unreacted tin phases creates localized thermal bottlenecks that degrade transient heat dissipation performance.

Void Morphology and Bondline Thickness Variations
Entrapped micro-cavities and structural non-uniformities compress heat flow pathways, raising localized thermal resistance. These micro-voids originate from outgassing organic vehicles in paste formulations, solvent entrapment during wafer-level printing, or incomplete wetting along substrate metallization layers. Void morphology dictates the severity of transient thermal impedance variance: isolated spherical micro-voids bend heat streamlines with minimal impedance impact, whereas planar macro-voids or contiguous edge voiding severely restrict effective conduction area.
Even with high-conductivity sintered silver, micro-voiding degrades heat transfer rates. Bondline thickness variation across a six-inch or eight-inch wafer arises from assembly tool tilt, non-uniform paste deposition, or clamping pressure gradients during batch curing. A five-micrometer variation on a fifteen-micrometer nominal bondline alters localized thermal resistance by over thirty percent.
- Micro-void Clustering ~ Trapped volatile organics during low-temperature burnout leave contiguous gas pockets that block vertical heat conduction across active switching areas.
- Bondline Thickness Non-uniformity ~ Wafer tilting during die placement creates sub-ten-micrometer gradients across large die areas, driving uneven thermal relaxation times.
- Sintering Grain Boundary Resistance ~ Insufficient densification leaves high surface area boundaries that scatter phonons and reduce bulk thermal conductivity.
- Intermetallic Compound Growth ~ Formation of brittle binary phases at solder boundaries introduces localized thermal barriers that degrade under repeated power shocks.
| Attach Material Type | Bulk Thermal Conductivity (W/m·K) | Volumetric Heat Capacity (J/cm³·K) | Baseline Z_th Variance (%) | Elastic Modulus (GPa) | CTE Mismatch with Si (ppm/K) |
|---|---|---|---|---|---|
| Sintered Silver Paste (Pressureless) | 120 – 160 | 2.45 | ± 12.5 | 40 – 55 | 16.5 |
| Sintered Silver Film (Pressure-Assisted) | 180 – 240 | 2.60 | ± 4.2 | 60 – 75 | 16.5 |
| Au80Sn20 Eutectic Preform | 57 | 2.98 | ± 3.8 | 68 | 13.4 |
| Transient Liquid Phase (Cu-Sn TLPB) | 35 – 50 | 3.10 | ± 8.5 | 85 | 14.0 |
| SAC305 Lead-Free Solder | 33 | 2.32 | ± 9.0 | 48 | 18.5 |
| Thermal Conductive Epoxy (70% Ag filler) | 3.5 – 7.0 | 1.85 | ± 18.0 | 8 – 12 | 35.0 |
Evaluating total thermal variance across a production lot requires measuring both volumetric macro-defects and boundary thermal contact resistances. Sub-micrometer delamination along substrate interfaces introduces an additional thermal boundary resistance R_tbc that elevates transient impedance without appearing as visible voiding under low-resolution inspection systems.
Uncontrolled variance in sintered layer density drives localized heat accumulation during high-power operation, accelerating die cracking and triggering field reliability claims.

Impedance
Transient temperature measurements recorded during power step excitation contain complete spatial thermal capacitance and resistance distributions along the heat flow trajectory. Analyzing these transient thermal impedance response curves requires mathematical transformation from the time domain into spatial structure functions. According to standard JESD51-14 methodologies, deconvolving heating or cooling curves isolates individual thermal stages between the semiconductor junction and the external cooling environment.

Structure Function Mathematical Transformation
Deconvolution of the normalized thermal step response yields a continuous relaxation time spectrum through inverse Laplace operations. The normalized thermal step response a(t) relates to the continuous time constant spectrum I(τ) by:
a(t) = ∫_0^∞ I(τ) · d(ln τ)
Discretizing the time constant spectrum generates an equivalent Foster RC ladder network. Because Foster network parameters lack direct physical correlation to specific material layers, converting the Foster network into a mathematically equivalent Cauer network yields a physical RC ladder representation where each stage corresponds directly to an actual material layer along the thermal path.
Structure functions expose internal layer interfaces. Cumulative structure functions plot cumulative thermal capacitance C_th against cumulative thermal resistance R_th moving outward from junction to ambient. Differential structure functions, defined as K(R_th) = dC_th / dR_th, display distinct peaks corresponding to structural interfaces.
Peak positions and amplitudes shift when structural variations alter localized layer parameters.
- Apply a constant heating current to the semiconductor device until thermal equilibrium establishes across the junction and cooling fixture.
- Switch the drive current to a low calibration sensing level within one microsecond to initiate the transient cooling curve recording.
- Capture the forward voltage drop across the internal diode junction at high sampling frequency to record the temperature decay over time.
- Convert the measured voltage transient into a temperature response curve using the pre-calibrated temperature sensitive parameter coefficient.
- Deconvolve the normalized thermal step response to calculate the continuous thermal time constant spectrum.
- Transform the continuous time spectrum into a discretized Foster thermal RC ladder network.
- Convert the Foster network into a mathematically equivalent Cauer network representing physical structural layers from die junction to ambient.
- Differentiate cumulative thermal capacity with respect to cumulative thermal resistance to plot the differential structure function curve.

Which Thermal Shift Signifies Interfacial Delamination?
Peaks appearing within the differential capacity curve move along the resistance axis when mechanical separation occurs at the metallic substrate boundary. In a defect-free die attach assembly, the differential structure function peak corresponding to the attach layer appears at a precise cumulative resistance value R_th_attach. When micro-voiding or delamination degrades the interface, the active conduction area decreases, shifting the differential peak to a higher resistance coordinate along the horizontal axis.
Compliance with JESD51-14 mandates that structural divergence between dry and wet thermal interface measurements marks the exact boundary of the die attach layer.
During differential structure function analysis, a 0.07 K/W impedance shift occurs when bondline voiding exceeds five percent. Tracking peak coordinate movements across transient power cycling regimes quantifies structural degradation before complete mechanical debonding occurs.
| Observed Peak Shift Pattern | Physical Root Cause | Delta R_th Range (K/W) | Delta C_th Range (J/K) | Reliability Risk Profile |
|---|---|---|---|---|
| Horizontal Shift to Right (Higher R_th) | Uniform voiding or reduced bondline area | +0.05 to +0.18 | Minimal change | Elevated junction operating temperature |
| Vertical Compression (Lower Capacity Peak) | Interfacial delamination along die edge | +0.02 to +0.08 | -15% to -35% | Localized hot spot thermal runaway |
| Horizontal Shift to Left (Lower R_th) | Sub-nominal bondline thickness (squeeze-out) | -0.03 to -0.09 | Minimal change | Increased thermo-mechanical shear stress |
| Multi-peak Broadening | Non-uniform density in sintered silver matrix | +0.04 to +0.12 | Broadened band | Cyclic thermal fatigue acceleration |
Extracting accurate structure functions demands precise temperature-sensitive parameter (TSEP) calibration and high-speed data acquisition equipment capable of recording sub-millivolt voltage changes within microsecond intervals. Measurement noise or electrical switching transients can corrupt early-time data, producing phantom structure function peaks that mimic interface defects.
The practical question remains whether automated line testing can compute differential structure functions rapidly enough to identify sub-micron void clusters prior to final mold encapsulation.


Fatigue
Repeated power pulses impose localized thermo-mechanical strain waves across heterogeneous metallic and semiconductor layers. Differences in coefficient of thermal expansion (CTE) between the silicon die (2.6 ppm/K), silicon carbide die (4.0 ppm/K), and copper heat spreader (16.5 ppm/K) drive cyclic shear strain within the intervening die attach layer during power cycling.

Thermo-Mechanical Strain under High-Frequency Power Cycling
Differential thermal expansion between silicon die and ceramic substrates generates intense shear forces at the interconnect interface during rapid switching events. Fast transient heating pulses induce sharp spatial thermal gradients across the attach thickness before thermal equilibrium develops. The instantaneous thermal stress σ_transient generated during a power pulse is calculated via:
σ_transient = (E_attach · α · ΔT_transient) / (1 – ν_attach)
Where α represents CTE, ΔT_transient is the transient temperature differential across the joint, E_attach is elastic modulus, and ν_attach is Poisson’s ratio. Unlike slow environmental thermal cycling, high-frequency transient power cycling concentrates plastic deformation along the thin attach layer while substrate temperatures remain relatively stable.
Accumulated plastic strain during repetitive power pulsing initiates micro-void coalescence along grain boundaries. As micro-voids merge, micro-cracks propagate inward from die corners where shear strain reaches maximum magnitude, causing thermal resistance to climb.

Crack Nucleation and Interfacial Creep Degradation
Continuous operational stresses induce dislocation movement within metallic die attach matrices, triggering micro-void growth along grain boundaries. Creep strain accumulation follows the Anand viscoplastic constitutive model, incorporating strain hardening and thermal recovery mechanics. Under transient pulsing, elevated temperature spikes accelerate creep rates exponentially:
dε_creep / dt = A · exp(-Q / (R · T_j(t))) · σ_eff^n
Where A is a material constant, Q is activation energy, R is the universal gas constant, T_j(t) is instantaneous transient junction temperature, σ_eff is effective von Mises stress, and n is the stress exponent. Higher local temperatures during transient spikes increase creep rates, turning microstructural dislocations into propagating interfacial fatigue cracks.
Higher sintering pressure reduces thermal impedance variance more effectively than increasing heating duration during wafer-level attach.
Crack propagation reduces active heat conduction area, altering transient thermal impedance curves. Initial degradation manifests as subtle shifts in the differential structure function peak, progressing toward non-linear impedance expansion as crack coverage exceeds twenty percent of total joint area.
- Elastic Modulus Matching ~ Lower modulus sintered pastes absorb thermal mismatch displacement without transmitting critical shear stress into active silicon layers.
- Homogeneous Microstructure ~ High-density silver matrices prevent localized stress concentrations that initiate premature shear fractures under fast power pulsing.
- High Homologous Temperature Resistance ~ Materials maintaining structural stability near melting points limit plastic creep accumulation during extreme power transients.
- Thermal Expansion Compatibility ~ Interconnect alloys engineered with intermediate thermal expansion coefficients reduce accumulated plastic work per thermal cycle.
When power pulsing causes measurable thermal resistance growth within early burn-in cycles, mechanical joint degradation dominates over silicon lattice aging.

Probe
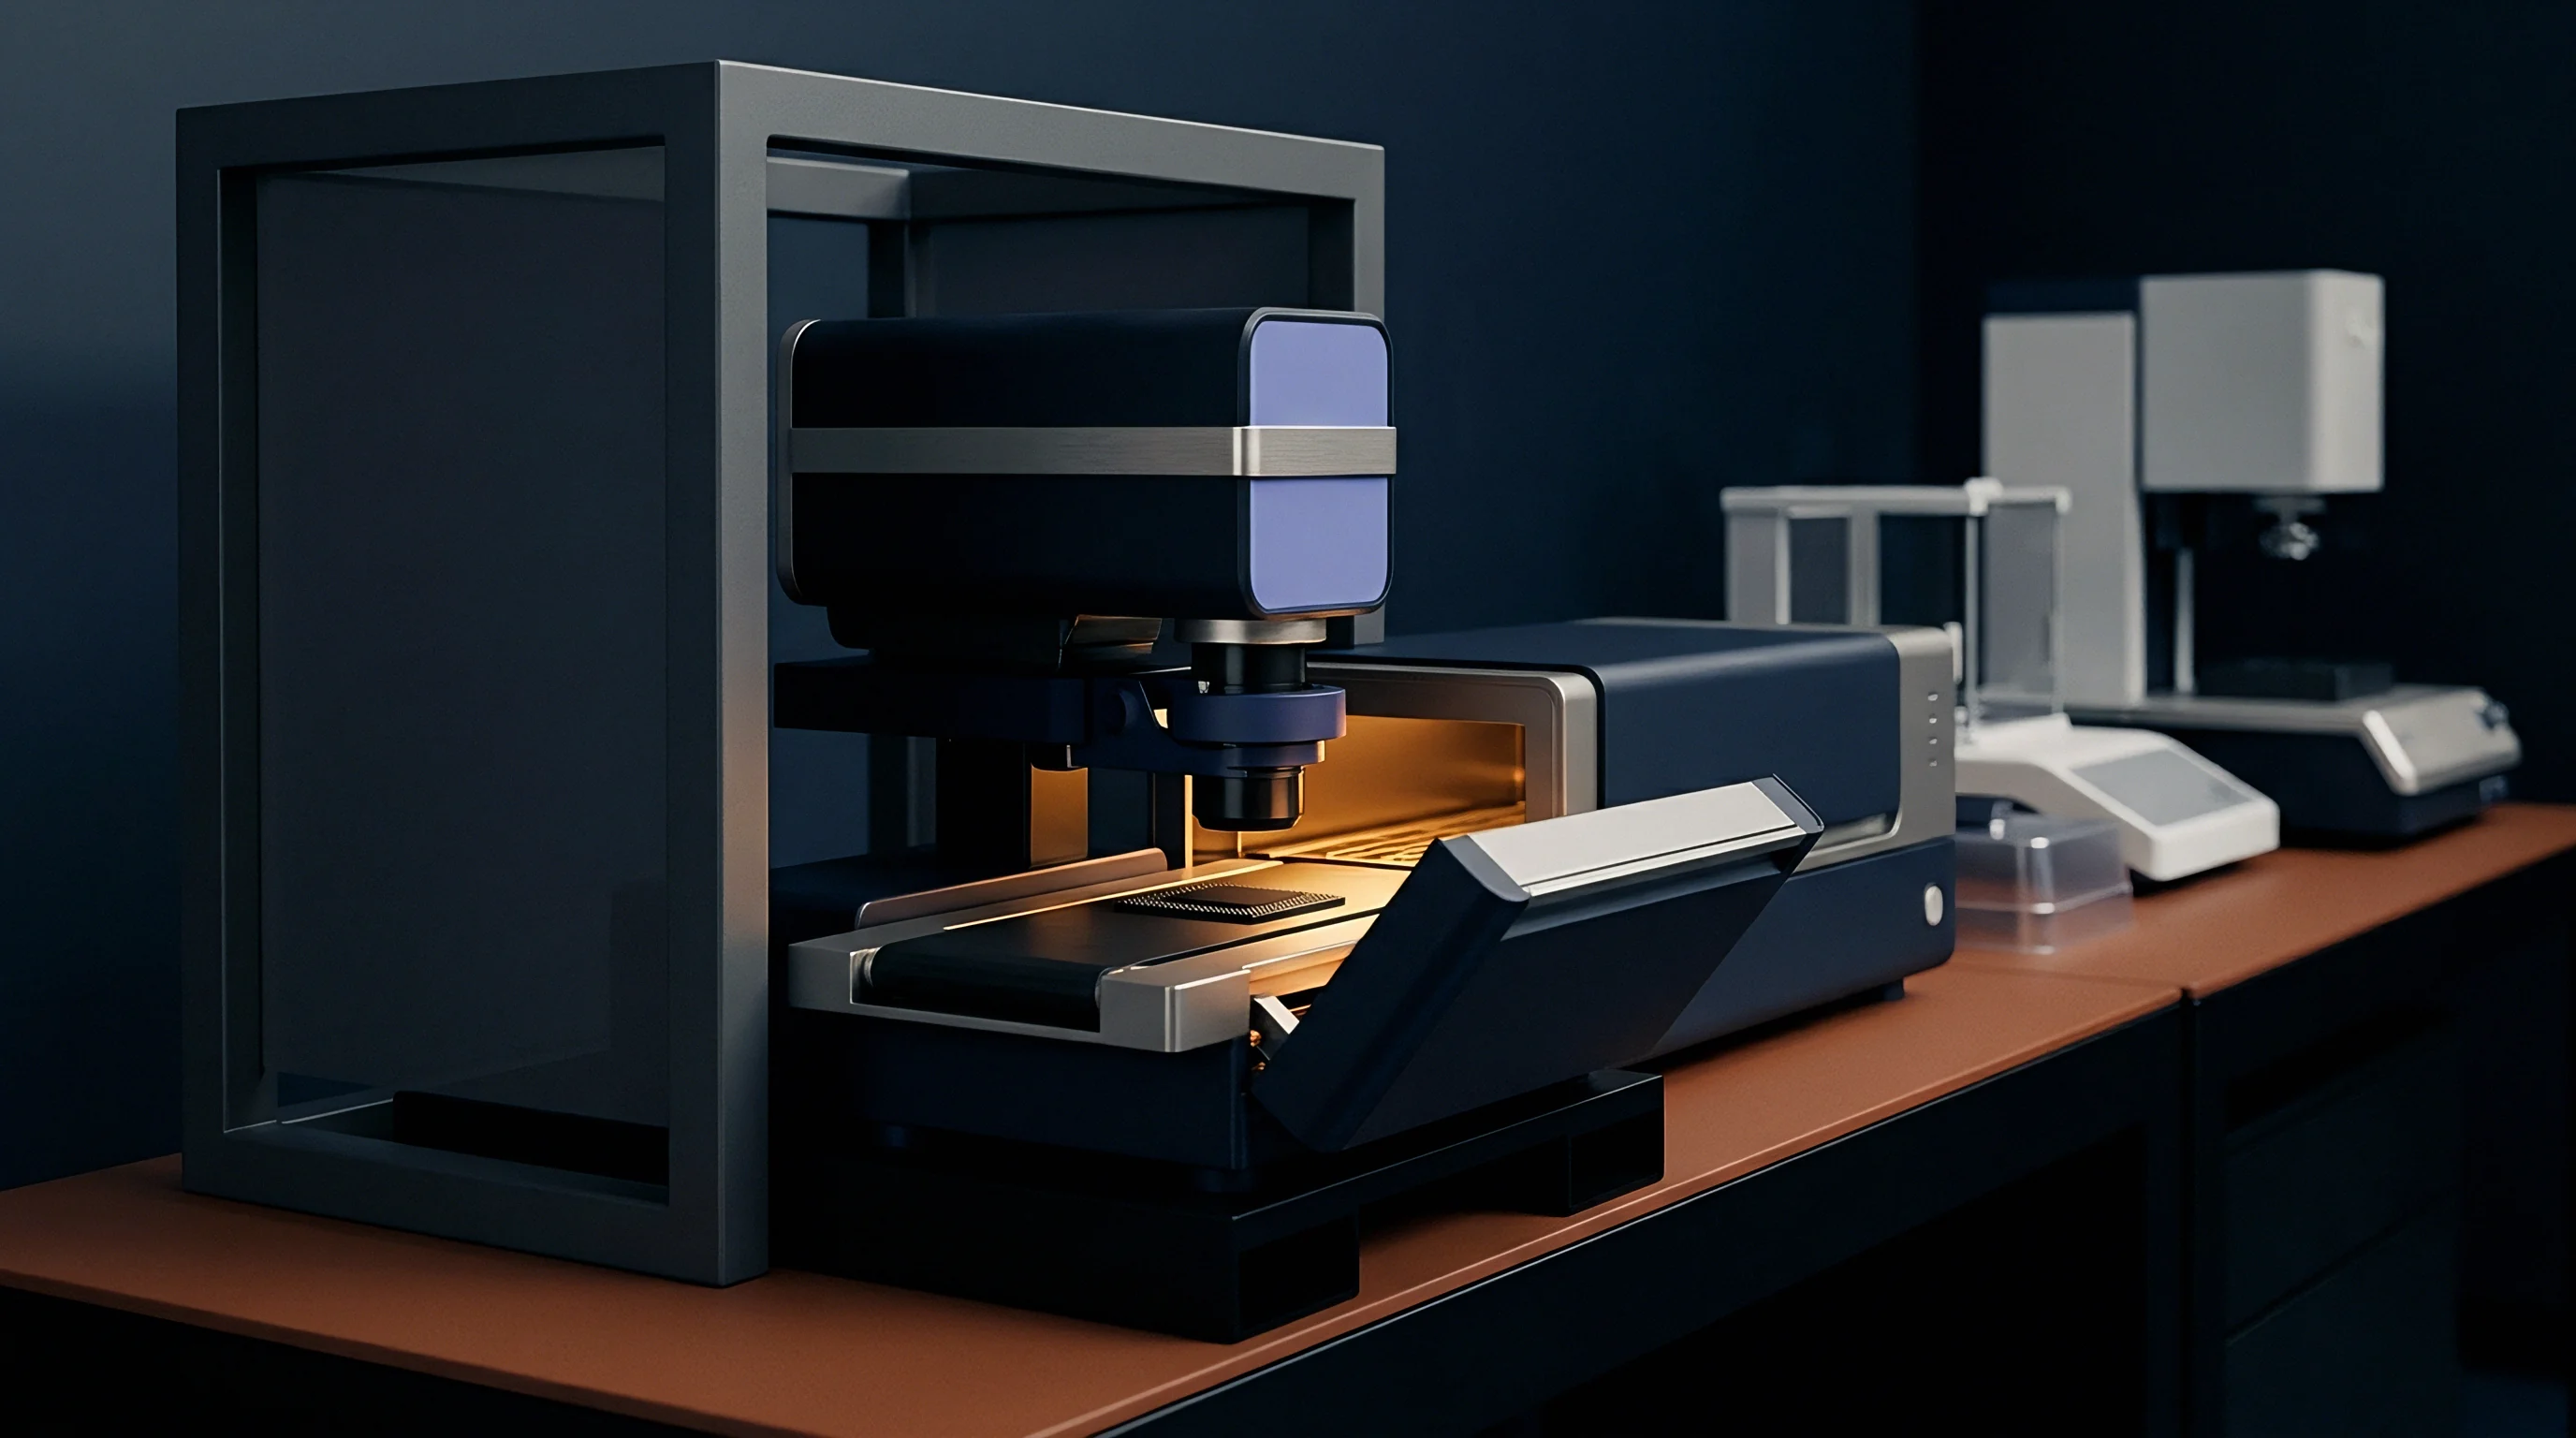
Non-destructive characterization technologies enable precise identification of microstructural defects without compromising device integrity. Assessing thermal impedance variance requires combining high-speed transient electrical testing with high-resolution acoustic imaging and X-ray inspection methods to correlate structural anomalies with thermal degradation metrics.

Dual-Interface Transient Thermal Measurement Protocols
Applying two distinct thermal contact conditions at the package base separates die attach thermal resistance from external heat sink impedance. Standardized under JESD51-14, the dual-interface method records transient cooling curves with the package mounted directly to a temperature-controlled cold plate using thermal grease, followed by a second measurement using a dry contact interface or thin insulating pad.
High-speed sampling prevents early thermal measurement errors. The point where the two cumulative structure function curves diverge represents the physical geometric interface between package base plate and external cooling medium. Subtracting junction-to-case resistance R_th_jc established via dual-interface testing isolates structural die attach resistance from external setup variables, enabling direct comparative analysis of production lot variance.

High-Speed Temperature Sensitive Parameter Measurement
Precision constant-current source units inject sub-milliampere sensing currents to track diode forward voltage drops with microsecond time resolution. Calibrating temperature sensitive parameters (TSEP) involves placing devices inside isothermal fluid baths across controlled temperature steps; in bench evaluations of fast switching transients, calibrating temperature sensitive parameter coefficients across controlled temperature baths yields precise baseline curves.
The linear voltage-temperature relation, V_forward(T) = V_0 + K_tsep · T, yields calibration slope factors K_tsep typically ranging between -1.2 mV/K and -2.5 mV/K for silicon PN junctions and silicon carbide body diodes. Maintaining sub-microsecond current switching speeds during transient testing prevents electrical switching artifacts from corrupting early-time thermal impedance calculations.
| Inspection Modality | Spatial Resolution (µm) | Measurement Speed per Die | Sub-micron Void Sensitivity | Inline Integration Feasibility |
|---|---|---|---|---|
| Transient Electrical TSEP (JESD51-14) | N/A (Lumped Area) | 100 ms – 2 s | Indirect (via Z_th shift) | High (Electrical Probe Station) |
| C-Mode Scanning Acoustic Microscopy (CSAM) | 5 – 15 | 30 s – 3 min | High (Acoustic Reflection) | Low (Off-line / Water Immersion) |
| X-Ray Micro-Computed Tomography (µCT) | 1 – 3 | 5 min – 45 min | Very High (3D Volumetric) | Offline Audit Only |
| Thermal Wave Radiometry (Photothermal) | 20 – 50 | 500 ms – 5 s | Moderate (Surface Radiance) | Moderate (Non-contact Optical) |
Acoustic inspection identifies sub-micron voids. Combining off-line C-SAM imaging with automated inline transient electrical probing establishes statistical baseline correlation models, connecting visual defect percentages directly to transient thermal impedance shift thresholds.
Adopting the JESD51-14 separation point criterion within procurement agreements places failure liability on the supplier whenever transient thermal response curves exceed the specified tolerance corridor.


Control
Quality engineering teams set rigorous manufacturing tolerances to constrain thermal impedance variance across multi-wafer manufacturing lots. Establishing control over wafer-level die attach requires optimizing print deposit uniformity, regulating atmosphere gas composition during reflow or sintering, and implementing automated transient screening at wafer probe stations.

Process Window Specifications for Wafer-Level Attach
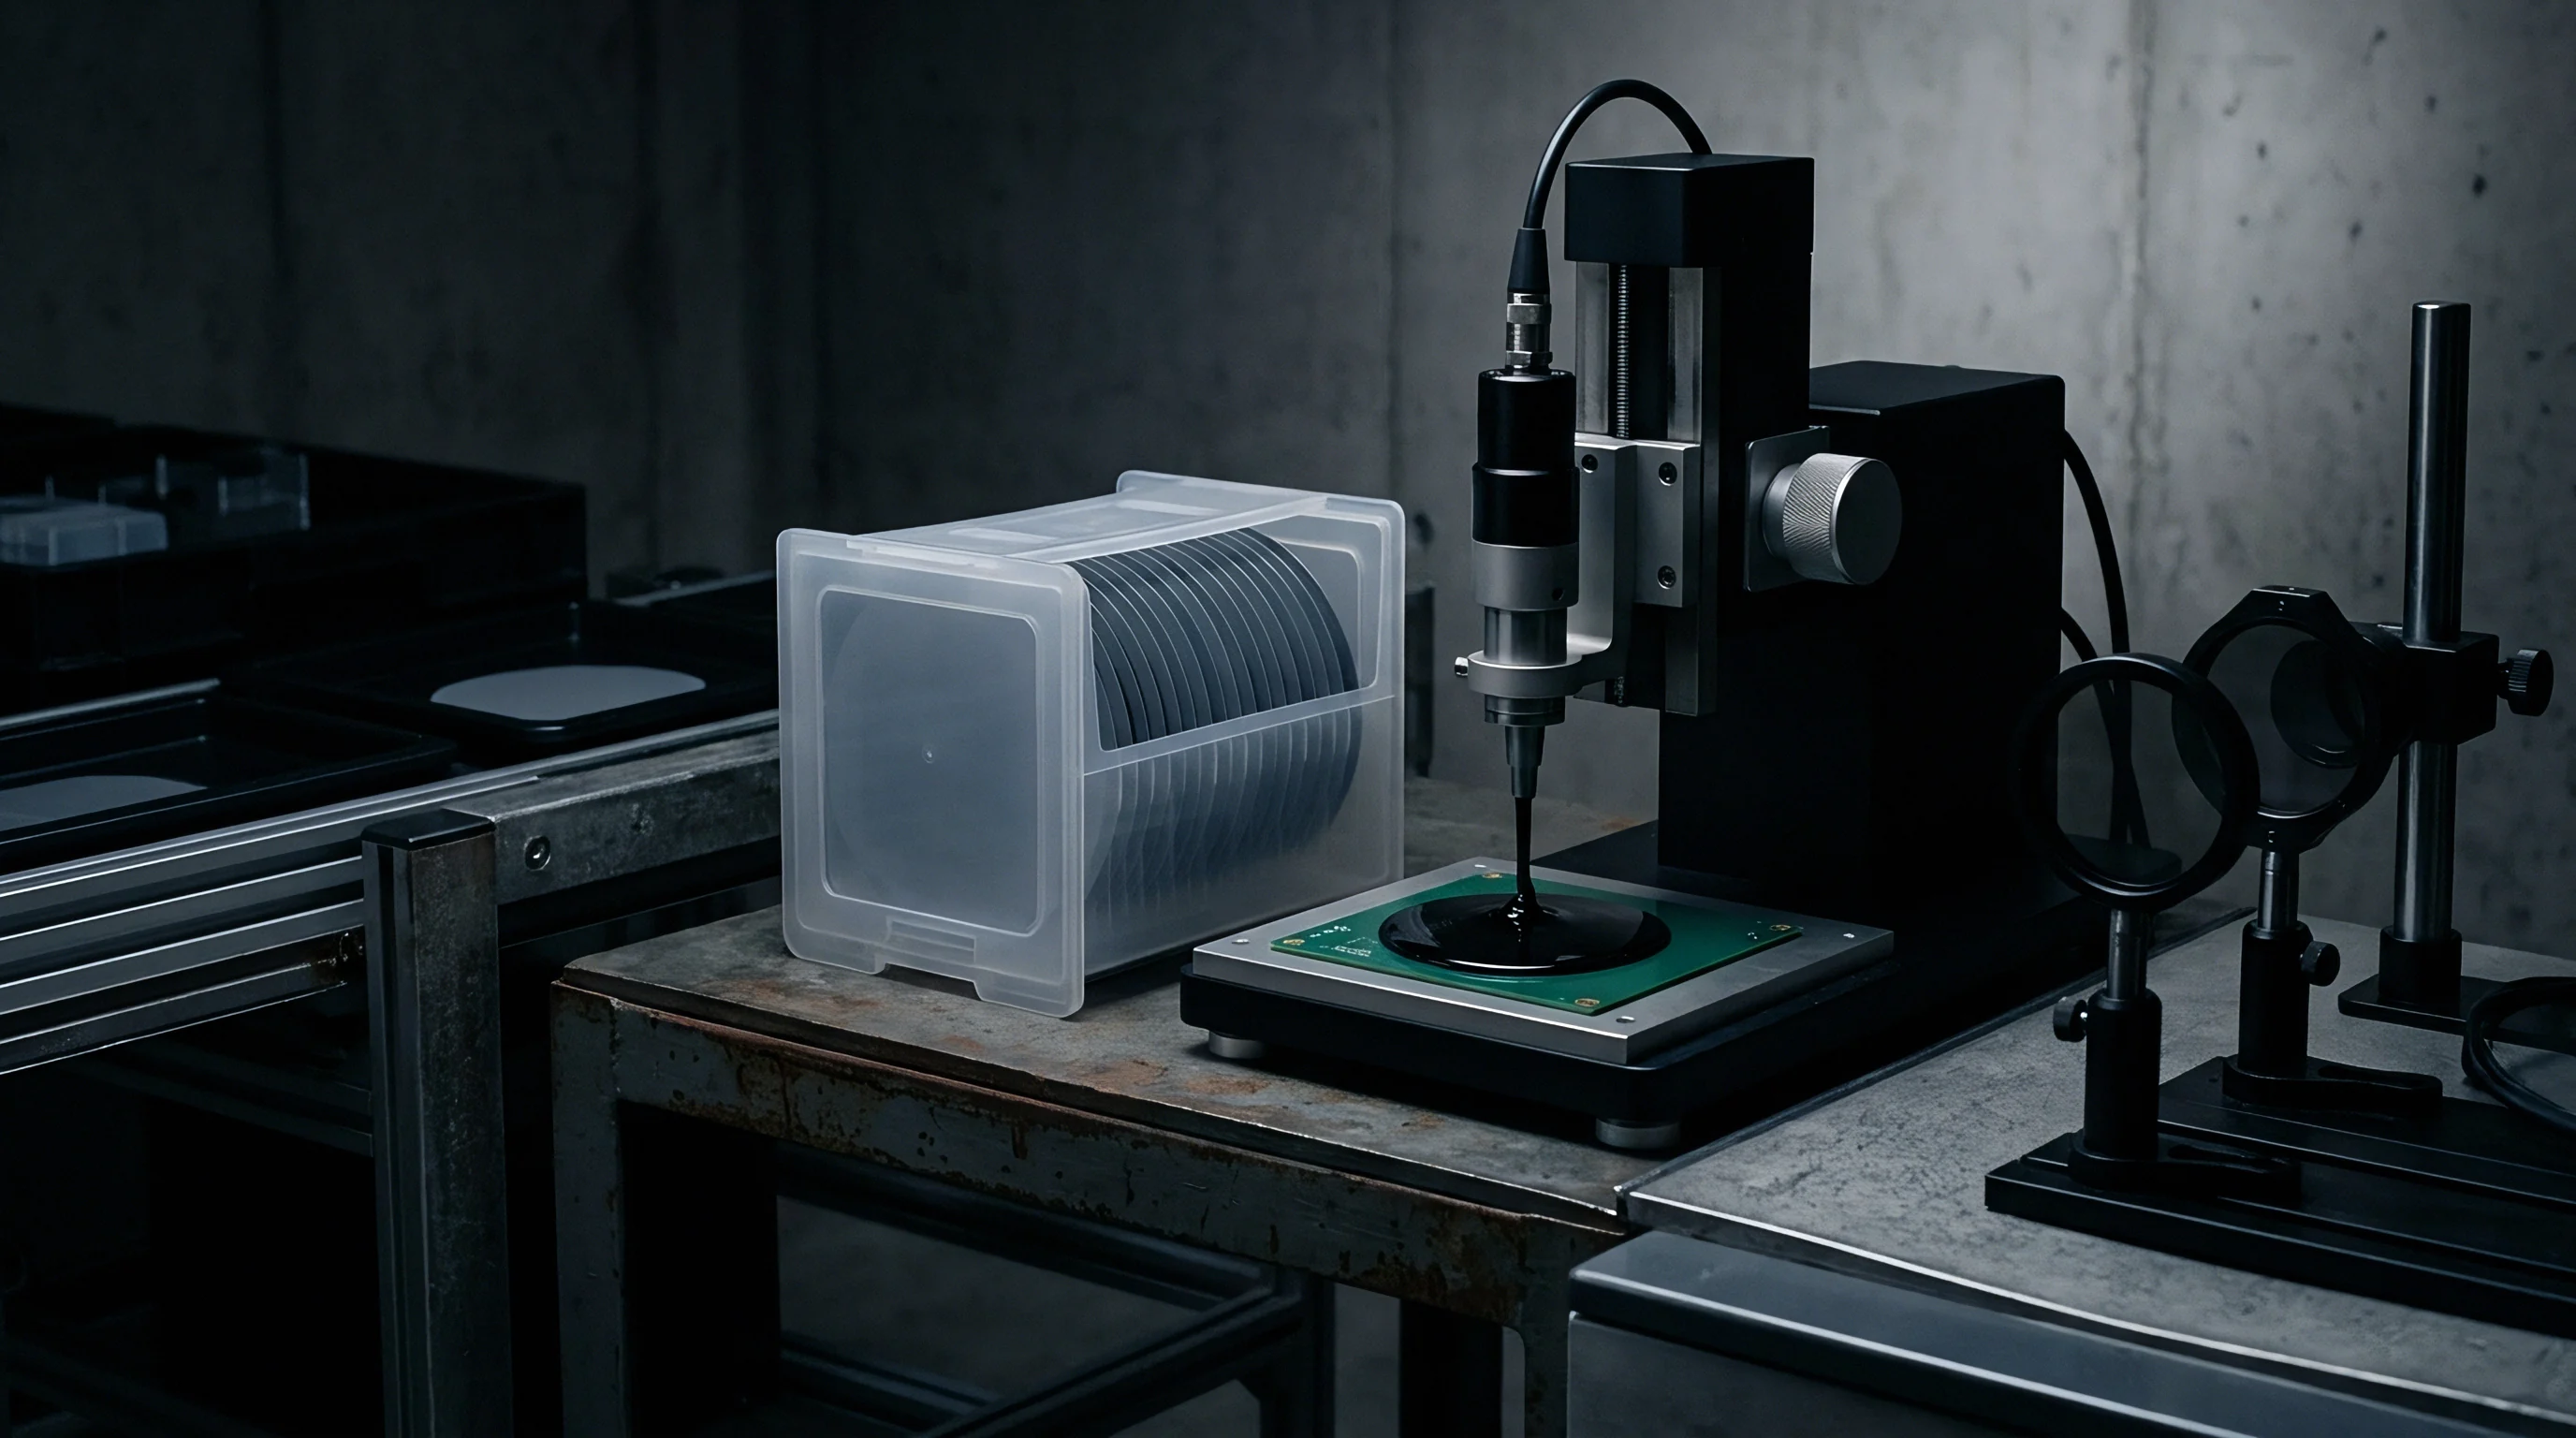
Optimizing sintering temperature profiles, compaction pressures, and atmosphere purity prevents premature bond degradation. Sintering pressure dictates final matrix density: pressure-assisted sintered silver processes require uniform mechanical force application across the entire wafer surface during thermal curing, as localized pressure drops induce low-density matrix zones that elevate thermal impedance variance.
Void coalescence under cyclic thermal stress alters transient heat paths long before steady-state thermal resistance exhibits detectable drift.
Managing oxygen concentration below twenty parts per million during high-temperature processing prevents oxidation of substrate metallization layers. Nitrogen atmosphere purges preserve wetting kinetics in eutectic soldering and facilitate pure solid-state metallic bonding in sintered silver paste formulations.
Sourcing Dossiers and Thermal Variance Screening Metrics
Commercial supply contracts incorporate transient thermal impedance limits alongside traditional steady-state resistance benchmarks to safeguard module reliability. When reviewing supplier qualification dossiers, requiring transient impedance distribution curves across full wafer production batches ensures batch-wide thermal stability.
Procurement specifications mandate six-sigma limits on thermal impedance metrics taken at key microsecond time marks, specifically Z_th(100µs) and Z_th(1ms). Specifying maximum allowable variance windows on differential structure function peak locations ensures that incoming production lots display consistent bondline density and structural integrity.
Engineers preserve thermal margins across wafer-level die attach assemblies by enforcing tight sintering pressure windows, auditing raw paste powder distributions, and applying strict transient thermal acceptance limits to every production wafer.