Temperature Coefficient Compensation in Doped Boron Piezoresistive Elements
Boron piezoresistive compensation balances positive resistance shifts against negative gauge factor decline via tailored current circuits or ASIC polynomials.


Lattice
Boron atoms substitutional to crystalline silicon generate mobile holes in the valence band, establishing the p-type conduction path where strain alters the underlying band structure. When applied stress lifts the degeneracy between the heavy-hole and light-hole bands, carrier populations redistribute into states with distinctly different effective masses and relaxation times. This strain-induced shift in electrical resistivity provides the transduction mechanism exploited in micro-electro-mechanical pressure sensors.
Along the crystallographic direction of a (100) silicon wafer, the longitudinal piezoresistive coefficient reaches peak strain sensitivity for p-type elements, measuring roughly 138 × 10-11 Pa-1 at room temperature in lightly doped material. Raising the temperature degrades this response: thermal energy broadens the carrier Fermi-Dirac distribution, diminishing net hole transfer between split sub-bands at any given strain and eroding piezoresistive sensitivity across the operational range.
A boron doping level of 1 × 1018 cm-3 yields a negative sensitivity temperature coefficient of -2100 parts per million per kelvin between -40 and 125 degrees Celsius.

Piezoresistive Mechanics across Doping Densities
Doping concentration governs both initial sheet resistivity and the thermal stability of the gauge factor. Below 1 × 1018 cm-3, the piezoresistive factor hovers near unity, providing strong mechanical sensitivity at the expense of high thermal drift. Pushing boron concentrations toward the degenerate boundary forces the Fermi level into the valence band; this carrier saturation shields the sub-band redistribution mechanism from thermal agitation, which stabilizes sensitivity across temperature but cuts into the sensor’s raw span.
Foundries typically set the junction depth through ion implantation paired with high-temperature drive-in cycles. Shallow junctions with elevated surface doping leave steep concentration gradients that cause erratic localized thermal behavior, whereas deeper, more uniform profiles produce consistent temperature coefficients across a wafer. Increasing the boron dose from 1 × 1018 cm-3 to 1 × 1019 cm-3 drops the piezoresistive gauge factor by nearly a quarter, but cuts its temperature coefficient by more than half.
| Boron Concentration (cm-3) | Sheet Resistance (Ω/sq) | Piezoresistive Coefficient π44 (10-11 Pa-1) | Temperature Coefficient of Resistance (ppm/K) | Temperature Coefficient of Gauge Factor (ppm/K) |
|---|---|---|---|---|
| 5 × 10¹⁷ | 380 | 120 | +1100 | -2700 |
| 1 × 10¹⁸ | 210 | 105 | +1450 | -2200 |
| 5 × 10¹⁸ | 85 | 78 | +1900 | -1650 |
| 1 × 10¹⁹ | 45 | 58 | +2300 | -1200 |
| 5 × 10¹⁹ | 18 | 32 | +1700 | -650 |
| 1 × 10²⁰ | 9 | 18 | +950 | -250 |

Opposing Coefficients in P-Type Conduction
Acoustic phonon scattering reduces charge carrier mobility as thermal excitation rises. Between 200 Kelvin and 450 Kelvin, lattice vibrations scatter holes at a rate scaling with temperature to the power of 1.5 to 2.3, depending on background ionized impurity levels. This loss in mobility increases bulk silicon resistivity, resulting in a distinctly positive temperature coefficient of resistance.
Piezoresistive sensitivity simultaneously carries a negative temperature coefficient. Thermal broadening of the Fermi distribution ensures that mechanical strain produces progressively smaller fractional changes in conductivity as heat increases. While resistance climbs, sensitivity degrades; however, because the positive resistance coefficient and negative gauge factor coefficient follow different mathematical functions, they fail to cancel each other out cleanly in basic bridge circuits.
Mobility Degradation and Gauge Factor Suppression
Across the extrinsic operating regime, piezoresistive response trends downward against temperature. Acoustic lattice scattering outweighs ionized impurity scattering in moderately doped p-type regions, depressing mobility. As differential pressure flexes the silicon diaphragm, the induced stress tensor distorts the conductivity ellipsoid, but at elevated temperatures, background thermal energy approaches the sub-band splitting energy, blunting the anisotropy of the piezoresistive tensor.
This rate of degradation is tracked by the piezoresistive temperature factor, a metric that curves non-linearly over wide spans ~ sloping steeply below freezing and moderating above 100 degrees Celsius. Accommodating this curvature against shifting bridge resistance forms the main challenge in signal conditioning. Light doping leaves the sensor vulnerable to steep sensitivity roll-off, whereas heavier degenerate doping preserves span stability at the expense of millivolt output.
Concentrated boron implants flatten the thermal sensitivity curve, though the trade-off is a permanently diminished baseline signal.


Offset
Any resistance imbalance across the four arms of a Wheatstone bridge produces an offset voltage at zero differential pressure. Under ideal conditions, four identical boron-doped piezoresistors track each other through thermal excursions to maintain a null output. In practice, micromachining variations introduce slight geometric asymmetries, local crystallographic defects, and dopant gradients across the individual arms.
These structural discrepancies split the individual temperature coefficients of resistance. A divergence of just 0.1 percent in temperature coefficient between adjacent arms creates a baseline drift indistinguishable from applied pressure. Across an industrial window of -40 to 125 degrees Celsius, this thermal zero shift regularly outstrips the full-scale span shift, obscuring low-pressure readings beneath a wandering baseline.

Thermal Zero Shift Originating in Die Stress
Mismatched package materials load the silicon diaphragm with extraneous mechanical stress during thermal cycling. Silicon has a thermal expansion coefficient around 2.6 × 10⁻⁶ K-1 at room temperature. While Pyrex 7740 constraint bases track this relatively closely at 3.2 × 10⁻⁶ K-1, ceramic headers, kovar mounts, and elastomeric die-attach adhesives introduce much wider expansion disparities.
As assemblies cool from adhesive or frit cure temperatures, contraction differences lock residual compressive or tensile stress into the diaphragm. Because piezoresistors are etched along edge boundaries to maximize pressure sensitivity, these mounting stresses couple directly into the piezoresistive tensor. Uneven adhesive thickness or voiding in the bond line produces an asymmetric stress field across the bridge that warps as ambient temperatures swing, driving severe zero-offset wander.
Diaphragm stress induced by packaging mismatch generates zero shifts that mimic mechanical pressure.

Dopant Gradient Asymmetries across Bridge Arms
Beam non-uniformities during ion implantation leave subtle sheet resistance differences between adjacent traces. Whether an implanter relies on electrostatic rastering or mechanical platen translation, minor beam incidence variations and photoresist shadowing introduce doping offsets between orthogonal and parallel resistor pairs.
Annealing cycles intended to activate dopants and mend lattice damage often worsen these imbalances. Thermal gradients inside the furnace tube cause localized variations in dopant solubility and diffusion depth, leaving resistors with divergent baseline values and mismatched temperature coefficients. Furthermore, slight lithographic misalignments relative to the wafer crystal axes cause the bridge arms to couple unevenly to mechanical strain.

Packaging Hysteresis and Long-Term Zero Wandering
Glass frit seals and elastomeric adhesives relax viscoelastically under continuous thermal cycling. Over repeat excursions between -40 and 125 degrees Celsius, structural packaging materials creep, storing and shedding strain through hysteretic paths. Consequently, a sensor’s zero-pressure balance at 25 degrees Celsius often shifts depending on whether it cooled down from high temperature or warmed up from a freeze.
These recurring thermomechanical stress cycles lead to systemic failure mechanisms in uncompensated assemblies:
- Interfacial delamination spreads across die-attach boundaries, triggering abrupt baseline steps during thermal transitions.
- Passivation dielectric stress relaxation shifts underlying surface state charges, producing slow, permanent baseline drift over months of field operation.
- Bond wire heel fatigue introduces parasitic resistance imbalances into individual bridge arms, degrading common-mode rejection.
- Silicon diaphragm micro-yielding develops at stress concentrations near diaphragm corners, permanently altering bridge balance after thermal shock.
Left unaddressed, packaging hysteresis can push zero-point drift past the total allowable error budget within six months of field deployment.

Shunt
Bypass resistors divert a portion of excitation current from the active bridge arms to stabilize sensitivity over temperature. This analog approach leverages the opposing polarities of the temperature coefficient of resistance and the gauge factor. With a properly arranged passive network, the upward thermal drift of bridge resistance offsets the natural drop in piezoresistive sensitivity.
Passive compensation avoids placing active electronics inside the transducer head, which suits high-temperature or electrically noisy environments. These networks insert discrete or thin-film resistors in series with the excitation supply, across the input nodes, or parallel to individual arms. Successfully flattening sensitivity over temperature depends on matching the chosen circuit configuration to the sensor’s specific boron doping profile.

Constant Current Excitation Mechanics
Powering the bridge from a constant current source takes advantage of silicon’s positive temperature coefficient of resistance. Because the terminal voltage equals the injected current multiplied by the total bridge resistance, rising temperatures and increased phonon scattering push the excitation voltage higher.
Since full-scale differential output scales directly with input voltage, this rising terminal potential compensates for the declining gauge factor. If the positive temperature coefficient of resistance matches the magnitude of the negative sensitivity coefficient, first-order span compensation occurs without adding external trim resistors. Attaining that self-compensating balance requires doping concentrations clustered narrowly around 5 × 1018 cm-3, a window difficult to maintain repeatedly across foundry diffusion lots.
Can Passive Resistor Topologies Balance Span Shift?
Bridging the input nodes with a thermally stable thin-film resistor curbs excessive voltage growth across the bridge. If the wafer’s temperature coefficient of resistance outpaces its sensitivity coefficient, constant-current drive will overcompensate the transducer, driving span upward at high temperatures. Placing a low-drift shunt resistor in parallel with the bridge terminals bypasses an increasing share of excitation current as the silicon heats up, tempering voltage rise.
As the bridge warms and its resistance climbs, more current routes through the fixed shunt, moderating terminal voltage and flattening the output span over the operating range. Conversely, when the resistance coefficient falls short of the sensitivity coefficient, placing a fixed resistor in series with a constant-voltage source forms a divider that delivers a comparable stabilizing effect.
| Compensation Circuit Topology | Excitation Source | Dominant Trimming Resistor Material | Span Drift Suppression Capability | Output Signal Attenuation |
|---|---|---|---|---|
| Uncompensated Bridge | Constant Voltage | None | None (-2000 ppm/K typical) | 0% |
| Self-Compensating Doping Match | Constant Current | None | First-Order Only (±200 ppm/K) | 0% |
| Parallel Shunt Resistor | Constant Current | Thin-Film Tantalum Nitride | Broad Temperature Window (±75 ppm/K) | 15% to 35% |
| Series Dropping Resistor | Constant Voltage | Thin-Film Nickel-Chromium | Moderate Temperature Window (±120 ppm/K) | 20% to 50% |
| Thermistor Resistor Divider | Constant Voltage | Sintered Metal Oxide NTC | Non-Linear Curve Shaping (±40 ppm/K) | 30% to 60% |
Thin-Film Resistor Trimming and Laser Adjustments
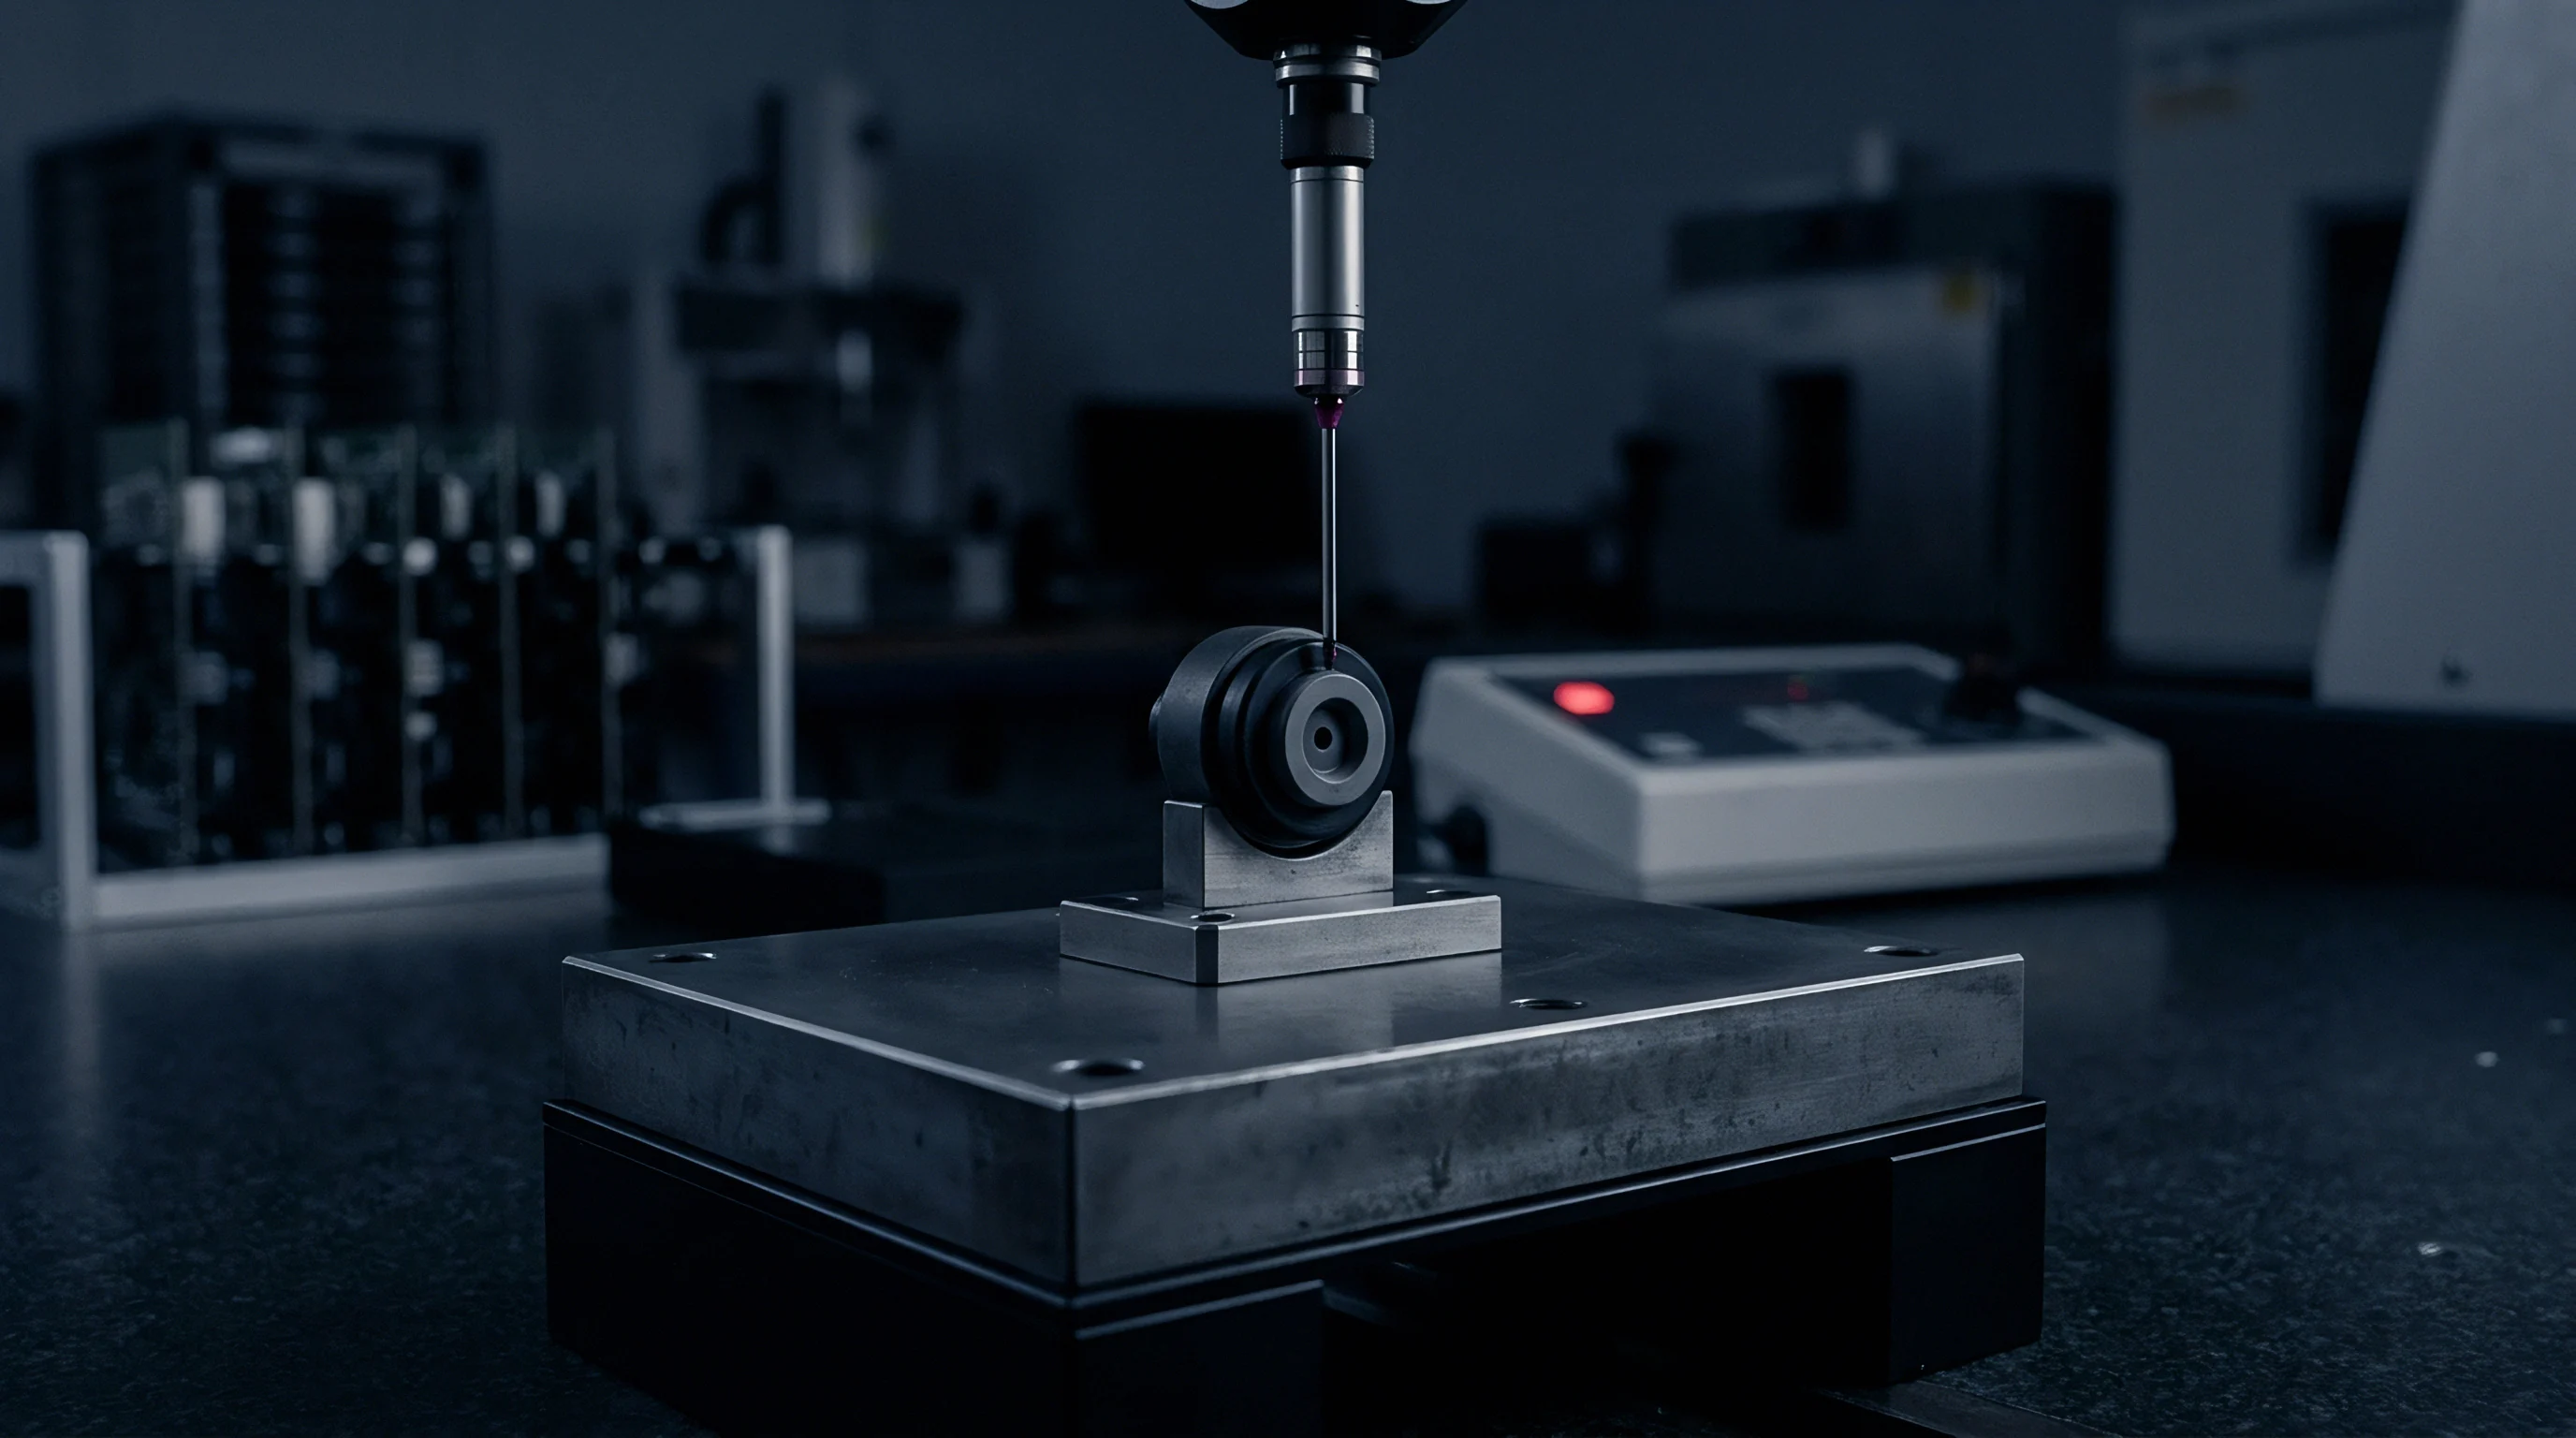
Thin-film nickel-chromium traces deposited around the die periphery permit post-fab tuning. Automated Nd:YAG lasers trim these ladders during test routines by severing metal rungs or machining plunge cuts into resistor blocks. With temperature coefficients typically under ±25 ppm/K, these thin films contribute negligible thermal drift compared to the underlying silicon.
Executing passive bridge trimming follows an ordered calibration procedure with strict intermediate dependencies:
- Room temperature bridge balancing severs zero-offset links until the differential output settles within 50 microvolts of null.
- High-temperature zero soak records baseline offset at 100 degrees Celsius to determine the resistance divergence between bridge arms.
- Thermally sensitive offset trimming trims series nickel-chromium links in the lagging arm to equalize the thermal slopes of both halves.
- High-temperature span evaluation loads the sensor to full-scale differential pressure at elevated temperature to calculate residual span drift.
- Shunt span trimming opens parallel ladder rungs across the supply terminals, tailoring bridge excitation to flatten span across the operational envelope.
Factory passive trims typically target end-point error bands rather than mid-span thermal curvature, leaving residual span bow across intermediate temperatures.

Silicon
Integrated signal conditioners place analog front ends and digital processing logic right beside the micromachined diaphragm, sidestepping the signal-attenuation penalties of passive networks. Rather than burning signal across trim resistors, dedicated application-specific integrated circuits amplify the raw bridge output directly while reading die temperature from co-located diodes.
These mixed-signal conditioning chips integrate high-resolution analog-to-digital converters, low-noise programmable gain amplifiers, calibration memory, and digital output stages. Onboard math engines evaluate the multi-dimensional transfer function between bridge voltage, temperature, and actual pressure, stripping out both first-order slopes and higher-order thermal curvature.

How Digital Signal Processors Linearize Thermal Sensitivity?
The conditioner’s analog-to-digital converter alternates between sampling the bridge signal and measuring the forward voltage of a substrate p-n junction. Because a forward-biased silicon diode tracks temperature with a dependable slope near -2 millivolts per kelvin, it provides a quiet, responsive temperature reading directly from the die substrate.
The processor feeds both digitized signals into a hardware math engine that evaluates a multi-term polynomial. By referencing bridge readings against factory coefficients, the engine calculates true pressure thousands of times per second, correcting baseline offset and span without the loading errors or thermal lag common to external trim components.
Digital correction registers evaluate pressure and temperature matrices to hold total error bands within 0.1 percent of span across 160 kelvin.

Polynomial Surface Fitting and EEPROM Storage
Automated factory calibration gathers raw sensor outputs across fixed grids of temperature and pressure. By logging uncompensated voltages at temperature extremes and room ambient across multiple pressure steps, fitting routines construct an empirical surface model and solve for the die’s individual calibration coefficients.
The standard model applies a bivariate polynomial equation describing the relationship between uncompensated bridge output, measured temperature, and true pressure:
Pcorrected = ∑ ∑ Cij × (Vbridge – Voffset)i × (Tmeasured – Tref)j
In this formulation, indices i and j represent the correction orders for pressure and temperature non-linearity. Most industrial transmitters implement a third-order polynomial for temperature alongside a second-order polynomial for pressure. Storing these fixed-point or floating-point values in on-chip EEPROM permanently anchors the calibration to the physical device.
High-Order Correction Limits and Noise Floor Inflation
Rounding errors in fixed-point math can introduce artificial output ripples over broad temperature spans. While higher-order polynomials fit complex thermal non-linearities in simulation, actual hardware imposes trade-offs: calculating additional terms consumes processor cycles, stretches conversion latency, and magnifies quantization noise across tightly spaced calibration points.
System designers follow specific boundaries when selecting the mathematical architecture for digital conditioning microchips:
- First-order correction removes basic linear offset and sensitivity slopes, but leaves unacceptable residual error across wide spans like the -40 to 150 degrees Celsius automotive range.
- Second-order modeling suppresses the parabolic bow tied to acoustic phonon scattering, driving uncompensated errors below 0.5 percent of span.
- Third-order interpolation resolves S-curve inflection points caused by packaging stress and incomplete dopant ionization at temperature extremes.
- Fourth-order fitting runs severe risks of Runge-type overfitting between test points, producing synthetic oscillations at temperatures not evaluated during factory calibration.
Characterizing high-order thermal coefficients across volume production remains constrained by calibration bay throughput, where extended chamber runs quickly overwhelm target unit economics.


Ledger
Procurement contracts routinely split raw sensor die costs from multi-temperature qualification charges. While micromachined piezoresistive dice are commoditized silicon components, turning bare elements into stable, temperature-compensated instruments accounts for the bulk of production expense.
A specification requiring a 0.25 percent total error band from -40 to 125 degrees Celsius pays predominantly for environmental chamber occupancy and test-bench depreciation. Because dice from the same wafer lot carry disparate thermal coefficient distributions, each device requires individual thermal characterization rather than batch-wide correction tables, steepening unit price curves as accuracy thresholds tighten.

Factory Multi-Point Thermal Calibration Economics
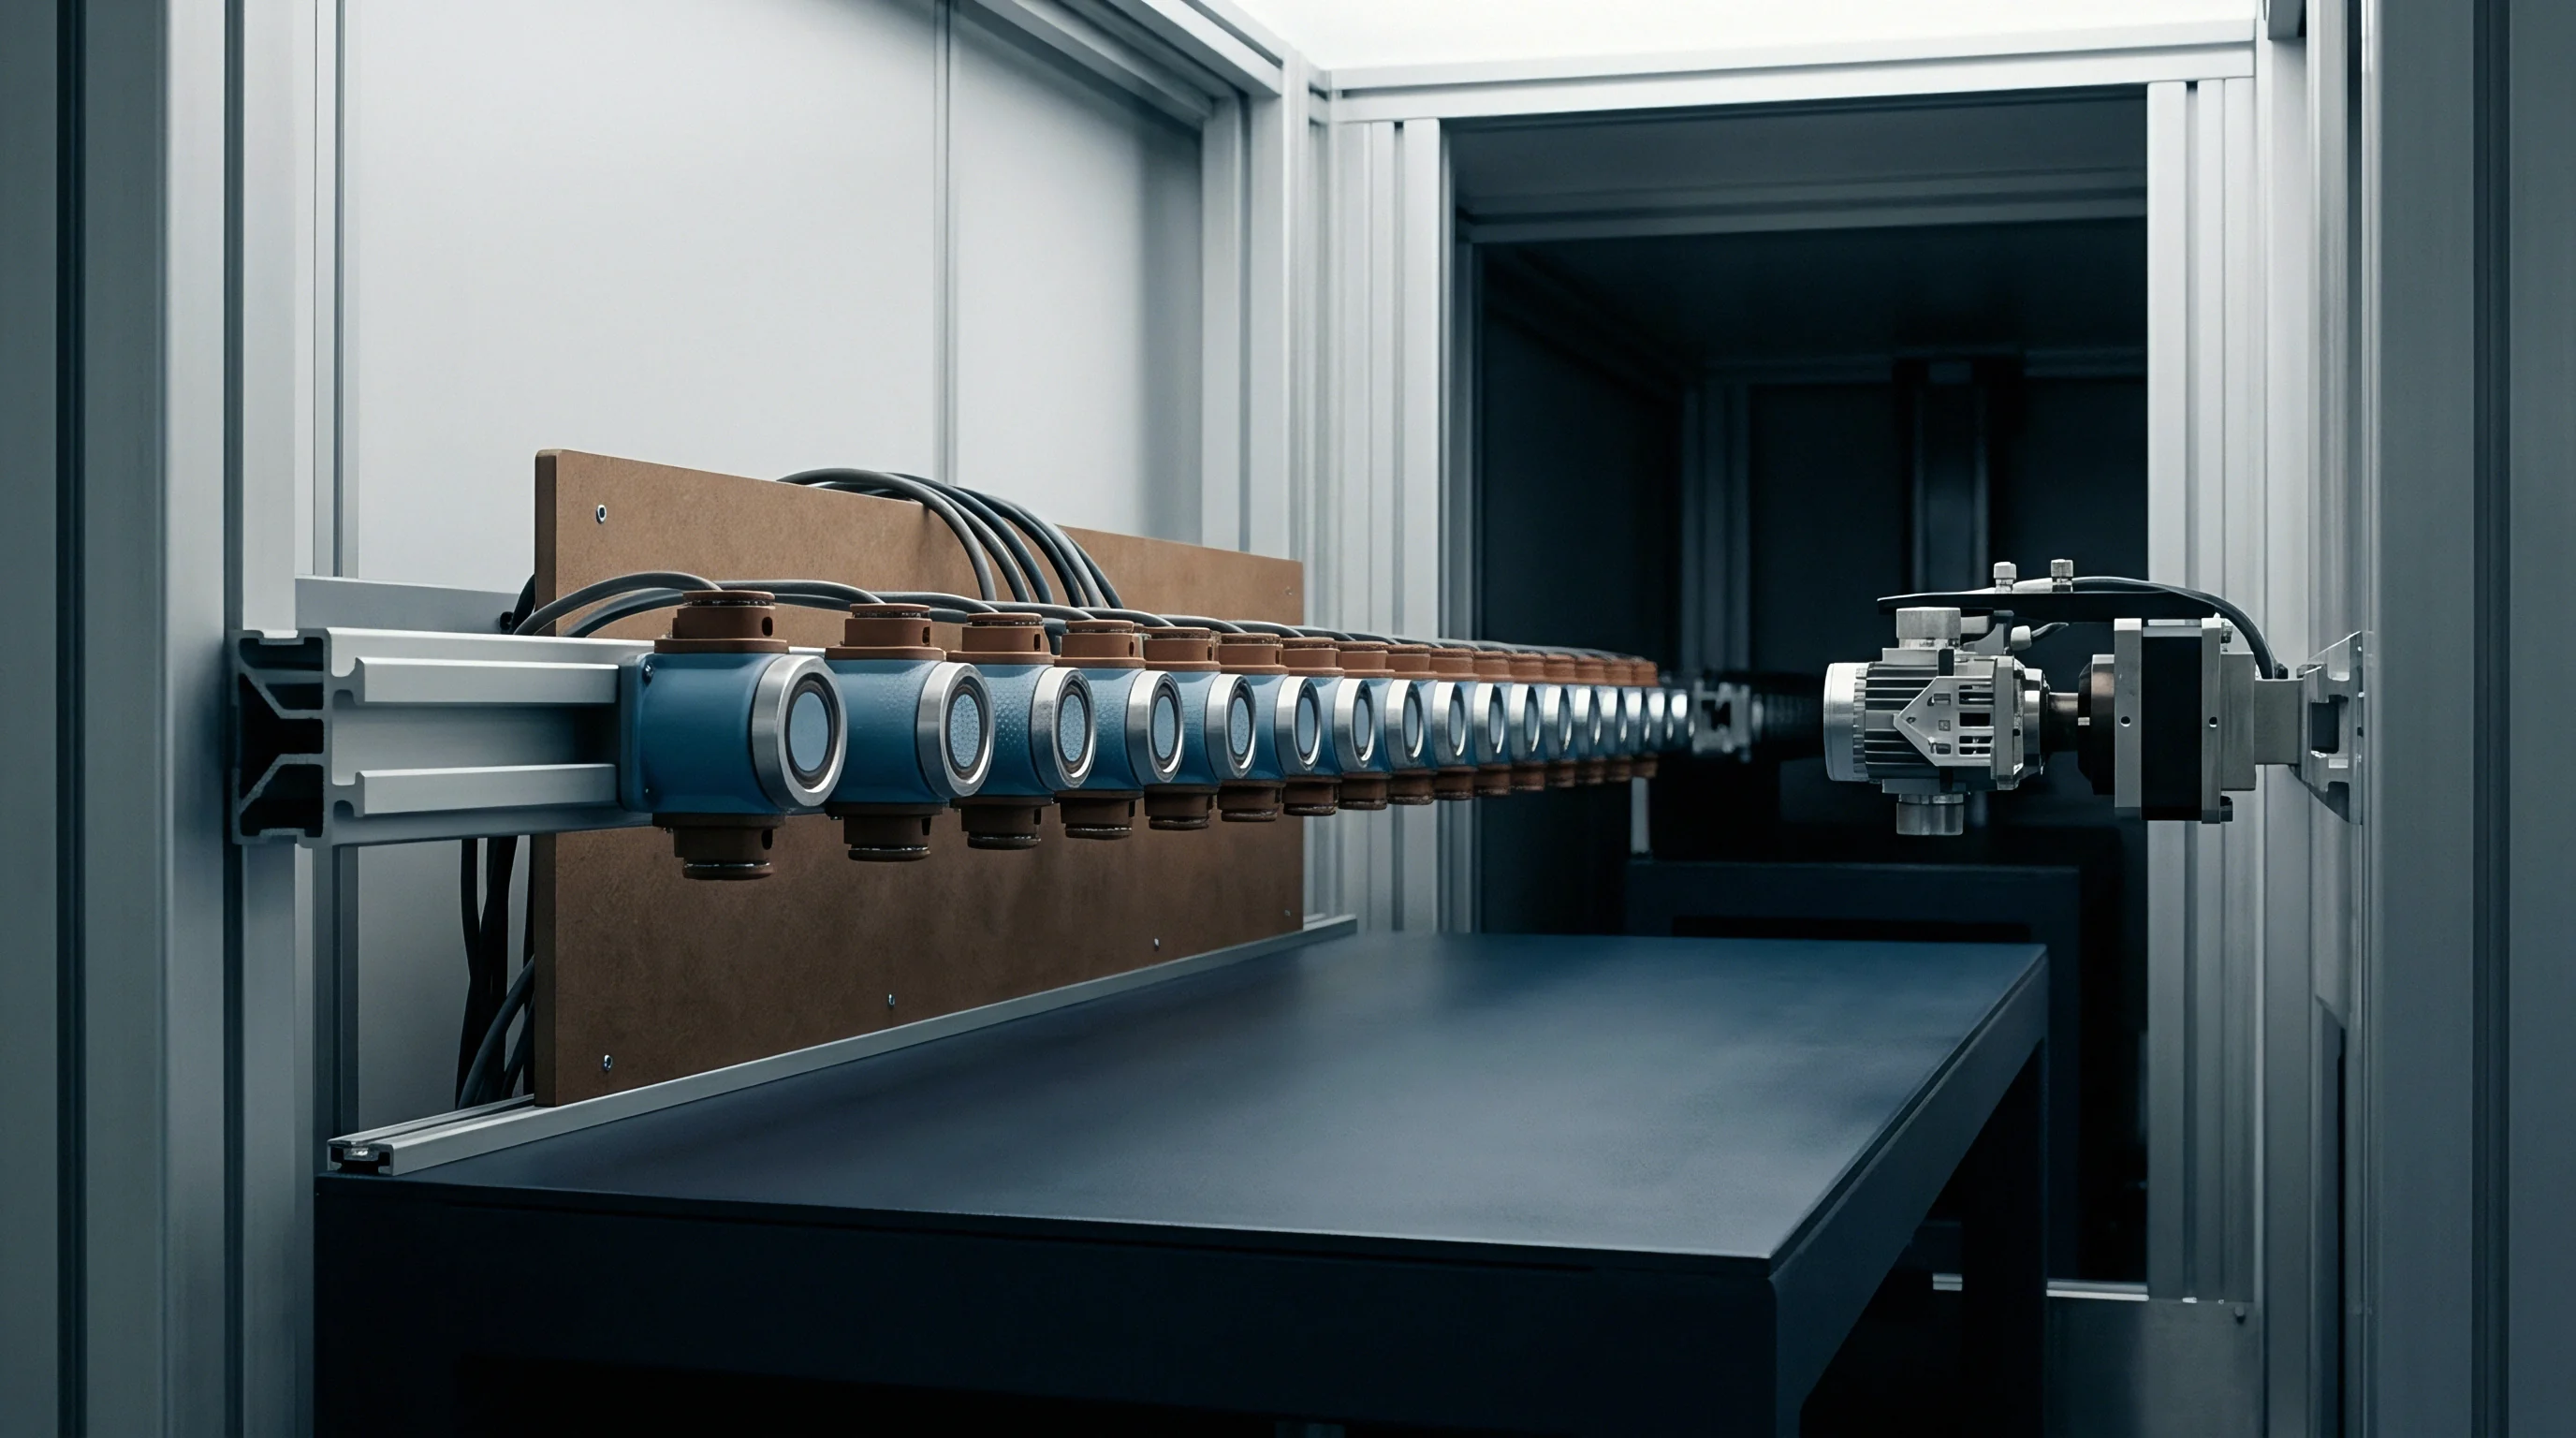
Chamber soak time represents the single largest operational cost in sensor production. Because calibration fixtures carry substantial thermal mass, cycling batches of several hundred transducers through -40, 25, 85, and 125 degrees Celsius requires extended holds at each plateau so the internal silicon diaphragms reach true thermal equilibrium.
Running a four-temperature, five-pressure test matrix ties up automated test bays for hours at a time. Truncating these dwells induces temperature lags between the sensing diaphragm and the compensation diode, corrupting the derived polynomial matrix and driving down calibration yield.
A contract specification that tightens total error band from 1.0 percent to 0.1 percent triples calibration dwell time.

Uncertainty Budgets under ISO 17025 Accreditation
Accredited calibration labs operating under ISO 17025 quantify error contributions across reference deadweight testers, temperature baths, and digital multimeters following the Guide to the Expression of Uncertainty in Measurement. Stating a temperature compensation specification on a certificate requires validating each constituent term in the uncertainty chain.
| Uncertainty Contribution Source | Probability Distribution | Standard Uncertainty (ppm) | Sensitivity Coefficient | Uncertainty Contribution (ppm) |
|---|---|---|---|---|
| Primary Piston Gauge Pressure Reference | Normal (k=2) | 15 | 1.0 | 15.0 |
| Thermal Chamber Spatial Uniformity | Rectangular | 85 | 0.45 | 38.3 |
| Thermal Chamber Temporal Stability | Rectangular | 40 | 0.45 | 18.0 |
| Reference Digital Voltmeter Calibration | Normal (k=2) | 8 | 1.0 | 8.0 |
| Excitation Current Source Drift | Rectangular | 25 | 1.0 | 14.4 |
| Sensor Diaphragm Thermal Hysteresis | U-Shaped | 110 | 0.707 | 77.8 |
| Analog-to-Digital Quantization Noise | Rectangular | 12 | 0.577 | 6.9 |
| Combined Standard Uncertainty (k=1) | Normal | — | — | 91.2 ppm |
Three-Year Drift Verification and Re-Calibration Cycles
Extended field service demonstrates whether factory polynomial fits hold up against prolonged thermomechanical aging. Over operating intervals exceeding three years, thin-film trims can oxidize, potting materials outgas plasticizers, and silicon diaphragms accumulate dislocation strain from pressure cycling, leaving stored calibration coefficients out of sync with the physical bridge.
Budgeting solely for initial hardware procurement overlooks the maintenance costs of recurring verification. Re-certifying an installed transmitter fleet requires pulling units from process connections, cycling them inside portable dry-blocks, and logging reference points against traceable standards to catch baseline wander before it exceeds operational tolerances.
Procurement specifications citing IEC 60770-1, section 6.4 require thermal span stability ratings to account for post-excursion recovery, preventing manufacturers from resetting baseline zero offsets between thermal cycles.