Piezoresistive Sensor Field Drift Mitigation via Automated Thermal Burn in and Acoustic Screening
Automated thermal burn-in exhausts initial die-attach stresses while acoustic microscopy weeds out sub-surface voids to halt piezoresistive field drift.


Lattice
Silicon piezoresistive diaphragms convert mechanical deflection into electrical potential through four doped resistors arranged in a Wheatstone bridge configuration. Over operating hours, nominal sensitivity shifts as internal stresses redistribute across the silicon substrate, die-attach elastomer, and glass pedestal. Initial zero-point offset instability comes down to thermo-mechanical relaxation across bonded interfaces, crystal dislocation motion within the piezoresistors, and charge migration in the passivation layer.
Unscreened piezoresistive pressure cells exhibit field offset drift rates between 0.15 percent and 0.85 percent of full-scale span across their initial six months of continuous excitation.
Zero-point wander is steepest during the first 120 operating hours. Micro-voids in the die-attach adhesive alter local thermal conduction paths, setting up asymmetrical temperature gradients across the bridge. A thermal asymmetry of just 0.05 kelvin between opposing resistors produces a measurable zero-shift error in low-pressure silicon dies.
Accelerated stabilization strategies isolate and exhaust these relaxation mechanisms before factory calibration trims the balance resistors.

Mechanical Instability Drivers in Diffused Piezoresistors
Implanted boron atoms in p-type silicon diaphragms contract the local lattice, creating intrinsic micro-strain along the crystallographic axes. High-temperature bonding introduces substantial packaging stress because the coefficient of thermal expansion of silicon (2.6 parts per million per kelvin) mismatches that of borosilicate glass pedestals (3.25 parts per million per kelvin) and metal header housings (16.5 parts per million per kelvin). During field cycling, these packaging stresses relax non-linearly, driving unpredictable baseline drift.
- Interfacial voiding within the silicone or epoxy die-attach layer produces asymmetrical mechanical constraint, driving differential stress relaxation during temperature swings.
- Passivation charge trapping along the silicon dioxide boundary layer alters carrier concentration within shallow piezoresistive channels over prolonged voltage application.
- Header feedthrough creep relaxes wire-bond tension and shifts the ground-plane mechanical reference under cyclic thermal loads.
- Bonding glass microcracks propagate under cyclic pressure loading, reducing the structural stiffness of the diaphragm support ring.
A piezoresistive sensor holding 0.1 percent full-scale span accuracy at delivery will drift past 0.5 percent within 1,500 operating hours when die-attach void area exceeds twelve percent of the total seating footprint.
Metrological tracking of piezoresistive stability must evaluate span error alongside zero-offset shift. Span sensitivity changes primarily when the mechanical compliance of the diaphragm degrades or when bridge supply current shifts due to bulk resistance drift. Microscopic delamination around the diaphragm pedestal perimeter causes span coefficient changes that software compensation algorithms cannot correct.
Stabilizing the bulk mechanical assembly prior to final trim separates recoverable thermal hysteresis from permanent mechanical drift.
Neglecting initial strain relaxation shifts the burden of measurement stability entirely onto software compensation tables, resulting in field recalls when environmental cycling triggers sudden sensor baseline steps.


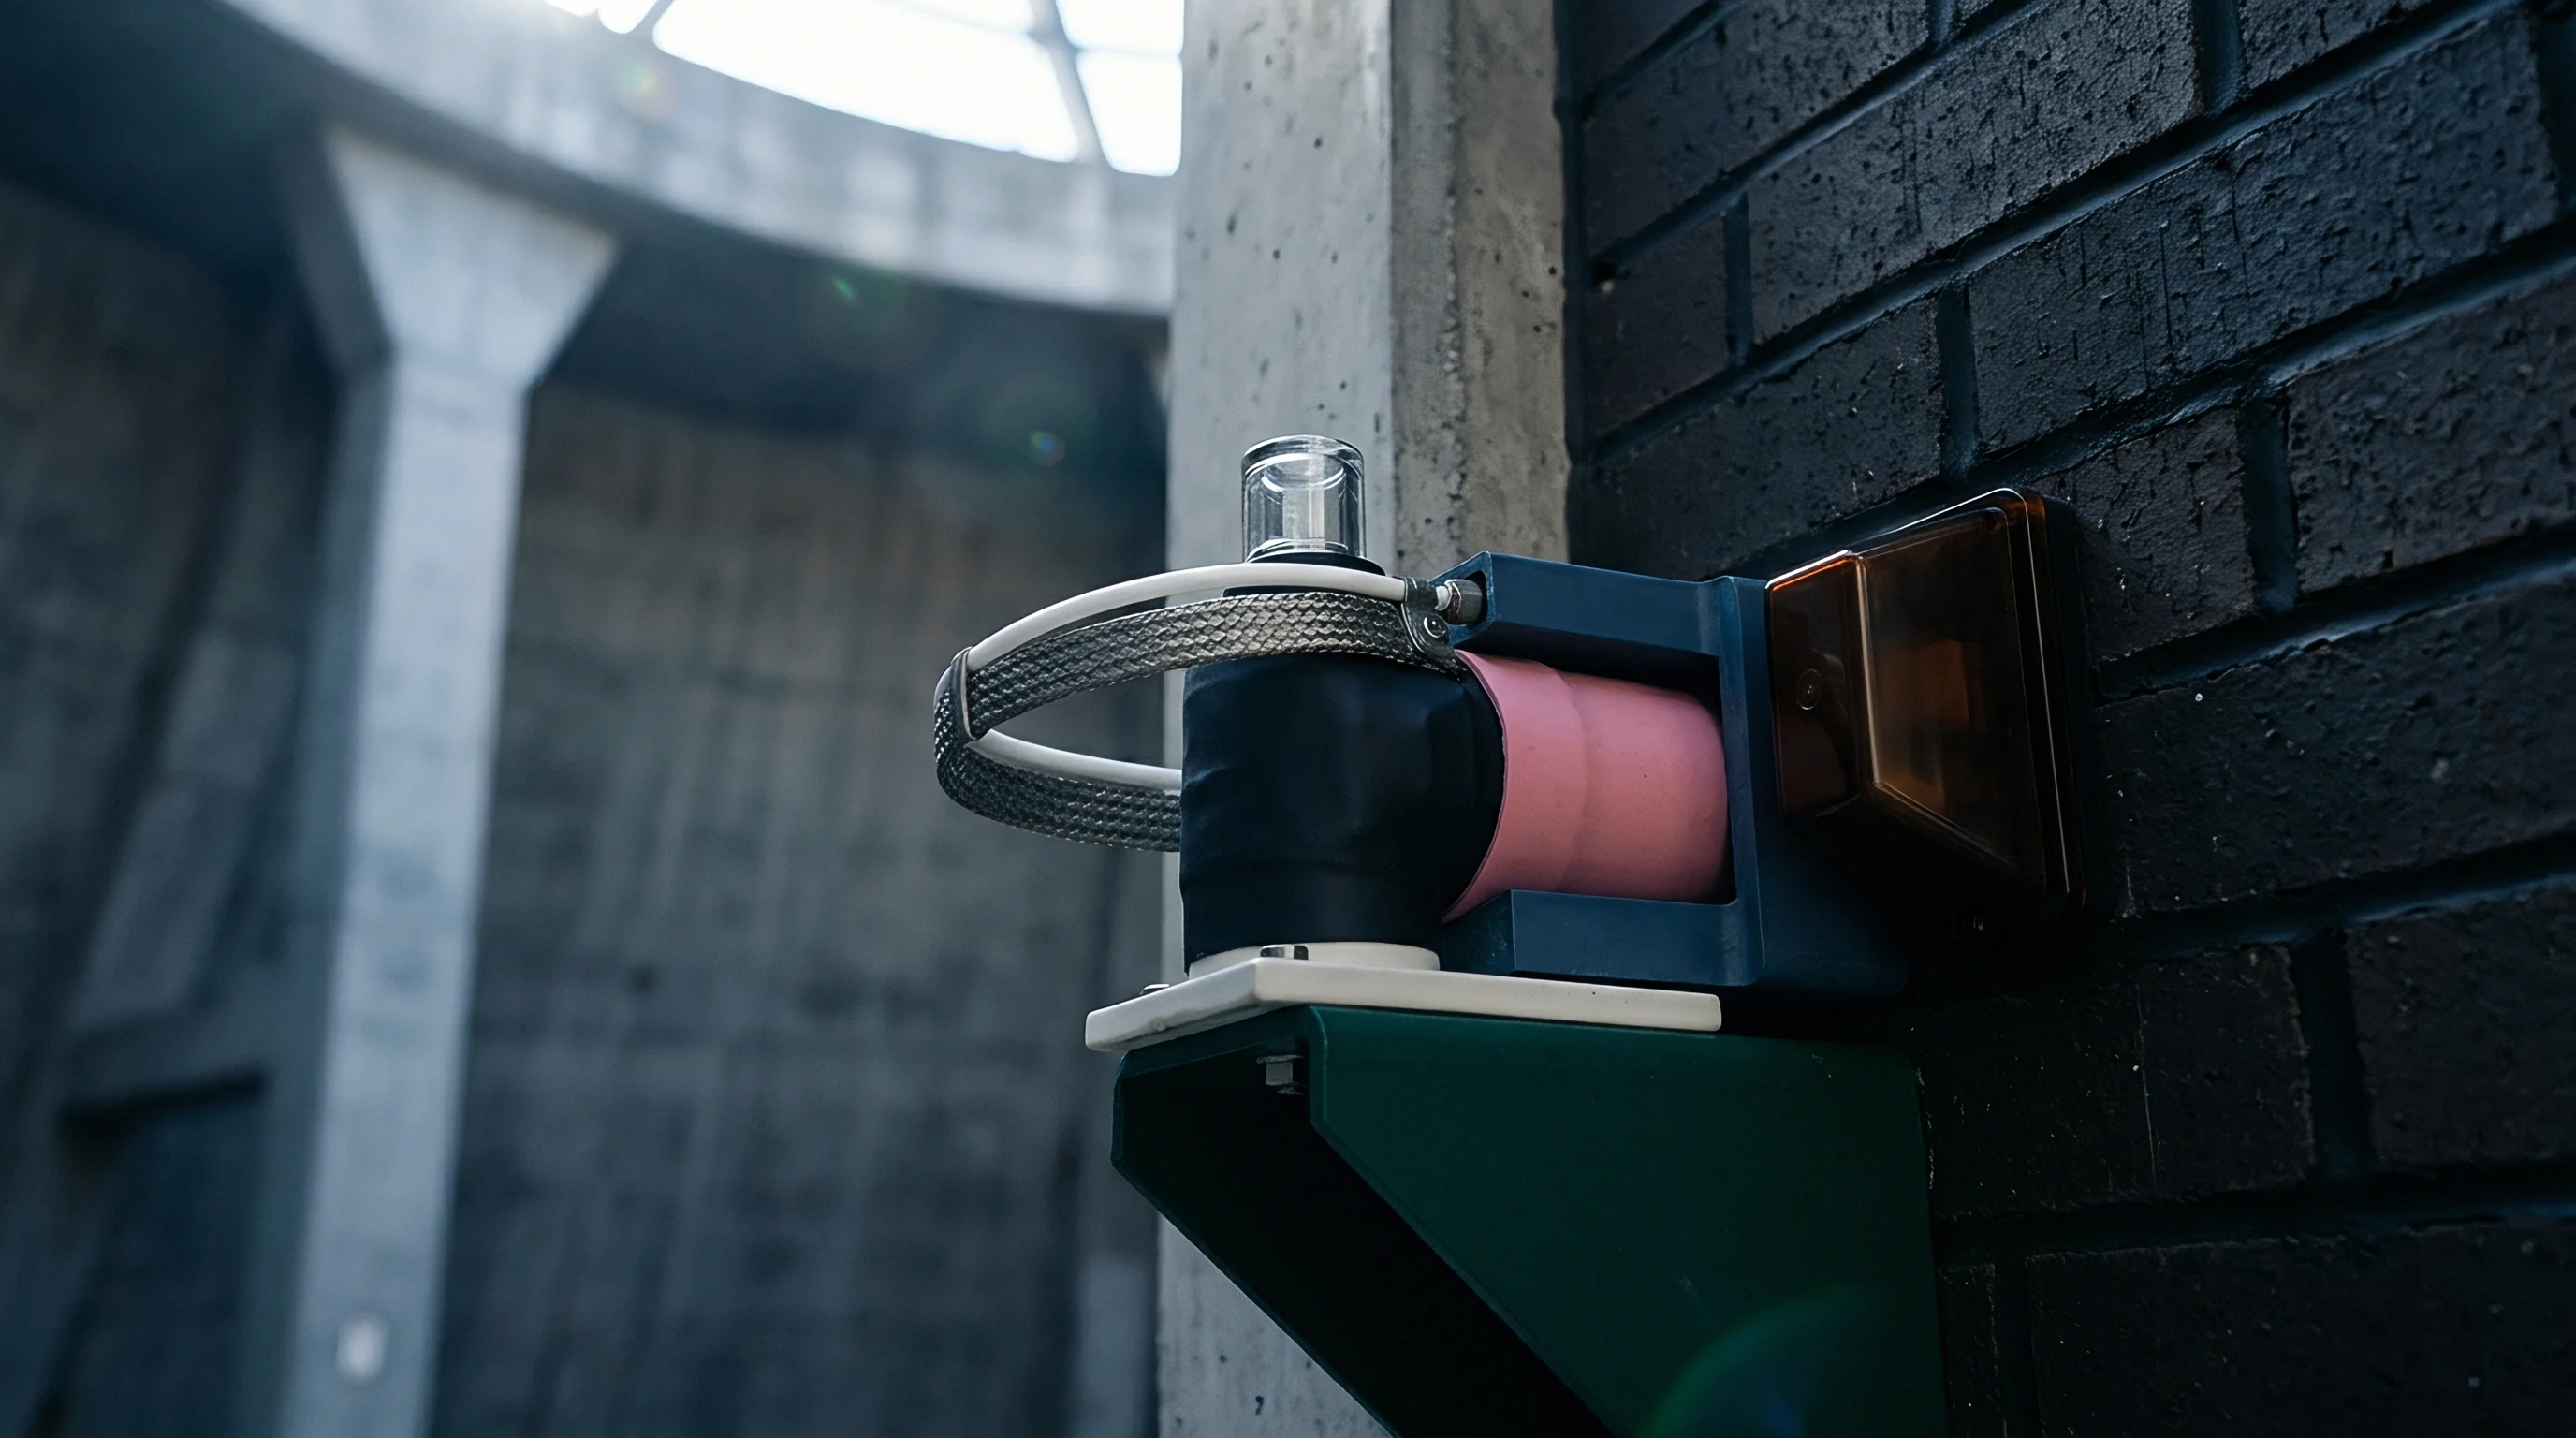
Heat
Thermal conditioning accelerates the logarithmic decay of packaging stresses and activates ionic redistribution within the passivation layers. Subjecting raw or assembled piezoresistive dies to controlled temperature profiles exhausts early structural relaxation within hours instead of years. The process relies on the Arrhenius relationship, where thermal activation energies between 0.65 electron-volts and 0.95 electron-volts govern stress relaxation in polymeric die adhesives and glass-frit seals.
Automated conditioning chambers apply continuous or switched electrical bias to the sensor bridge during thermal dwells. Dynamic bridge monitoring captures resistance divergence in real time. Resistor tracks showing anomalous resistance changes under elevated temperature point directly to metallization defects, poor ohmic contacts, or ionic contamination along diffused resistor boundaries.

Conditioning Profiles and Acceleration Factors
Setting the duration and temperature boundary of the stabilization cycle requires balancing stress exhaustion against chemical degradation of sealing materials. Operating at 125 degrees Celsius for 96 hours provides an acceleration factor of approximately 48 relative to a 25 degrees Celsius baseline when the target activation energy is 0.75 electron-volts. Exceeding 150 degrees Celsius risks glass transition breakdown in polymeric die-attach formulations, replacing beneficial stress relaxation with chemical breakdown.
| Chamber Temperature (°C) | Dwell Time (Hours) | Equivalent Operating Time at 25°C (Years) | Observed Offset Shift (%FS) | Post-Treatment 1-Year Drift (%FS) |
|---|---|---|---|---|
| 85 | 168 | 0.8 | 0.32 | 0.18 |
| 105 | 120 | 1.9 | 0.48 | 0.11 |
| 125 | 96 | 4.2 | 0.65 | 0.04 |
| 150 | 48 | 6.8 | 0.92 | 0.03 |
The stabilization cycle requires automated data acquisition systems to sample the bridge output at regular temperature plateaus. These intermediate measurements isolate sensors exhibiting erratic thermal hysteresis loops. When a sensor exhibits open-loop zero-shift divergence during thermal cycling, the component possesses internal structural defects that post-process calibration cannot correct.
- Load uncalibrated sensor assemblies into temperature-controlled chambers fitted with isolated multi-channel Keithley switching matrix connections.
- Ramp temperature at a controlled rate of 2 kelvin per minute to negative 40 degrees Celsius, holding the minimum temperature for two hours under continuous bridge excitation.
- Elevate chamber temperature at 3 kelvin per minute to 125 degrees Celsius, maintaining a dwell time of 96 hours with continuous bridge voltage logging.
- Cycle the population three times between negative 40 degrees Celsius and 125 degrees Celsius to close mechanical hysteresis loops within the die-attach matrix.
- Return the chamber to 25 degrees Celsius at a rate of 1.5 kelvin per minute and record the post-burn zero-point offset shift after a four-hour stabilization dwell.
Thermal stabilization cycles only accelerate pre-existing mechanical relaxation paths without altering the fundamental metallurgy of the sensor wire bonds.
Standard room-temperature offset trimming on an automated test bench corrects initial zero error, but cannot substitute for long-duration thermal conditioning runs.

Pulse
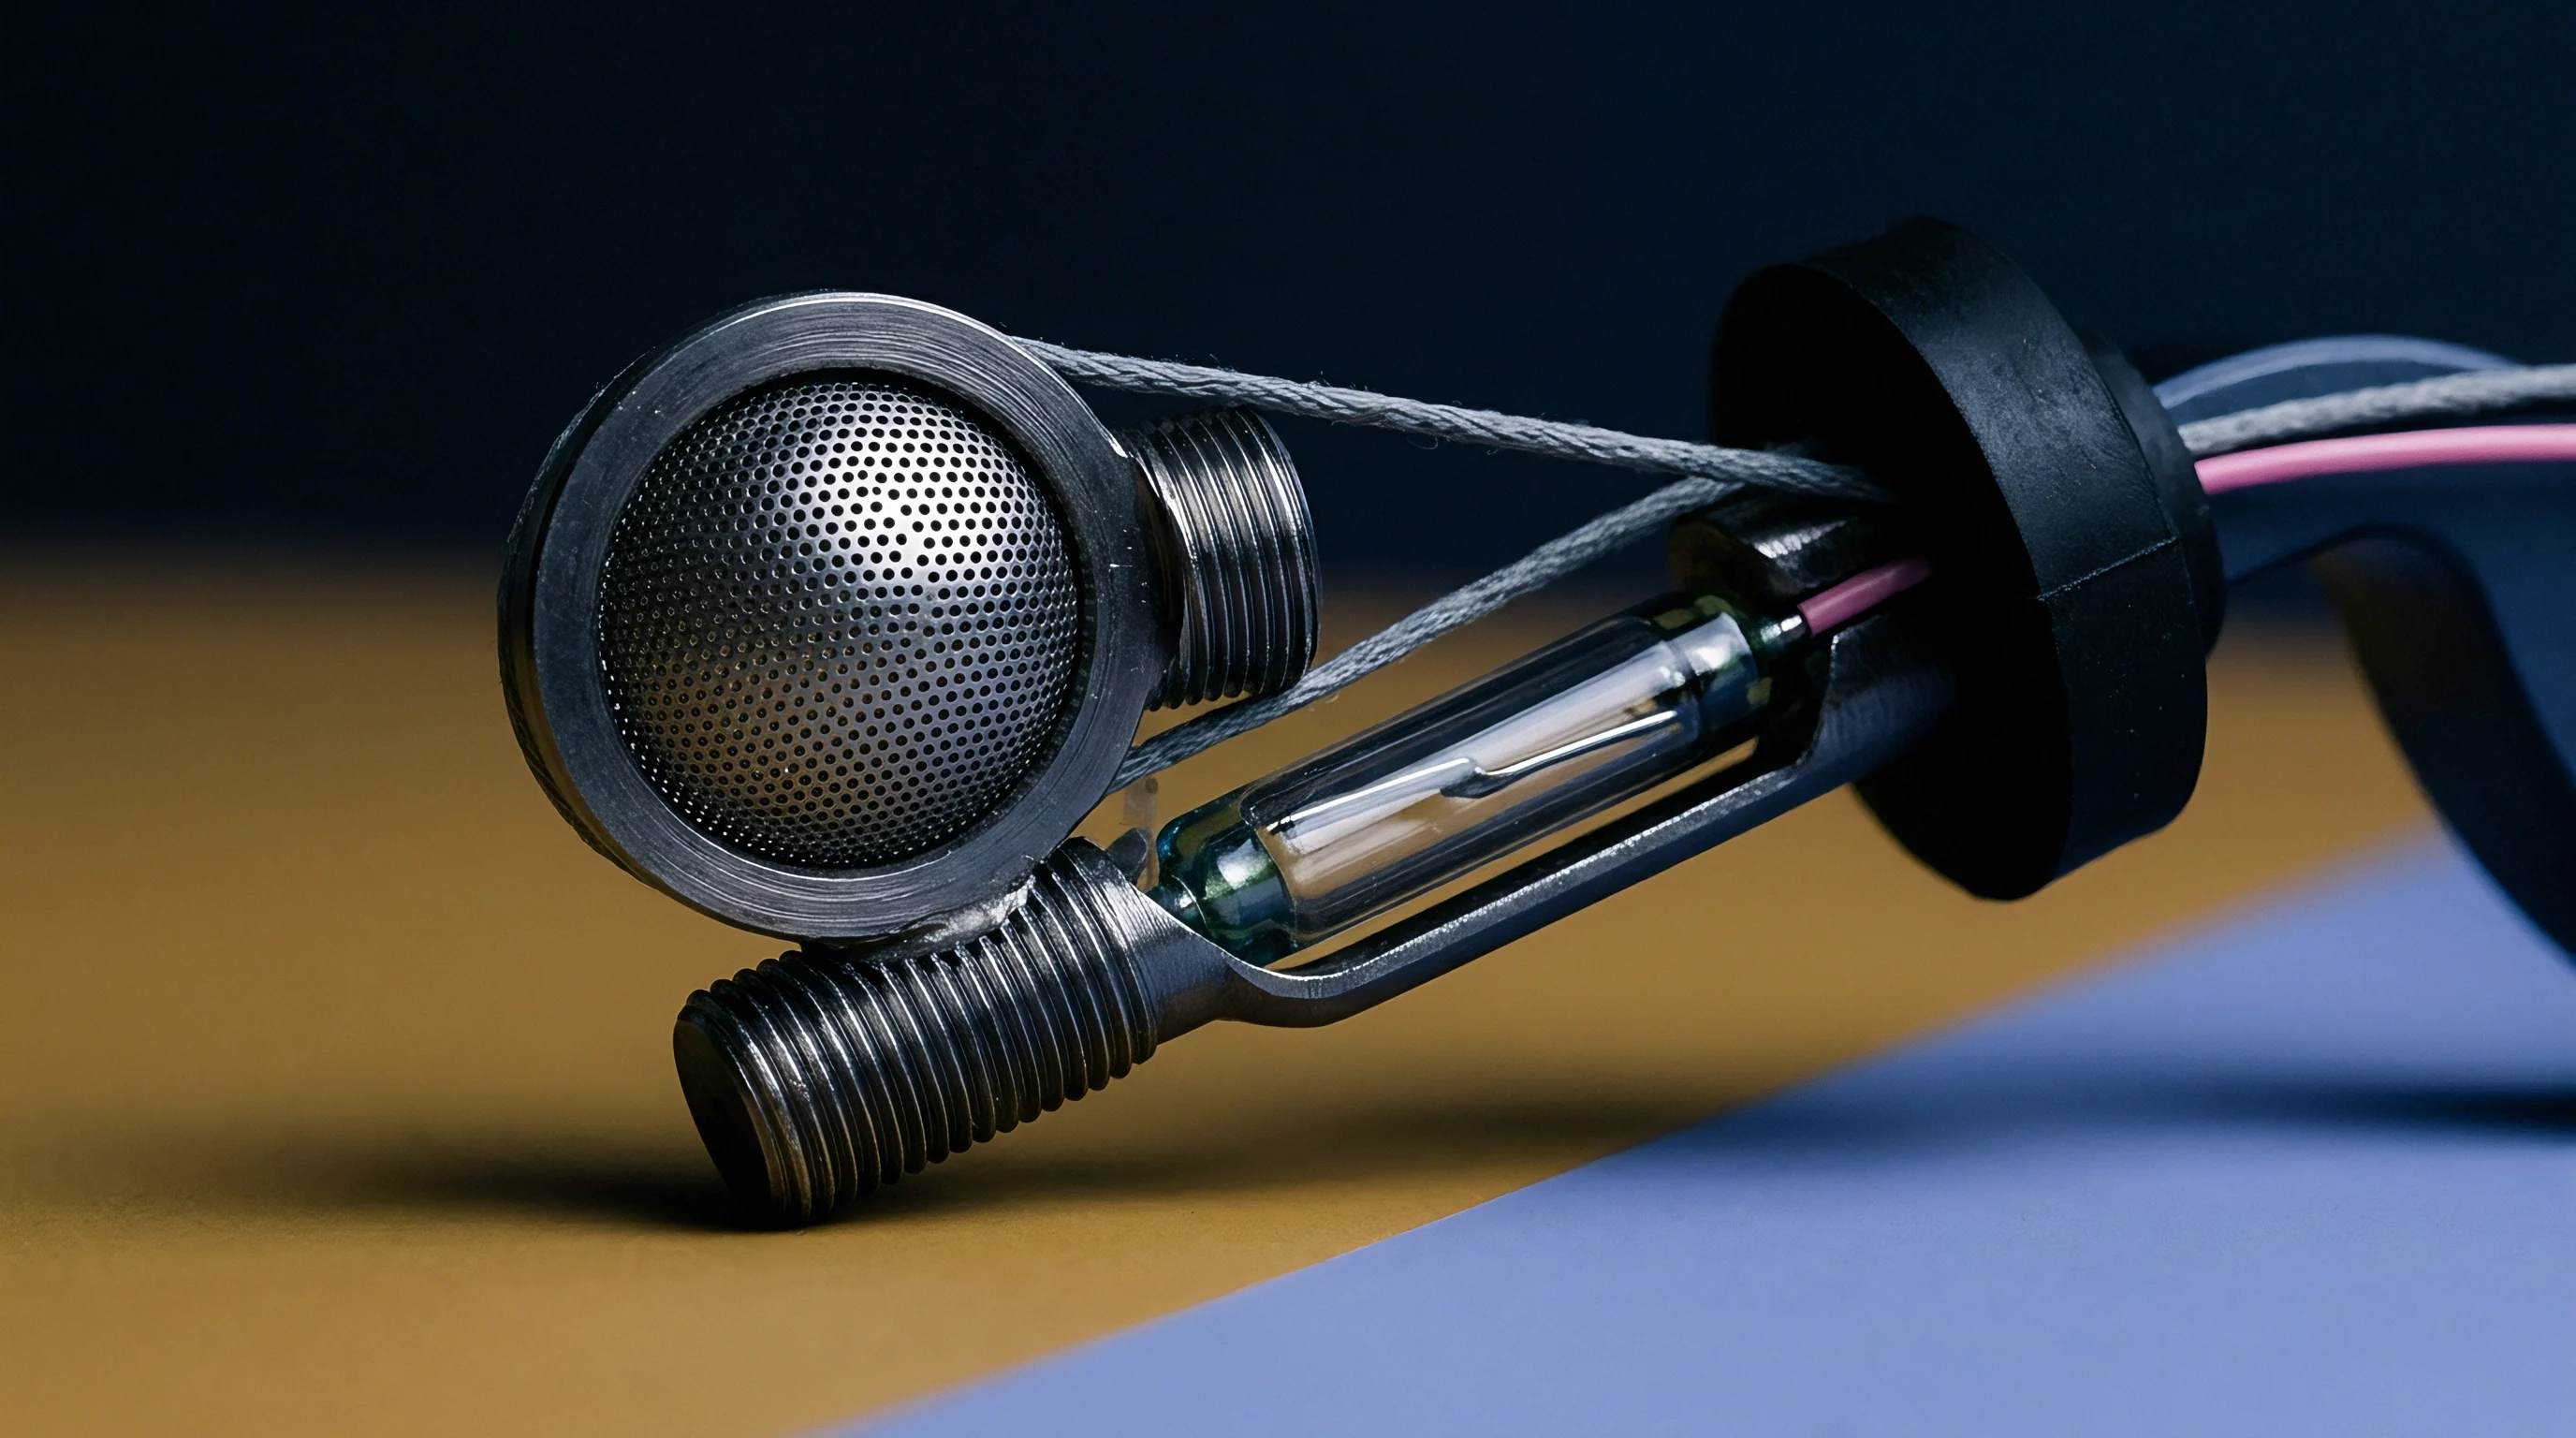
High-frequency acoustic screening inspects the internal mechanical integrity of sensor die bonds without causing mechanical destruction. Scanning acoustic microscopy injects ultrasonic pulses into the packaged transducer assembly and analyzes the amplitude, phase, and transit time of the reflected echo waveforms. The acoustic impedance mismatch between solid materials and air-filled voids generates near-total reflection of the acoustic energy, mapping sub-surface defects within the die-attach, substrate interface, and glass pedestal seal.
Piezoelectric acoustic transducers operating between 50 megahertz and 230 megahertz resolve interfacial voids down to 5 micrometers across the die bond. Acoustic screening identifies sensors containing delamination zones that survive initial electrical testing but subsequently cause severe long-term measurement drift under field vibration and thermal cycling.

Acoustic Reflection Mechanics at Bond Interfaces
Ultrasonic energy traveling through a material boundary reflects according to the acoustic impedance ratio of the adjacent layers. When acoustic waves encounter the boundary between a silicon die (acoustic impedance of approximately 19.7 mega-Rayls) and a void containing gas (impedance of 0.0004 mega-Rayls), the reflection coefficient approaches negative one. This phase inversion and total signal return reveals hidden voids and delamination boundaries under the silicon diaphragm.
| Transducer Frequency (MHz) | Axial Resolution (µm) | Lateral Resolution (µm) | Target Packaging Layer | Critical Defect Signature |
|---|---|---|---|---|
| 50 | 35 | 60 | TO-8 Header Baseplate | Solder voiding, glass eyelet seal cracks |
| 100 | 18 | 30 | Glass Pedestal to Substrate | Adhesive voids, perimeter channel bridging |
| 175 | 8 | 15 | Silicon Die to Glass Pedestal | Anodic bond voids, edge chipping cracks |
| 230 | 4 | 8 | Top-side Passivation Layer | Metallization delamination, passivation blisters |
Screening criteria reject components based on total void area, localized void clustering, and perimeter bond line continuity. A sensor die with twenty percent total voiding distributed uniformly may exhibit acceptable thermal stability, whereas five percent voiding concentrated directly beneath one arm of the piezoresistive bridge induces severe thermal gradient errors during field transients.
- Total void area across the die-attach plane cannot exceed ten percent of the nominal contact area.
- Contiguous corner delamination exceeding three percent of the die footprint triggers rejection due to progressive crack propagation risk.
- Bridge-adjacent void exclusion enforces zero allowable voiding within a 150-micrometer radius beneath active piezoresistive bridge geometries.
- Pedestal bond continuity requires eighty-five percent uninterrupted bond coverage along the outer sealing perimeter.
Scanning acoustic microscopy at 175 megahertz isolates die-attach interfacial micro-voids that electrical calibration bridges cannot detect until thermal cycling begins.
Under standard IPC/JEDEC J-STD-035 acoustic inspection guidelines, any single delamination line bridging the hermetic seal ring of a sensor pedestal mandates the immediate rejection of that entire packaging sub-lot.

Audit
Incoming inspection protocols verify that thermal conditioning and acoustic screening procedures have removed early life failures from delivered sensor batches. Metrological qualification requires establishing complete measurement traceability to primary standards under ISO/IEC 17025 accredited procedures. A complete audit protocol cross-references the batch acoustic scan records with individual zero-drift certificates generated during automated thermal burn-in.
Traceable calibration uses high-accuracy deadweight testers or automated piston gauges with expanded uncertainties better than 0.005 percent of reading. These references verify whether individual sensors meet their post-conditioning drift limits. Evaluating drift involves calculating the root-sum-square uncertainty of the test bench, including temperature chamber stability, digital multimeter accuracy, barometric reference drift, and pressure standard uncertainty.

Verification Checklist for Sourcing Inspection
Procurement dossiers must document the physical screening results before sensors move to high-level assembly. Relying on simple certificate-of-conformance statements allows marginal components with internal voids to enter production lines.
- Acoustic C-scan image logs showing individual serial-number-mapped void area percentages across the active die-attach plane.
- Thermal dwell bias records validating continuous bridge excitation and tracking intermediate offset points across all temperature plateaus.
- Traceable primary calibration data linking room-temperature span measurements to an ISO/IEC 17025 accredited deadweight reference.
- Hysteresis loop closure metrics quantifying residual zero-offset shift between ascending and descending thermal runs.
The expanded measurement uncertainty of the incoming test bench must maintain a test uncertainty ratio of at least four to one against the sensor tolerance specification. If a piezoresistive sensor specifies an annual stability limit of 0.1 percent of full scale, the verification bench uncertainty cannot exceed 0.025 percent of full scale over the complete testing cycle. Ambient atmospheric pressure fluctuations during gauge sensor verification introduce subtle offset errors unless differential barometric compensation is active.
True long-term stability is proven by the repeatability of the zero point after thermal cycling rather than the absolute accuracy of the initial trim.
A verification bench with inadequate temperature control will mistake chamber thermal fluctuations for sensor zero-point instability.


Ledger
Automated thermal conditioning and acoustic screening carry capital expenditures, extend test cycles, and generate early scrap. Sourcing managers weigh these initial processing costs against warranty claims, field replacements, and recalibration labor caused by drifting sensors in industrial and medical machinery. In high-reliability applications, screening out unstable assemblies early pays for itself within three to five operating years.
Thermal burn-in equipment amortizes across high unit volumes, but the testing cycle adds direct electrical energy and handling costs. Acoustic microscopy introduces a secondary inspection station that limits throughput unless multi-transducer scanning arrays process full trays of sensors concurrently. Yield fallout during acoustic screening averages between 4 percent and 11 percent on standard commercial packaging lines, while thermal conditioning removes an additional 2 percent to 6 percent of unstable dies.

Yield Economics and Screening Cost Comparison
The cost per delivered unit scales with screening stringency. Adding 96-hour thermal burn-in and 100-percent acoustic screening increases packaging-level production costs by 18 to 35 percent. This expenditure prevents field return rates that often exceed 4 percent per year in unconditioned sensor fleets deployed in harsh thermal environments.
| Inspection and Burn-In Regime | Added Processing Cost per Unit ($) | Factory Yield Fallout (%) | Year-One Field Return Rate (%) | Estimated 3-Year Service Cost per 1k Units ($) |
|---|---|---|---|---|
| Standard Factory Trim Only | 0.00 | 1.2 | 4.80 | 42,500 |
| 48-Hour Burn-In Without Acoustic | 4.20 | 3.8 | 1.60 | 18,200 |
| 96-Hour Burn-In + Sample Acoustic (5%) | 7.50 | 6.4 | 0.70 | 11,400 |
| 96-Hour Burn-In + 100% C-SAM Acoustic | 14.80 | 10.2 | 0.12 | 4,800 |
The economics of screening depend heavily on the accessibility of the installed sensor. In downhole energy exploration, aerospace flight control, or sealed biomedical implants, replacing a drifted sensor requires thousands of dollars in labor, system downtime, and regulatory filing costs. In these sectors, 100-percent acoustic inspection and extended burn-in protocols are standard risk-mitigation measures.
Quantifying the boundary where the cost of acoustic inspection balances the statistical likelihood of field drift remains a function of packaging design, operating environment, and mission-critical tolerances.