Long Term Thermal Coefficient Migration and Drift Correlation in Sub PPM Resistance References
Turnover temperature migration in sub-ppm resistance references systematically shifts effective thermal coefficients, accelerating drift and invalidating linear calibrations.
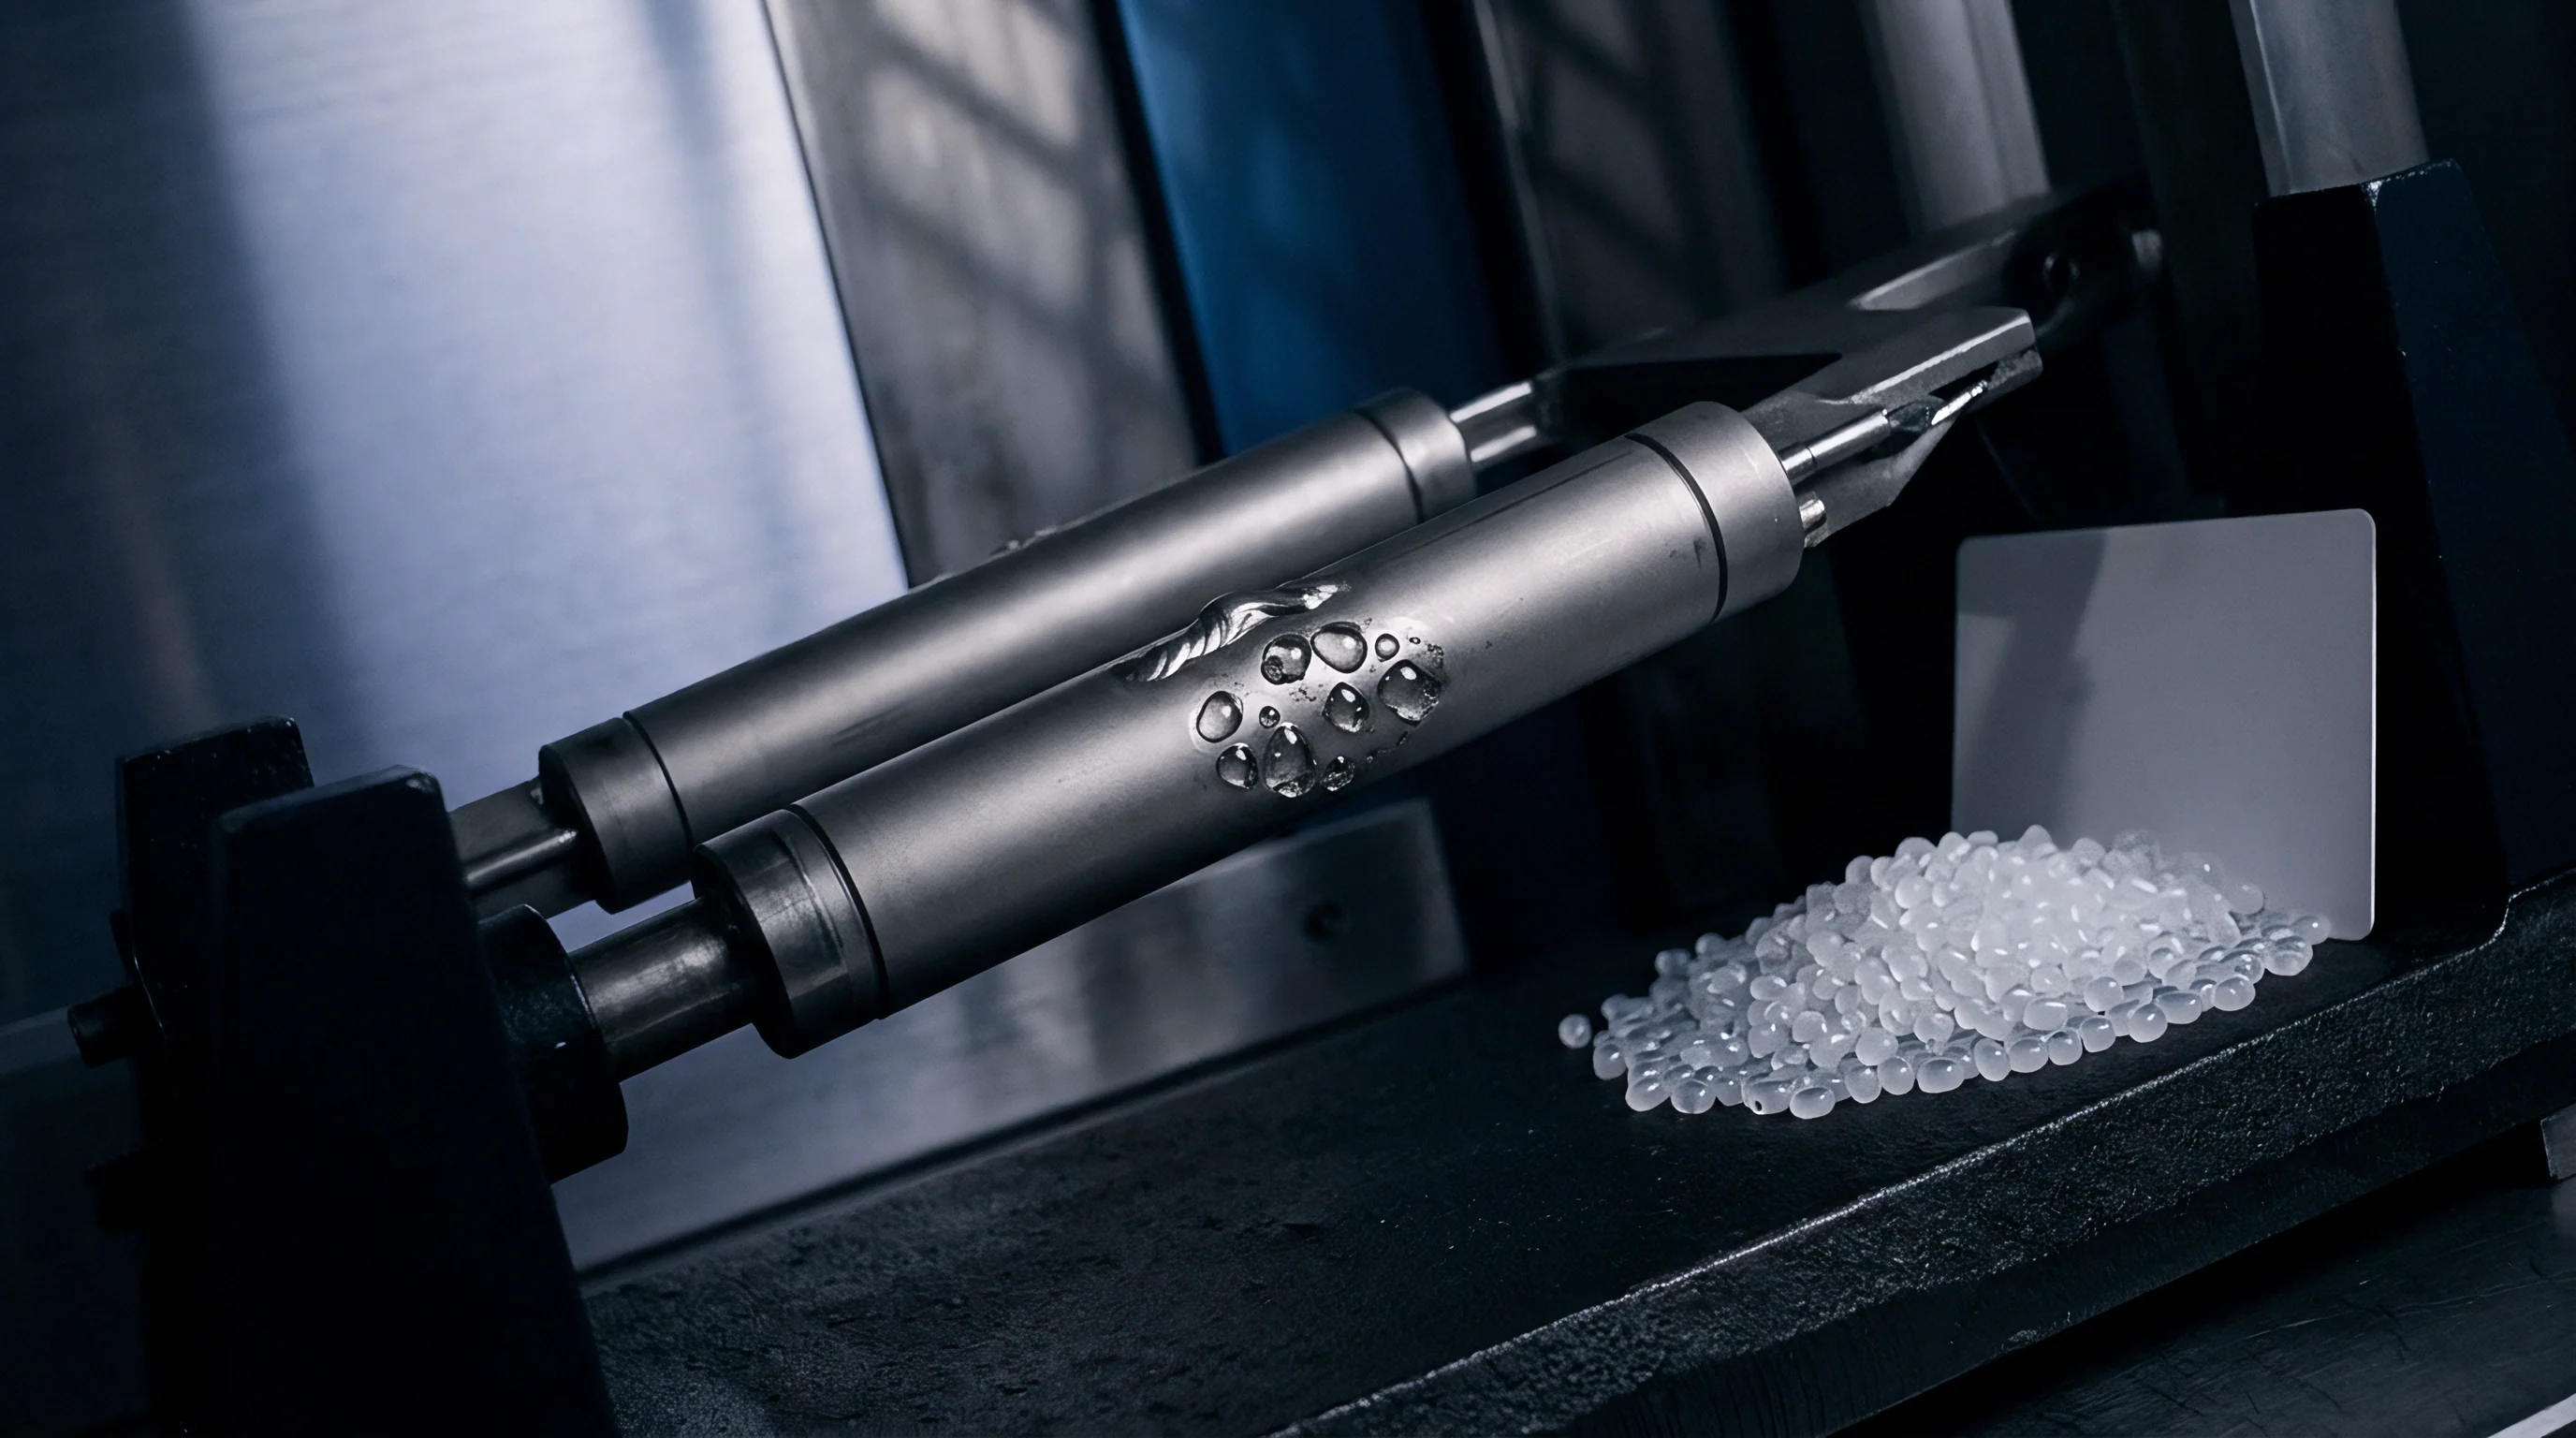

Solute
Sub-ppm resistance standards rely on quaternary nickel-chromium alloys where microstructural drift controls both the ohmic value and the temperature coefficient. In systems like Evanohm S (roughly 75% Ni, 20% Cr, 2.5% Al, 2.5% Cu), careful heat treatment yields a near-zero temperature coefficient of resistance at ordinary room temperatures. Solid-state atomic migration within the face-centered cubic lattice keeps shifting the scattering potential of conduction electrons, which simultaneously drives secular drift in base resistance and moves the turnover temperature.
Near the turnover point, the temperature dependence of precision standards fits a second-order parabola:
R(T) = R_0
Here R_0 is the peak resistance at turnover temperature T_0, α is the first-order temperature coefficient at T_0, and β is the second-order curvature coefficient. Commercial annealing aims to land T_0 right at the operating setpoint ~ typically 23.0 °C for air baths or 25.0 °C for oil cells. Even at room temperature, metallurgical relaxation never fully stops.
Short-range atomic ordering (SRO) in the nickel-chromium matrix shifts the density of states at the Fermi surface, drifting T_0 by as much as 0.15 °C per operating year.
Evanohm elements aged below their optimal stabilization temperature exhibit an upward migration of the turnover point accompanied by negative resistance drift.
When measured at a fixed laboratory reference temperature, that atomic redistribution shifts α. As T_0 drifts away from the working temperature, the effective local slope α_eff = α + 2β(T_ref – T_0) grows in magnitude. The curvature term β stays predictable, generally between -0.003 ppm/K² and -0.005 ppm/K², so the drift in T_0 remains the real source of apparent thermal instability.
Lattice vacancy annihilation causes bulk dimensional contraction over time. Secondary phases precipitating along grain boundaries strip chromium out of the solid solution, while surface aluminum oxidizes into a passivating Al²O³ film, leaving the sub-surface matrix enriched in unbonded nickel.
- Short Range Ordering Kinetics govern the redistribution of solute atoms within the nickel-chromium matrix over decades of service life.
- Turnover Temperature Drift alters the effective first-order temperature coefficient measured at standard laboratory temperatures.
- Vacancy Annihilation Rates dictate the residual volumetric contraction of drawn or etched resistance elements.
- Surface Passivation Oxide Growth consumes active solute elements and modifies the near-surface conductive path geometry.
Stability comes down to balancing alloy chemistry against residual cold work. A coil wound under tension tends to show erratic sign reversals in α during its first thirty-six months. Annealing relieves that mechanical stress while locking in the baseline short-range order.
Lower stabilization temperatures yield lower long-term drift, though they take far longer to settle.
Higher annealing runs accelerate ordering, but they trap high-temperature equilibrium states that wander once brought to ambient bench conditions.
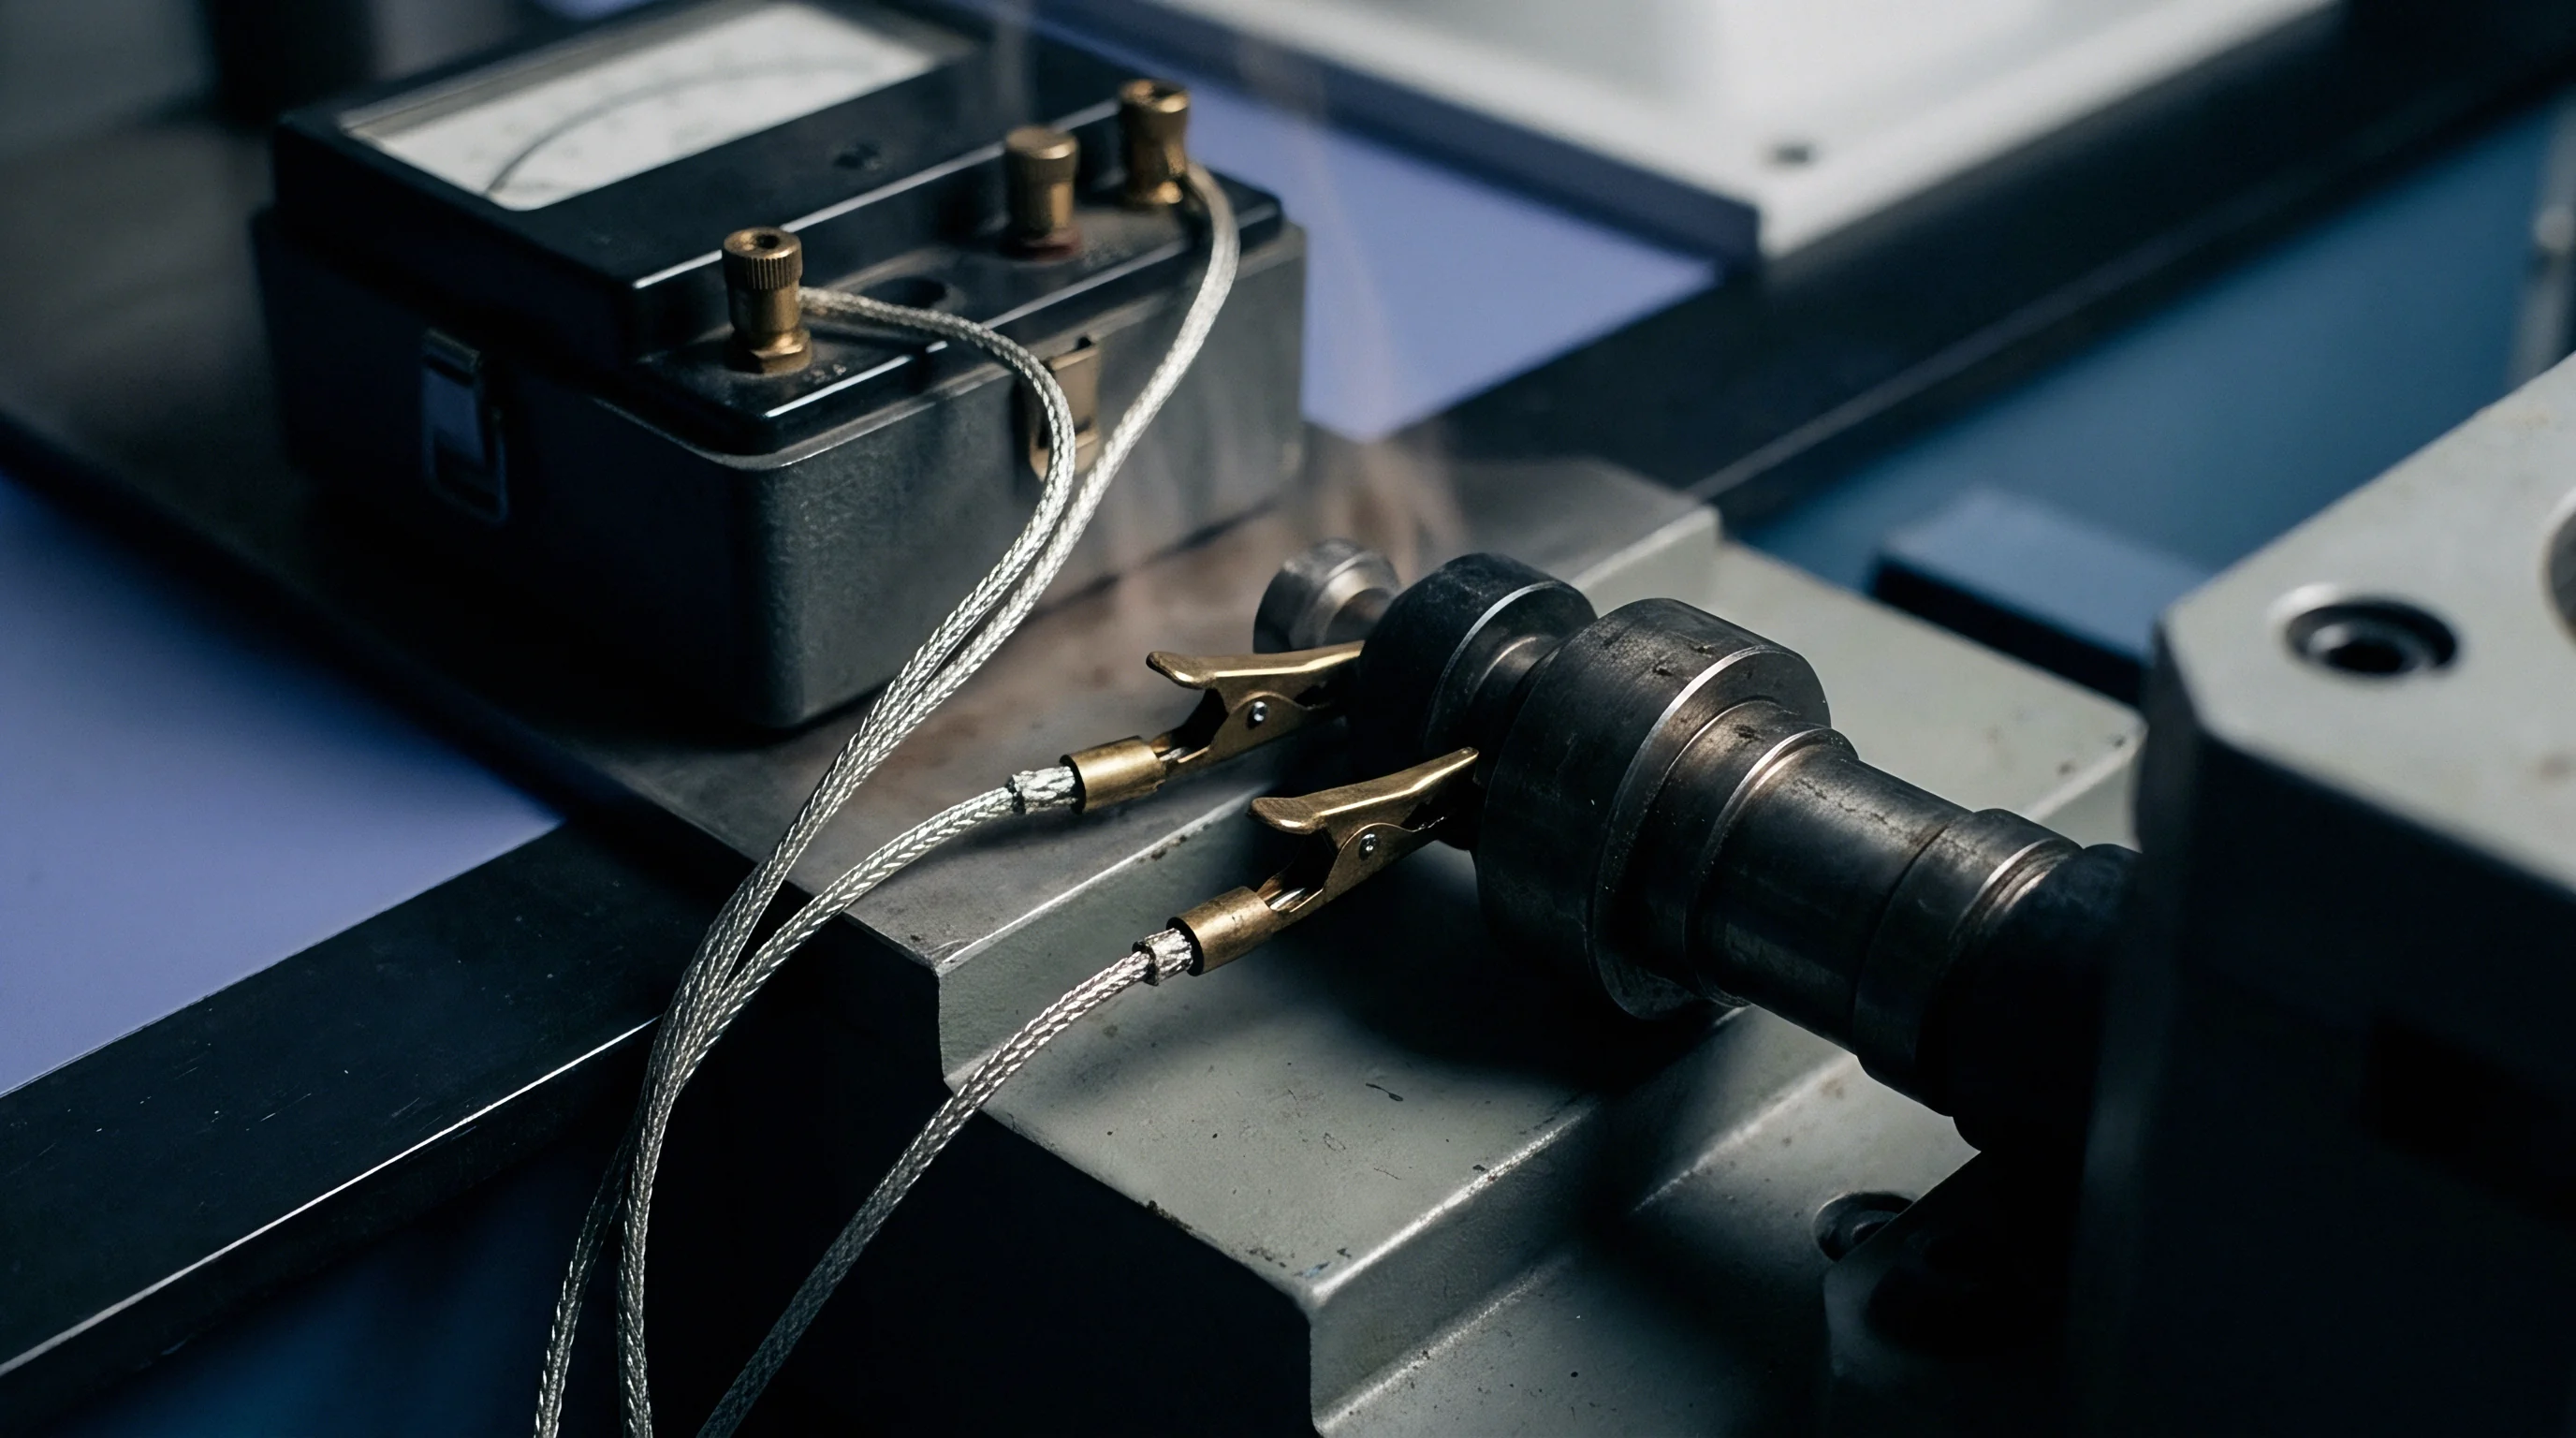
Tether
Mechanical mounting shields the element from shock, but it introduces its own thermo-mechanical strain. Free-hanging Evanohm wire loops in hermetic oil baths eliminate substrate drag at the expense of severe vibration pickup. Planar foil standards, by contrast, bond the alloy directly to alumina or sapphire using thin epoxy.
The expansion mismatch between the metal (around 13 ppm/K to 15 ppm/K) and the ceramic (6 ppm/K to 8 ppm/K) sets up persistent shear stress across the bond line.
| Element Architecture | Substrate Interface | Typical ΔT_0 Drift (mK/year) | Annual Base Drift (ppm/year) | Pressure Coefficient (ppm/hPa) |
|---|---|---|---|---|
| Suspended Bifilar Evanohm Wire | Hermetic Oil Enclosure | -15 to +40 | +0.02 to +0.08 | -0.0001 |
| Bonded Bulk Metal Foil | Alumina with Polyimide Epoxy | +50 to +180 | +0.15 to +0.45 | +0.0008 |
| Free-Floating Etched Foil | Silicone Gel Cushion | -20 to +60 | +0.05 to +0.12 | +0.0003 |
| Zeranin Wire Spool | Anodized Aluminum Bobbin | +80 to +250 | -0.10 to -0.35 | -0.0002 |
Epoxies creep viscoelastically and take on water. Ambient moisture enters non-hermetic housings, swells the resin, and loads the resistive grid in tension. That tensile load increases ohmic value via piezoresistive coupling and forces T_0 downward.
With gauge factors between +0.8 and +1.5 in Evanohm, minute dimensional creep translates straight into sub-ppm calibration drift.
Hermetic seal leakage exceeding 10&supmin;&sup8; mbar l/s causes humidity-driven strain drift that masks intrinsic metallurgical aging.
Terminal joints introduce another source of drift. Evanohm-to-copper junctions form thermocouple pairs generating 1 μV/K to 3 μV/K of Seebeck voltage. Brazing or hard soldering leaves heat-affected zones where local composition and work hardening no longer match the parent wire, and long-term stress relaxation in the joint shifts contact resistance over years of use.
- Mechanical Clamping of Alloy Terminals prevents thermal stress transfer during precision brazing procedures.
- Cadmium-Free Silver Soldering establishes low-thermal-EMF metallurgical junctions between the alloy and oxygen-free copper leads.
- Post-Termination Heat Treatment relieves localized mechanical strains created by lead dressing and swaging.
- Hermetic Glass-to-Metal Header Sealing eliminates ambient relative humidity fluctuations as a confounding strain variable.
Substrate clamping is often assumed to preserve factory calibration indefinitely through matched thermal expansion, though mechanical creep weakens that constraint over time.

Decay
Temporal drift and shifting thermal coefficients stem from the same thermodynamic relaxation. Over five- to ten-year tracking intervals, the resistance offset ΔR(t)/R_0 mirrors the directional drift of T_0. Longitudinal records from primary calibrations confirm the pattern: an upward migration in turnover temperature regularly coincides with downward secular drift in base resistance.
The two rates remain coupled through structural relaxation. Taking S as the structural ordering parameter of the alloy:
dR/dt = (∂R/∂S)(dS/dt) + (∂R/∂σ)(dσ/dt)
dT_0/dt = (∂T_0/∂S)(dS/dt) + (∂T_0/∂σ)(dσ/dt)
Here σ is internal mechanical stress. For a loose wire element, the stress term dσ/dt decays exponentially within roughly 5,000 hours, whereas structural ordering dS/dt continues under logarithmic t&sup−¹⁄² kinetics across several decades.
| Serial Group | Mean Base Drift (μΩ/Ω/year) | Mean ΔT_0 Migration (°C/year) | Effective α Shift (ppm/K/year) | Drift Correlation Coefficient (r) |
|---|---|---|---|---|
| Batch A (Oil Cell) | +0.018 ± 0.004 | -0.028 ± 0.006 | +0.00022 | -0.91 |
| Batch B (Air Well) | +0.045 ± 0.009 | -0.071 ± 0.012 | +0.00057 | -0.88 |
| Batch C (Foil Hermetic) | +0.120 ± 0.025 | -0.160 ± 0.030 | +0.00128 | -0.84 |
| Batch D (Planar Unsealed) | +0.380 ± 0.080 | -0.420 ± 0.095 | +0.00336 | -0.72 |
Take a standard starting at R_0 = 10 000.0000 Ω, T_0 = 23.00 °C, α = 0.00 ppm/K, and β = -0.004 ppm/K². Over three years at 23.00 °C, aging adds +0.06 ppm to R_0 while atomic ordering pulls T_0 down to 22.70 °C. The effective temperature coefficient at 23.00 °C becomes α_eff = 0 + 2(-0.004)(23.00 – 22.70) = -0.0024 ppm/K.
A cabinet variation of just ±0.5 °C then introduces an uncorrected transfer error of ±0.0012 ppm, which goes directly into the primary uncertainty ledger. The standard has not merely drifted in ohmic value; its sensitivity to ambient temperature swings has expanded.
Because aging warps the full resistance-temperature profile, practical work requires analytical models capable of linking secular resistance drift to turnover migration across different heats without destructive sectioning.
Disparity
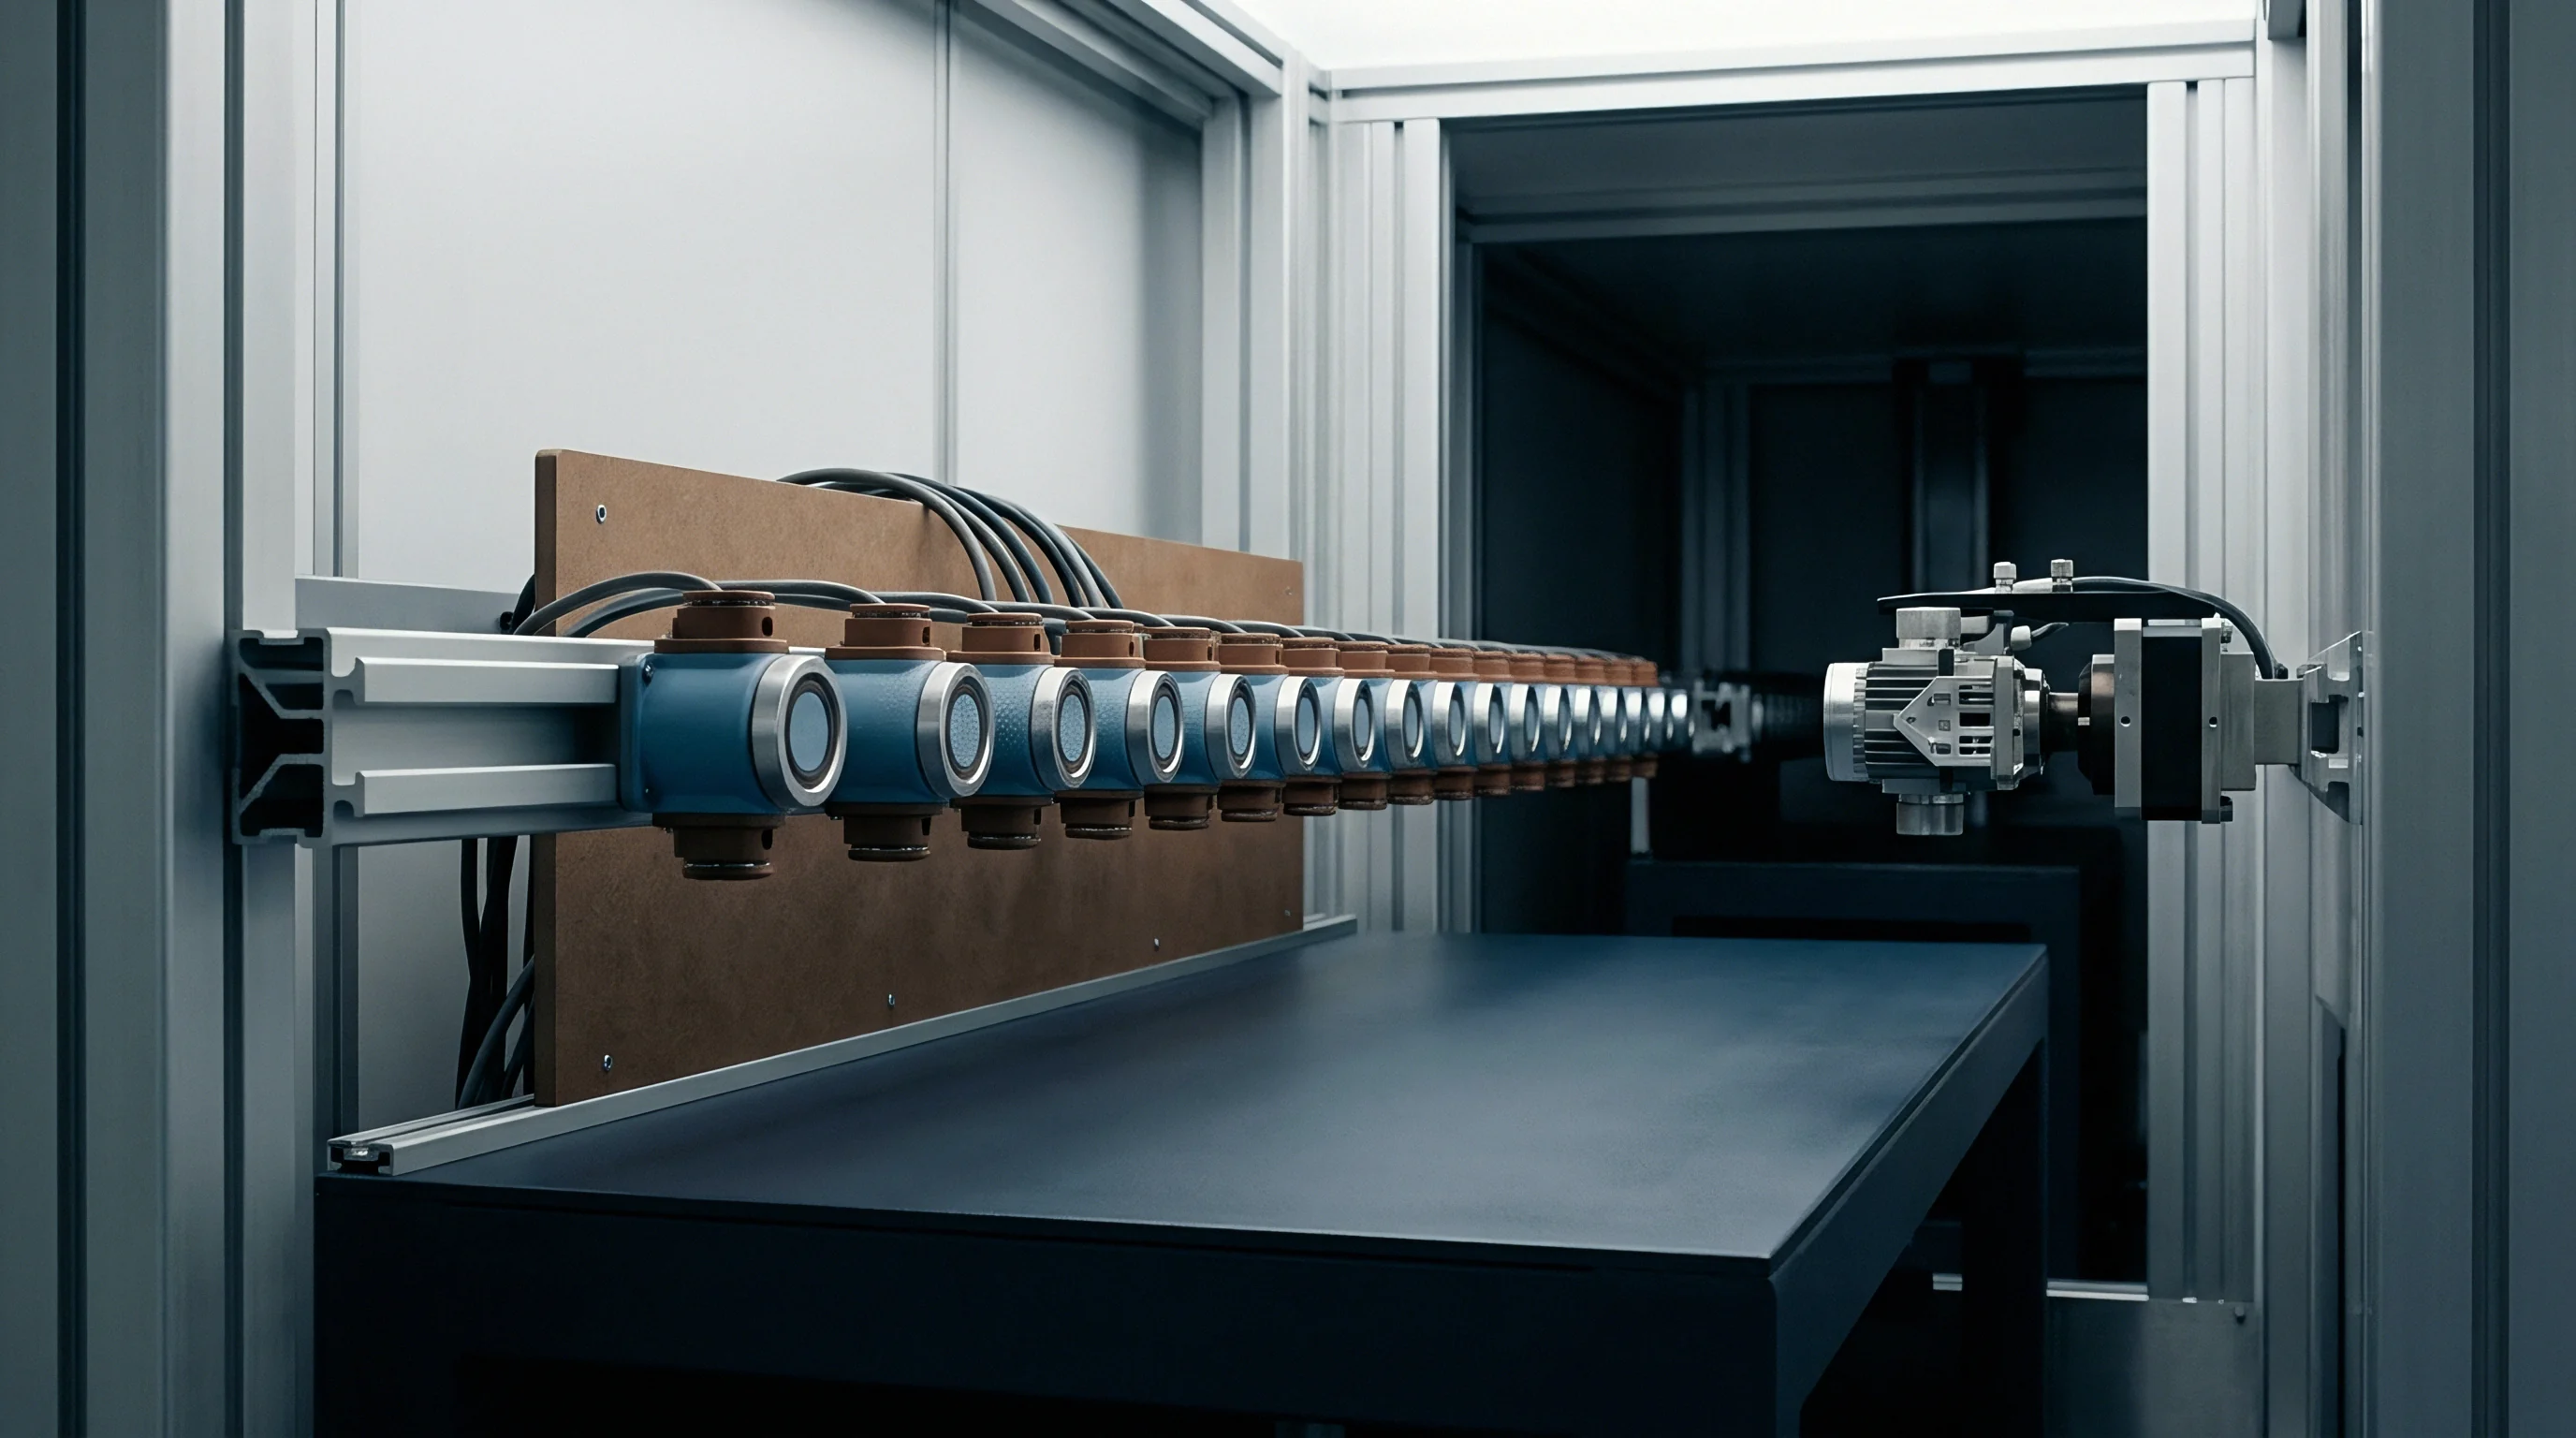
Separating genuine secular drift from bench artifacts is the central problem in sub-ppm metrology. Direct Current Comparator (DCC) bridges resolve ratios below 0.02 ppm by balancing ampere-turns on a toroidal core, while Quantum Hall Resistance (QHR) systems reproduce R_H(2) ≈ 12 906.4035 Ω with absolute uncertainties under 0.005 ppm.
Why Do Oil Bath Calibrations Diverge?
Oil immersion provides excellent thermal coupling between the winding and the bath. However, fluid circulation drags on unsupported wire loops, generating strain noise, and oil ingress into insulating enamels causes swelling and shunting leakage. Sealed air wells avoid fluid interaction entirely, though heat transfer to the environment drops by roughly a factor of four.
Self-heating corrections measured at one operating current fail when applied to different current levels because internal thermal equilibrium depends non-linearly on fluid convection.
Running a 10 kΩ element at 10 mW (10 V) heats the resistance wire above bath temperature. Internal thermal resistance θ_int spans from 0.02 K/mW in oil-filled cans to 0.15 K/mW in gel-cushioned air units, so a 10 mW load warms the alloy by 0.20 K to 1.50 K. If T_0 has migrated, this internal temperature rise shifts the measured value along the parabolic curve, producing an apparent power coefficient that masquerades as secular drift.
Sound calibration routines therefore rely on two-power checks. Running measurements at both 1 mW and 10 mW separates internal self-heating from actual resistance drift; without accounting for both T_0 and R_0 movement, applied corrections are largely fictitious.
Under ISO/IEC 17025 Clause 7.8.6, statements of conformity require documented decision rules, and ignoring the coupled migration of turnover temperature and baseline resistance invalidates stated compliance bounds well within twenty-four months.

Exposure
Ignoring thermal coefficient migration while specifying sub-ppm references causes expensive field and laboratory errors. Instrument builders using foil or wire references in 8.5-digit multimeters run into recall cycles when internal reference turnover points drift outside the firmware compensation curve. A part rated for ±0.5 ppm/year can exhaust its five-year tolerance budget in twenty-four months if chassis heat (40 °C to 50 °C) pushes T_0 out by 0.5 °C.
| Reference Grade | Initial Unit Acquisition | Annual QHR Traceability | Environmental Bath Maintenance | Total Ten-Year Ownership |
|---|---|---|---|---|
| Primary Oil-Immersion (0.05 ppm/year) | $4,800 | $1,200 | $1,500 | $31,800 |
| Hermetic Air-Well Wire (0.2 ppm/year) | $2,200 | $800 | $400 | $14,200 |
| Precision Bonded Foil (0.5 ppm/year) | $450 | $400 | $150 | $5,950 |
| Standard Foil Array (2.0 ppm/year) | $85 | $150 | $0 | $1,585 |
Extrapolating drift linearly to stretch calibration intervals does not work. Linear projections presuppose a fixed temperature coefficient. Once T_0 migrates, ambient laboratory cycles interact with the broadening α_eff, compounding measurement uncertainty.
Secondary standards audited against national labs end up with out-of-tolerance audit findings that call years of historical calibration certificates into question.
The financial impact is equally severe on automated converter test lines. Production test benches for precision ADCs depend on secondary references. When the reference turnover temperature moves away from ambient test-cell temperature, room swings create systematic offsets that fail acceptable parts, hit Cpk figures, and inflate scrap volume.
Without tracking baseline drift alongside turnover migration, laboratories face systematic measurement errors, voided calibration claims, and costly recall campaigns across downstream precision equipment.