Modeling High Temperature Package Creep Interfacial Strain Redistribution and Long Term Drift Uncertainty
High-temperature package creep redistributes interfacial strain to drive long-term sensor drift, requiring viscoplastic modeling and burn-in stabilization.
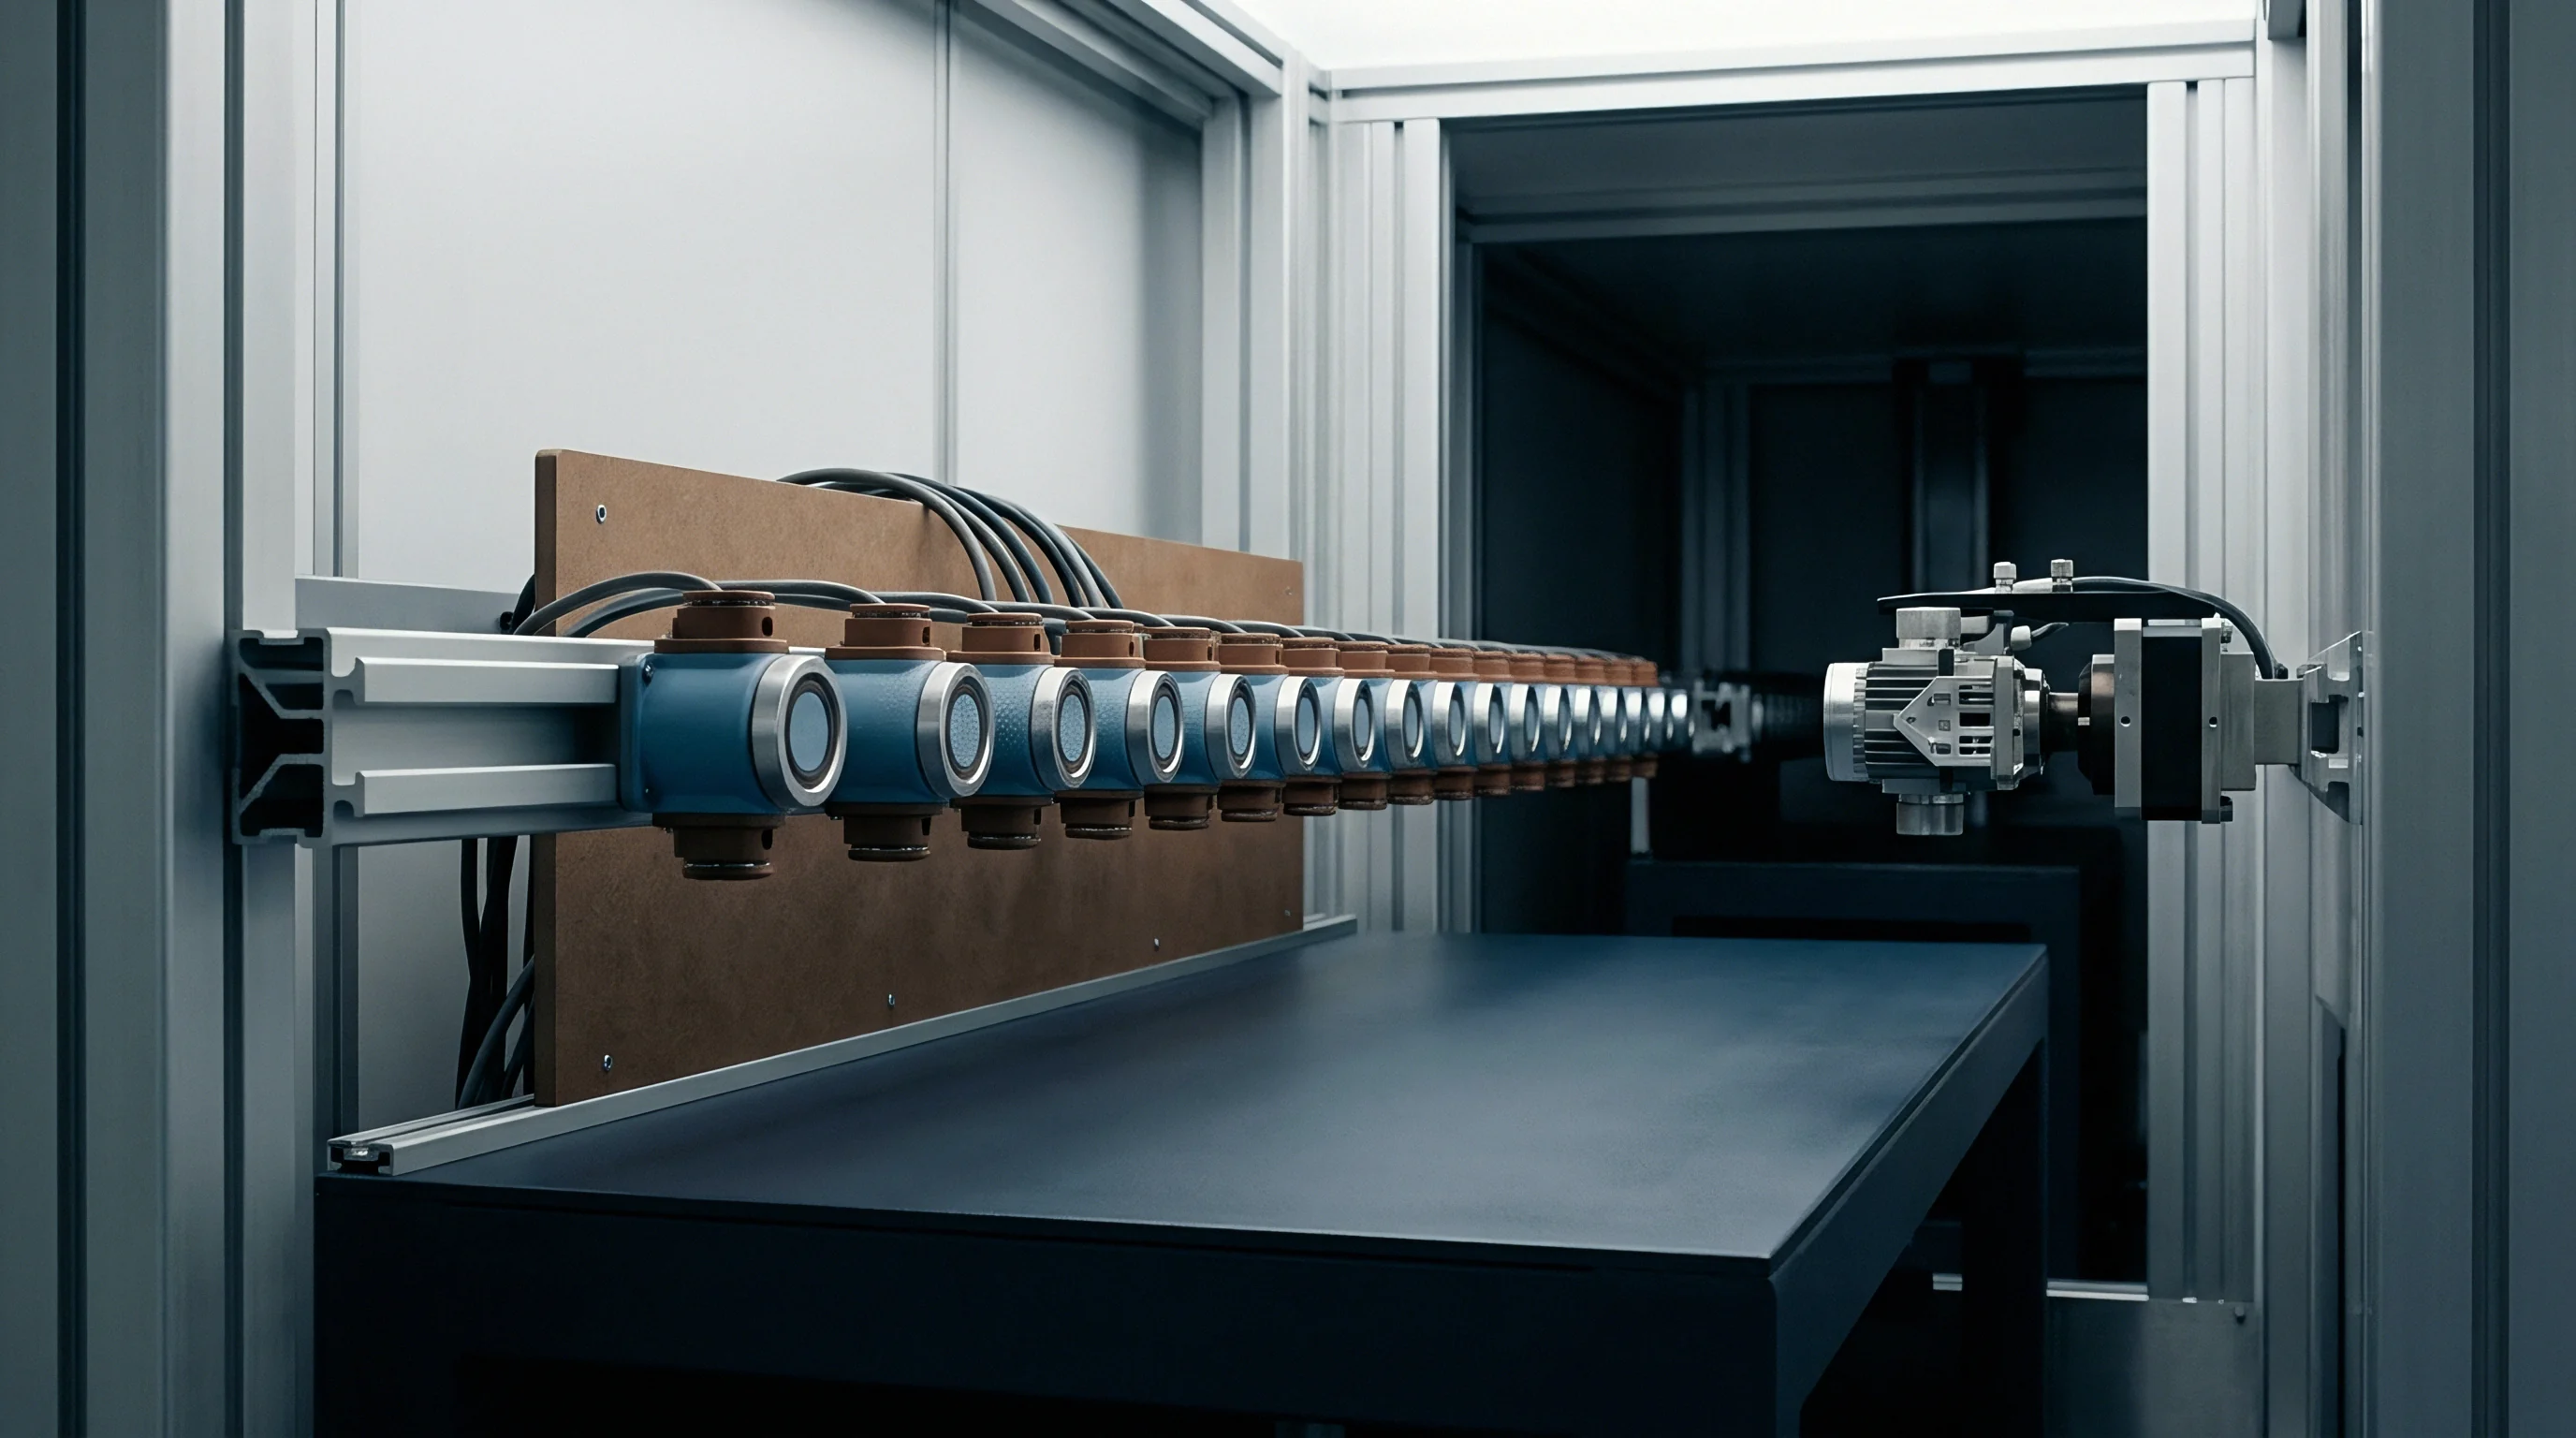

Shear
Operating at temperatures between 125 °C and 175 °C exposes semiconductor packaging materials to continuous inelastic deformation. As polymer matrices, solder interconnects, and adhesive die-attach layers undergo creep and stress relaxation, internal stresses established during high-temperature encapsulation shift over time. Over extended service, this progressive relaxation alters the mechanical boundary conditions surrounding the active silicon sensor element.
This stress decay progresses continuously under sustained thermal exposure.
In high-precision devices like piezoresistive pressure transducers, capacitive MEMS accelerometers, and integrated voltage references, the active micro-transducer is joined directly to a substrate or leadframe using metallic solder or organic adhesive. Thermal expansion mismatch between silicon (2.6 ppm/K) and copper alloy leadframes (16.5 ppm/K) creates severe localized loads across this joint at elevated temperatures. Molding compounds lock in these stresses during their 150 °C to 175 °C cure cycle.
Whether sitting at room temperature or undergoing continuous thermal service, the assembly gradually relaxes toward thermodynamic equilibrium through atomic diffusion, dislocation climb, and polymer chain slip.
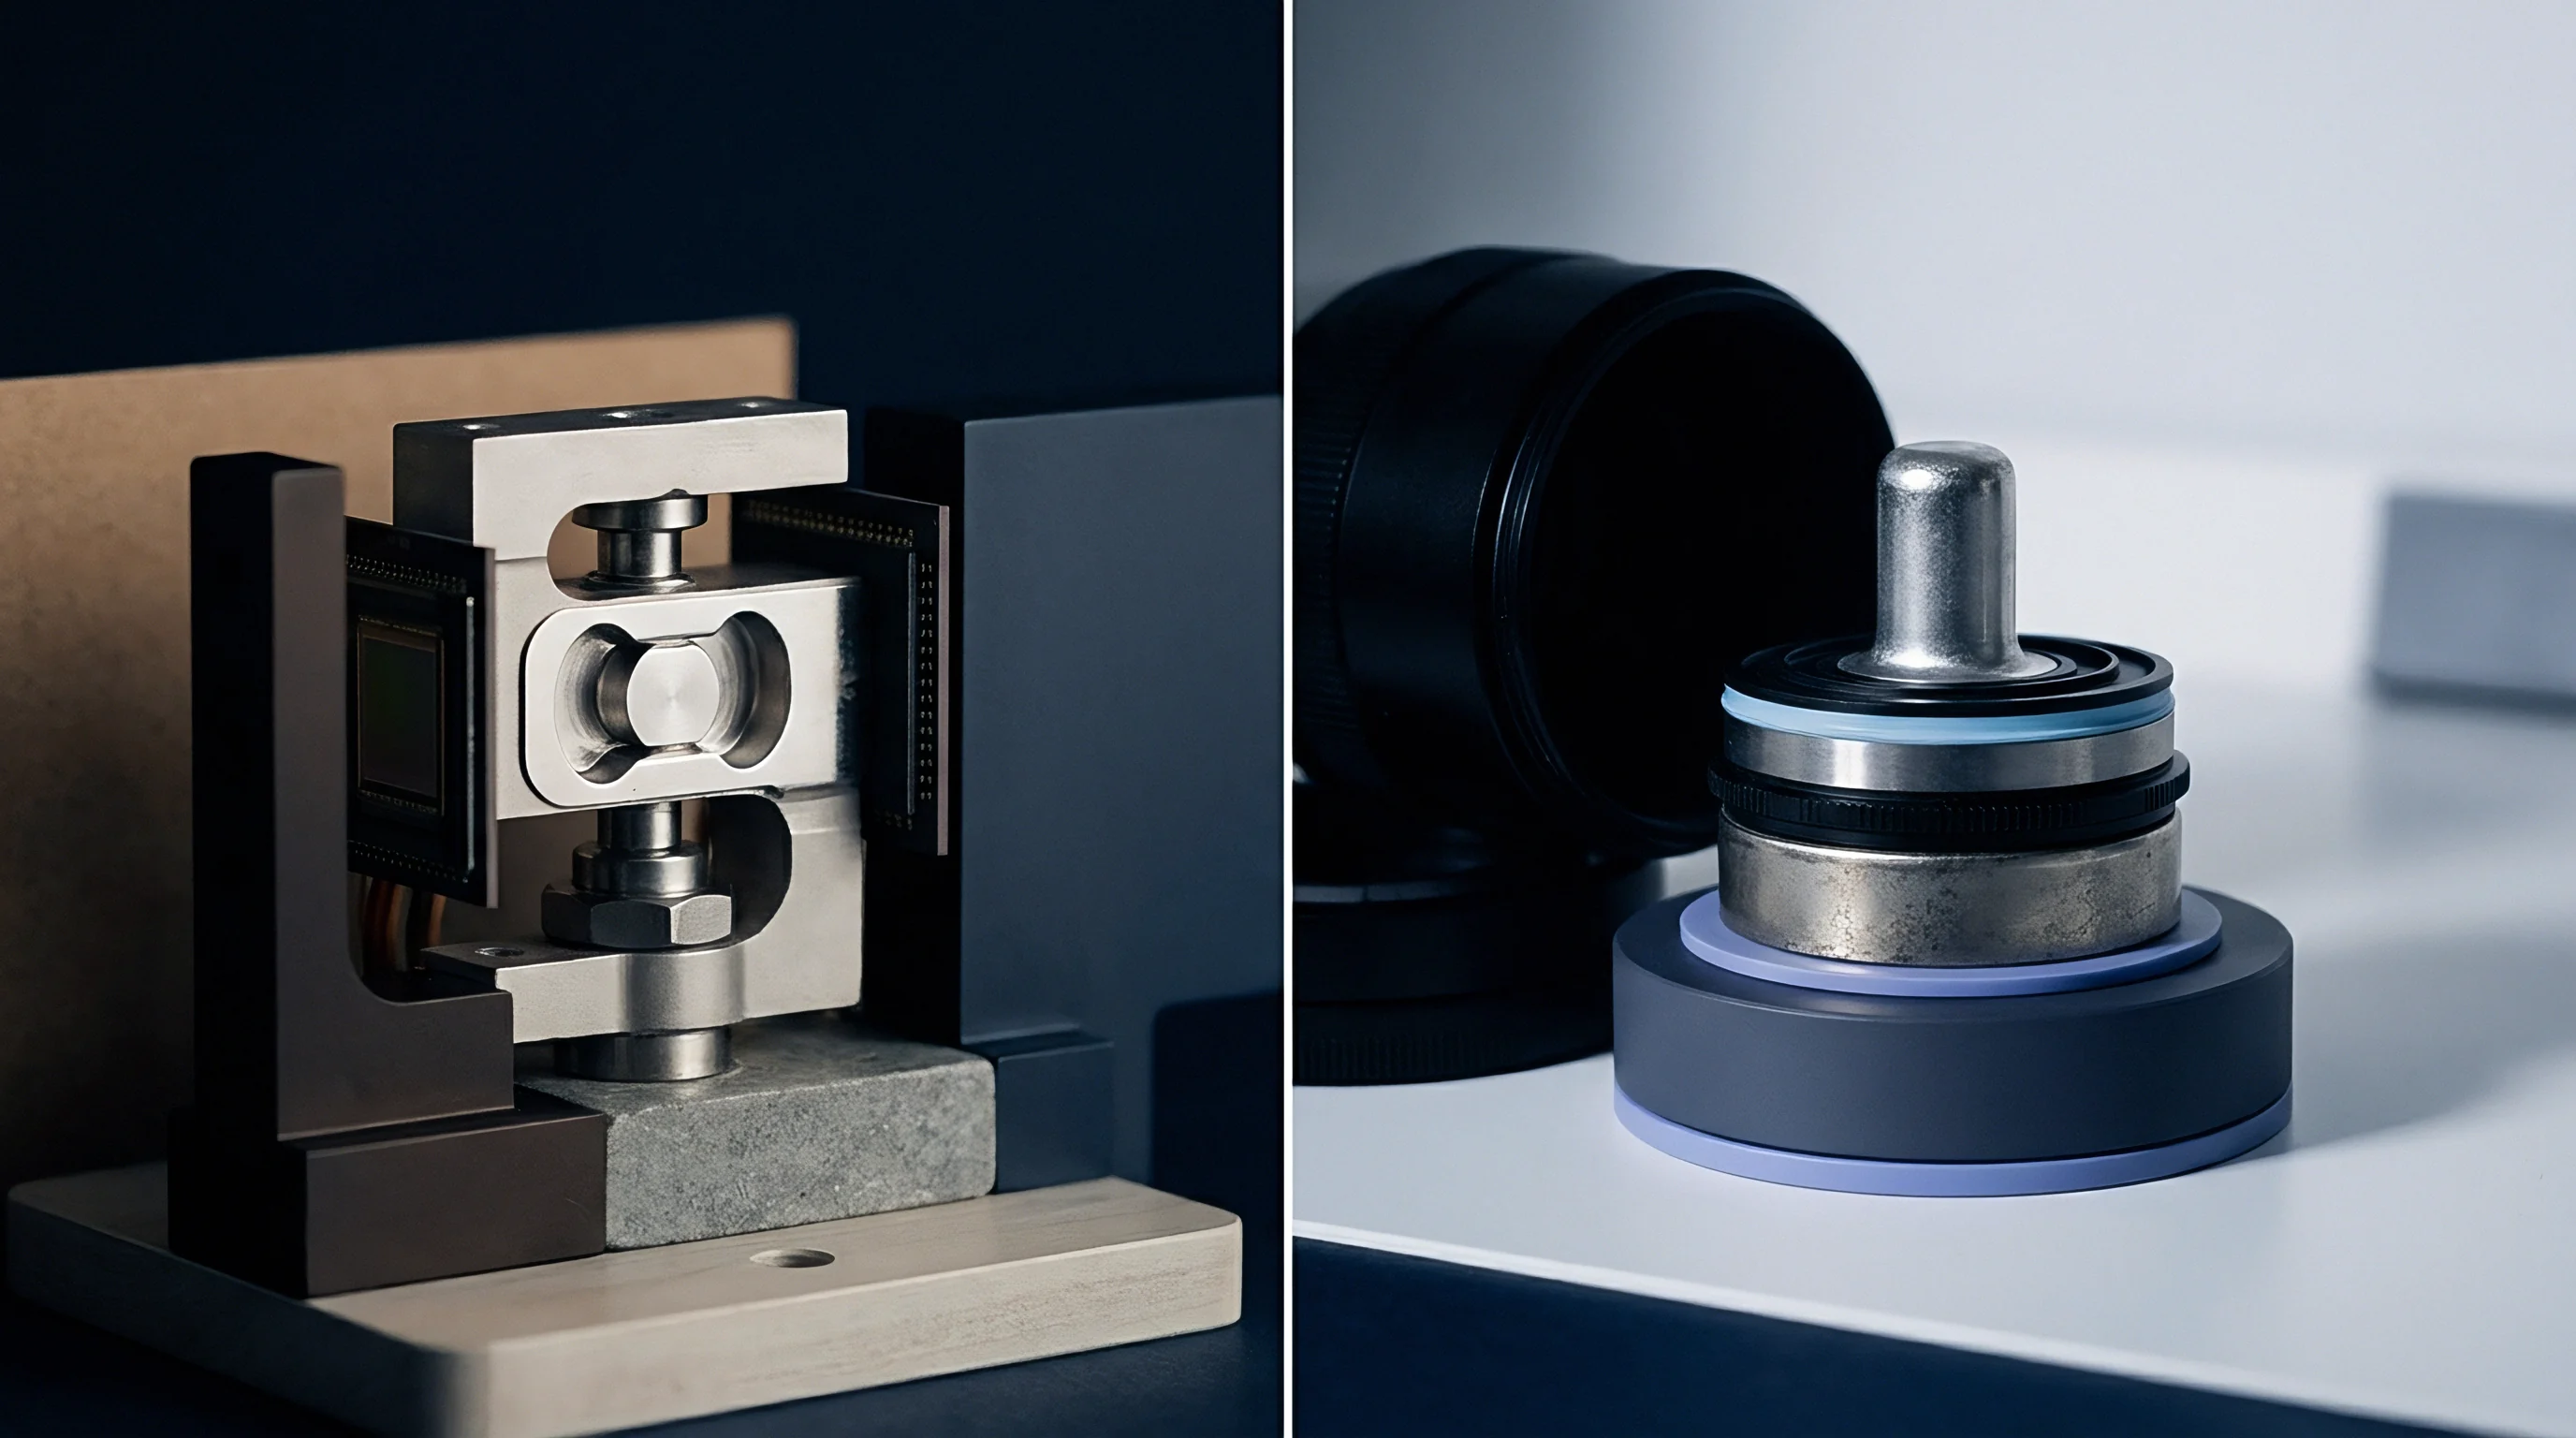
Constitutive Formulations for Packaging Interconnects
Predicting time-dependent inelastic response in packaging materials generally relies on unified viscoplastic formulations. The Anand model, for instance, captures both rate-dependent plastic deformation and thermal recovery in lead-free solders such as SAC305 subjected to thermal stress. By unifying creep and rate-independent plasticity into a single set of rate equations, it bypasses the need for an explicit yield surface.
Here the plastic strain rate tensor depends on an effective stress term alongside a single internal scalar variable representing deformation resistance. The flow equation governing inelastic strain rate takes the form:
dε_p / dt = A · exp(-Q / (R · T)) · ^(1/m)
In this expression, dε_p / dt represents the inelastic strain rate, A is the pre-exponential material multiplier, Q is the activation energy for atomic diffusion, R is the universal gas constant, T is absolute temperature in Kelvin, ξ is the stress multiplier, σ is equivalent von Mises stress, s is the internal deformation resistance state variable, and m is the strain rate sensitivity exponent. Evolution of state variable s balances hardening against dynamic recovery:
ds / dt = h_0 · |1 – s / s_hat|^a · sign(1 – s / s_hat) · (dε_p / dt)
In this relation, h_0 represents the hardening constant, s_hat denotes the saturation value of deformation resistance, and a is the strain hardening sensitivity parameter. Table 1 summarizes representative constitutive parameters for packaging interconnect materials at 150 °C.
| Material Parameter | Symbol | SAC305 Lead-Free Solder | High-Lead Die Attach (Pb92.5Sn5Ag2.5) | Conductive Epoxy Adhesive |
|---|---|---|---|---|
| Initial Deformation Resistance (MPa) | s_0 | 12.41 | 8.50 | 35.20 |
| Activation Energy (kJ/mol) | Q | 87.30 | 62.10 | 45.80 |
| Pre-exponential Factor (1/s) | A | 2.23e4 | 1.15e3 | 4.80e2 |
| Stress Multiplier (dimensionless) | ξ | 7.00 | 4.20 | 1.85 |
| Strain Rate Sensitivity | m | 0.233 | 0.185 | 0.310 |
| Hardening Constant (MPa) | h_0 | 1800.00 | 950.00 | 120.00 |
| Saturation Resistance (MPa) | s_hat | 40.15 | 22.40 | 48.50 |
Once internal strain hardening saturates into steady-state creep, analysis typically shifts to the Garofalo hyperbolic sine formulation, which spans both low-stress power-law creep and high-stress power-law breakdown regimes. The corresponding strain rate equation is:
dε_ss / dt = C_1 · ^n · exp(-Q_a / (R · T))
Where C_1 is a structural creep constant, C_2 is the stress scaling parameter, n is the stress exponent, and Q_a is the apparent creep activation energy. Over thousands of operating hours at elevated temperatures, these creep dynamics gradually relieve peak interfacial shear stresses. As joint stiffness yields, the rigid constraint on the silicon die relaxes, altering the residual strain field surrounding active sensing elements on the chip surface.

Primary and Secondary Viscoplastic Regimes
Transient response in die-attach layers opens with primary creep, where initial strain rates are high but slow rapidly as work hardening accumulates within the alloy microstructure or polymer matrix. During the first 100 to 200 hours at 150 °C, this primary regime governs the package’s mechanical evolution.
This initial transient phase gives way relatively early in the component’s operating life.
Sustained thermal exposure transitions the material into secondary creep, where work hardening balances dynamic recovery to establish a nearly constant strain rate over time. Elevated operating temperatures accelerate this secondary creep, redistributing high corner stress concentrations into broader, lower-magnitude strains. That redistribution shifts the assembly’s neutral axis and introduces subtle micro-rotations across piezoresistive sensing bridges.
Initial thermal reflow does not fully eliminate package stress, as long-term creep strain continues to transfer into active die regions over time.
Evaluations of component stability relying on high-temperature storage data from brief 168-hour or 500-hour cycles often assume internal stresses reach equilibrium following post-mold curing. Extended testing reveals that viscoelastic relaxation and secondary creep continue past 5,000 thermal operating hours, steadily altering the internal strain field surrounding the embedded transducer chip.
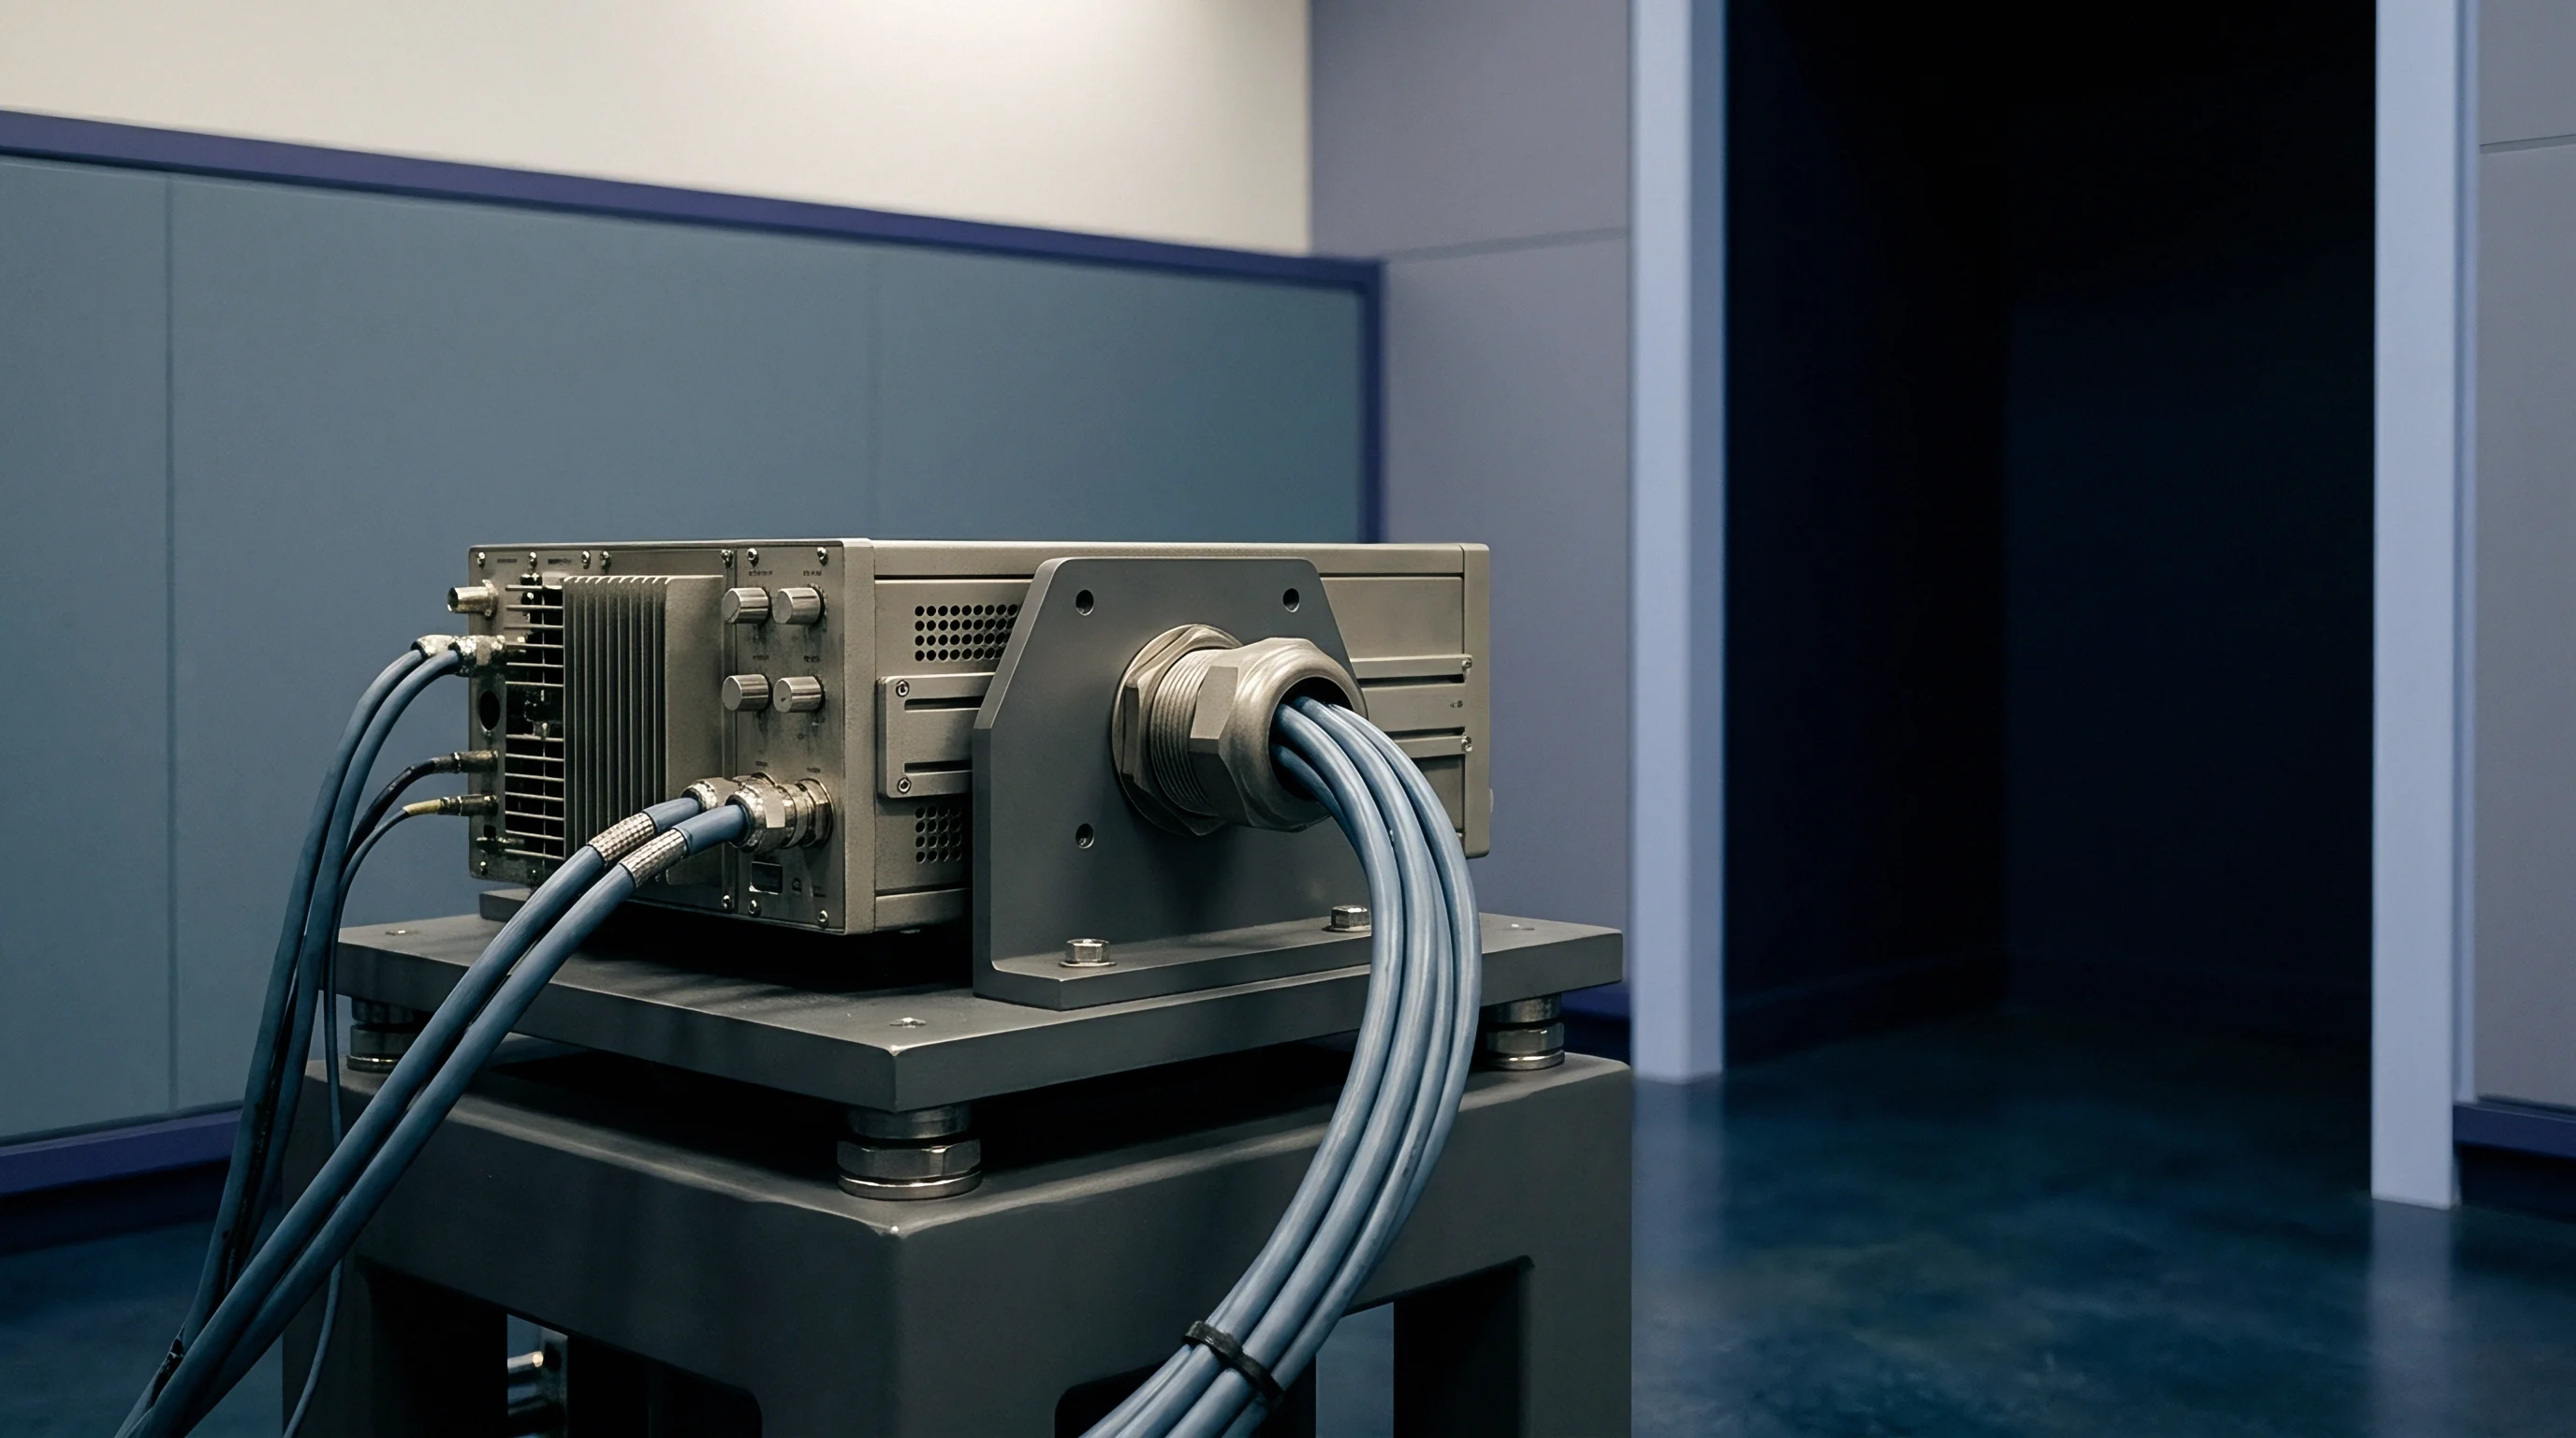

Interface
Mechanical stress coupling across heterogeneous material layers dictates long-term package deformation. Modern sensor packaging bonds materials with wildly disparate elastic moduli, coefficients of thermal expansion, and viscoelastic relaxation characteristics. While silicon transducers exhibit near-perfect linear elasticity up to brittle failure, adjacent epoxy molding compounds, underfills, and die-attach polymers soften and relax over time in a strongly temperature-dependent manner.
Differential thermal expansion initiates these internal structural deformations.
The magnitude of strain transferred across bonded interfaces depends directly on differential thermal expansion. Silicon expands conservatively at roughly 2.6 ppm/K, whereas organic substrate laminates expand at 14 ppm/K to 18 ppm/K in-plane and copper alloy leadframes expand at 16.5 ppm/K. Molding compounds exhibit two distinct expansion regimes, rising from 10 ppm/K to 15 ppm/K below their glass transition temperature up to 35 ppm/K or 50 ppm/K once above it.
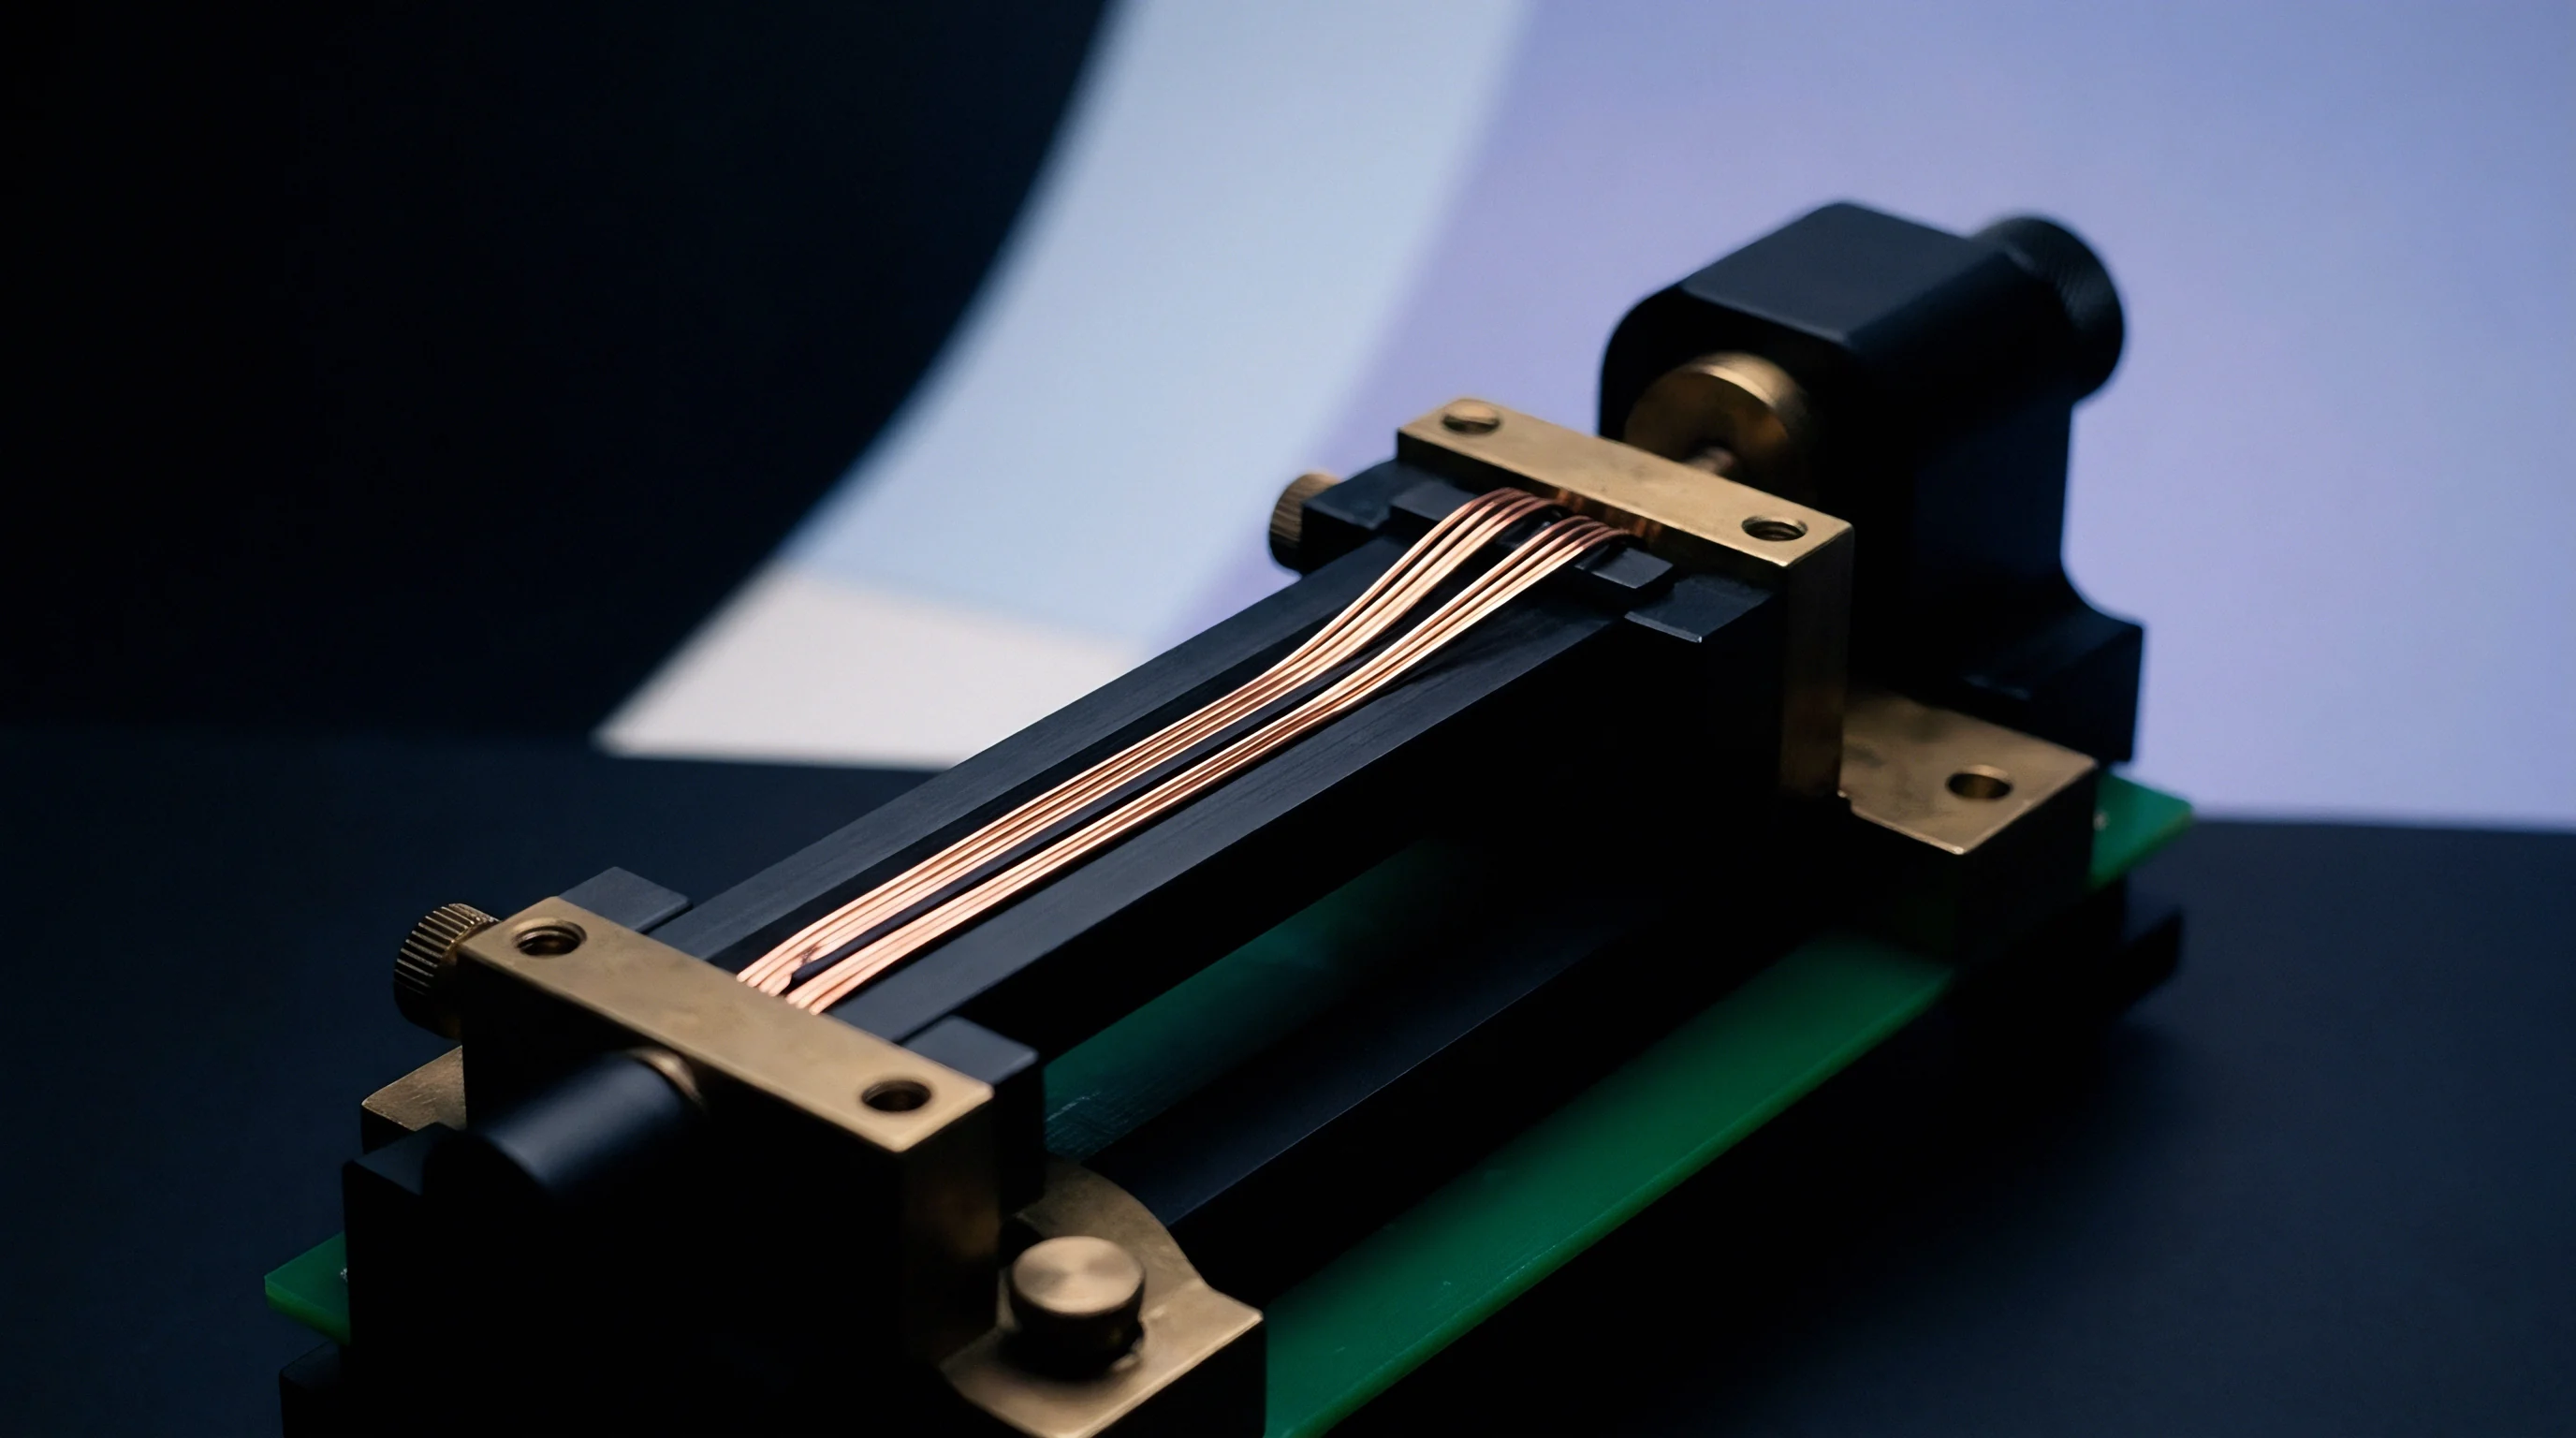
Thermal Expansion Mismatch Mechanics
Thermal expansion mismatch during thermal cycling and high-temperature storage generates interfacial shear stress that concentrates at the corners of a square silicon die. Peak edge shear stress τ_max can be estimated through a modified Suhir elastic beam formulation:
τ_max = (Δα · ΔT / (κ · cosh(k · l))) · sinh(k · x)
In this formulation, Δα represents the mismatch in thermal expansion coefficients between die and substrate, ΔT is the temperature excursion from zero-stress conditions, l is half the die width, x is distance from die center, and κ and k are compliance terms derived from material thicknesses and shear moduli. Longitudinal compliance κ is defined as:
κ = (d_1 / G_1) + (d_2 / G_2) + 2 · (d_a / G_a)
Where d_1, d_2, and d_a denote die, substrate, and adhesive layer thicknesses, and G_1, G_2, and G_a represent their respective shear moduli. As elevated temperatures induce creep in the adhesive, its effective shear modulus G_a falls by orders of magnitude. Longitudinal compliance κ increases as a result, lowering peak edge shear stress τ_max while spreading the strain field deeper toward the center of the die.
- Interfacial shear relaxation reduces corner stress peaks while expanding the affected strain area into central die regions where active sensing elements reside.
- Mold compound post-cure shrinkage generates compressive lateral stresses that continue to accumulate over 2,000 hours of thermal aging.
- Adhesive delamination propagation introduces localized strain relief zones, creating asymmetric bending moments across piezoresistive sensing bridges.
- Substrate glass transition shifting alters the bulk stiffness of the package frame, changing the strain transfer ratio during ambient temperature excursions.
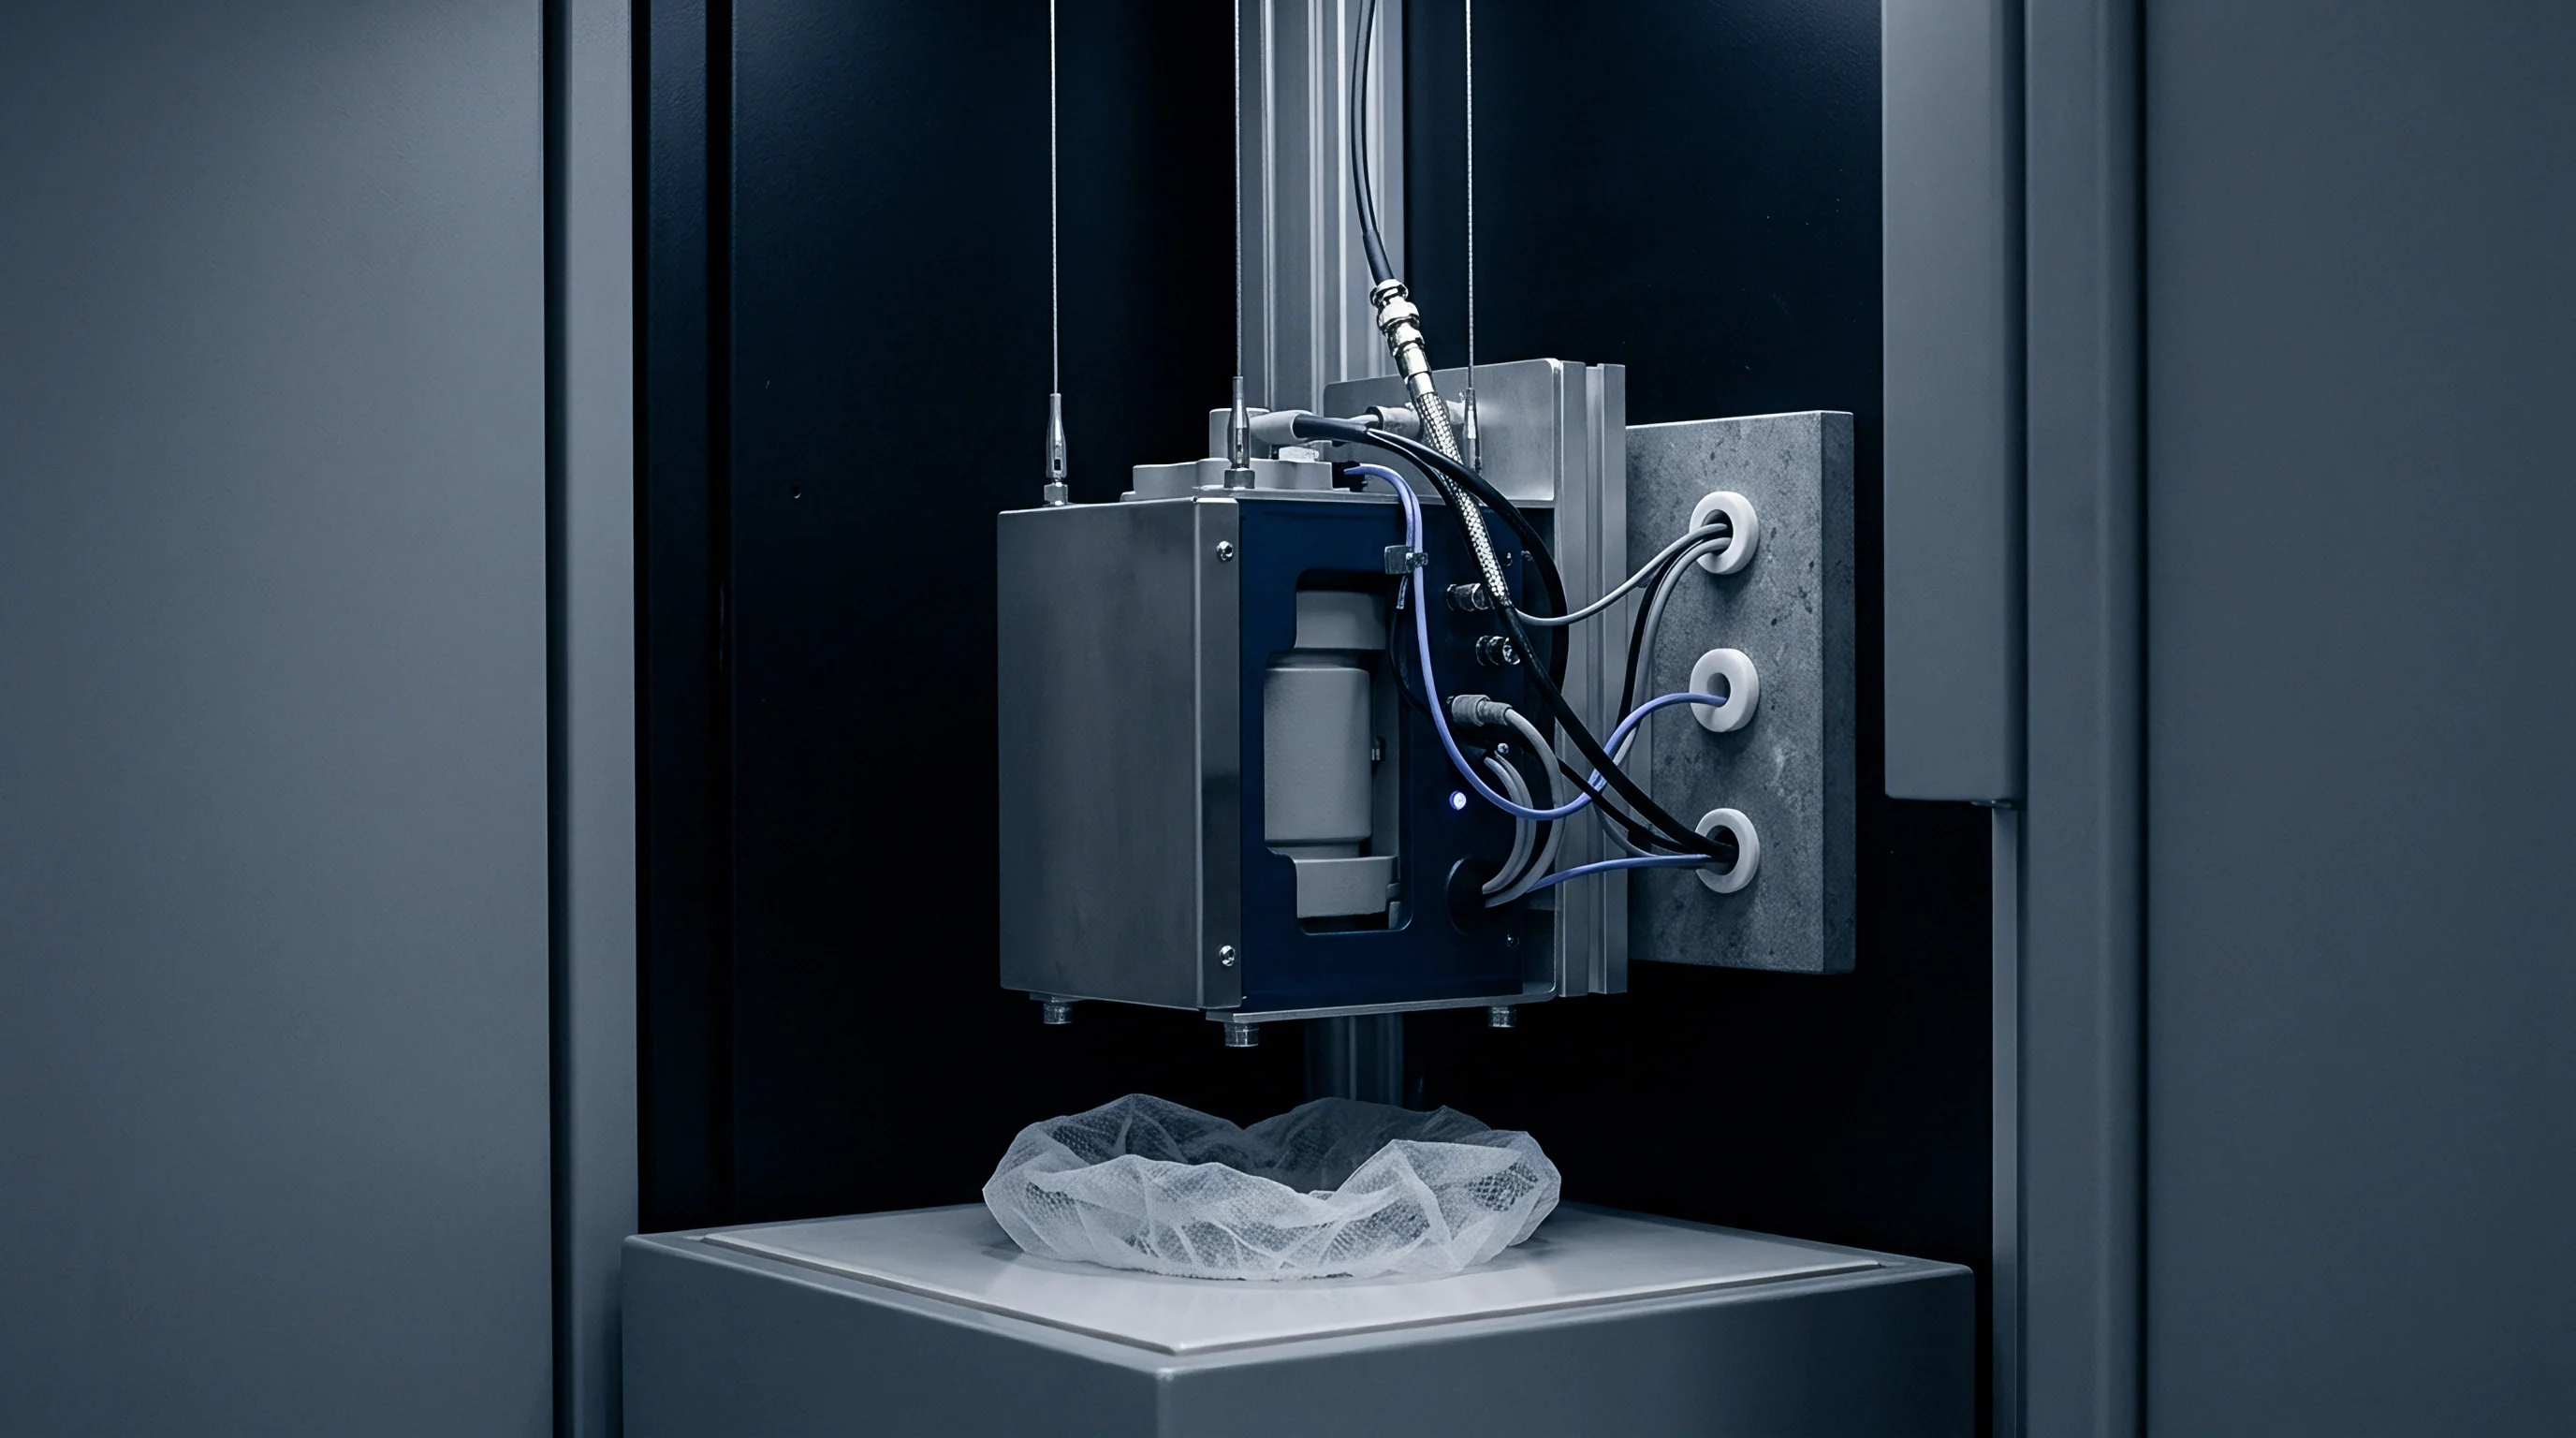
Polymeric Modulus Decay above Glass Transition
Epoxy molding compounds and organic die-attach adhesives lose stiffness rapidly as temperatures approach or exceed their glass transition point. The storage modulus E’ quantifies elastic energy storage, whereas the loss modulus E” captures viscous dissipation; their ratio defines the mechanical loss factor, tan(δ) = E” / E’. Below glass transition, the polymer remains in a glassy state with high storage modulus values ranging from 15 GPa to 25 GPa.
Under mechanical loading, these epoxy systems relax continuously over time.
When temperatures enter the glass transition region, increased polymer chain mobility drops the storage modulus onto a rubbery plateau between 0.5 GPa and 2 GPa. This softening rapidly relieves locked-in processing stresses, but as the mold compound relaxes, strain shifts into neighboring structural layers. The time-dependent storage modulus E'(t) is represented using a generalized Maxwell series:
E'(t) = E_infinity + SUM
Where E_infinity is the long-term rubbery modulus, E_i represents the relaxation strength of mode i, and τ_i is its characteristic relaxation time constant. Above glass transition, the temperature dependence of relaxation times τ_i follows the Williams-Landel-Ferry relationship:
log10(a_T) = -C_1 · (T – T_g) / (C_2 + (T – T_g))
In this equation, a_T is the shift factor relative to baseline temperature T_g, incorporating empirical constants C_1 and C_2. Because shift factors directly govern stress decay rates, even modest thermal fluctuations noticeably alter the pace of strain redistribution.
Thousands of operating hours under continuous heat permanently alter the boundary conditions acting on the silicon die. Factory calibration captures the sensor only in its initial stress state. If three years of industrial service relax the polymer matrix and shift surrounding stress fields, the physical strain state of the active sensing element alters along with them, producing uncompensated zero-point drift.
While interfacial creep relieves extreme corner stress concentrations, it steadily drives strain inward toward central die regions.


Transduction
Micro-electro-mechanical sensors convert mechanical deformation of active crystal structures into electrical signals. In piezoresistive silicon transducers, strain applied to the crystal lattice changes electrical resistivity. When packaging creep redistributes strain across the chip, the Wheatstone bridge records that structural relaxation as an apparent shift in measured physical pressure.
Silicon maintains predictable linear elastic behavior under standard packaging stress.
Relative resistance change ΔR / R_0 in a piezoresistive element aligned along a chosen crystallographic axis depends on tensor coefficients π_ij together with longitudinal stress σ_L and transverse stress σ_T:
ΔR / R_0 = π_L · σ_L + π_T · σ_T
For p-type silicon resistors on a (100) plane aligned along the crystallographic axis, the longitudinal and transverse coefficients simplify to combinations of fundamental tensor terms π_11, π_12, and π_44:
π_L = 0.5 · (π_11 + π_12 + π_44)
π_T = 0.5 · (π_11 + π_12 – π_44)

Piezoresistive Coupling to Package Stress
Uncompensated package stress maps directly into electrical offset drift. Standard four-resistor Wheatstone bridge layouts position elements symmetrically so that uniform background stress shifts all four arms equally, preserving initial zero balance. In actual packaging, viscoelastic relaxation across die-attach adhesives and mold compounds is rarely uniform.
Elevated operating temperatures accelerate underlying atomic diffusion mechanisms.
Adhesive voiding, uneven fillet profiles, and localized corner delamination disrupt stress symmetry across the die. As viscoelastic relaxation progresses at 150 °C, evolving shear stress gradients alter local stresses σ_L and σ_T at individual resistor locations. The resulting resistance imbalance produces zero-offset voltage drift across the bridge output.
For a Wheatstone bridge driven by supply voltage V_in, the offset drift voltage V_drift is:
V_drift = 0.25 · V_in ·
Combining stress-to-resistance coupling into the offset expression ties localized stress changes Δσ directly to output drift:
V_drift = 0.5 · V_in · π_44 ·
Given that p-type silicon possesses a strong shear piezoresistive coefficient π_44 (approximately +138.1e-11 Pa^-1 at room temperature), stress relaxation imbalances as small as 0.1 MPa across the bridge produce measurable output drift. Standard epoxy die-attach formulations exhibit roughly 0.04% full-scale shift per 1,000 hours at 150 °C.

Long Term Zero Point Drift Kinetics
Long-term offset drift trajectories are non-linear, reflecting multi-stage creep dynamics. Initial stress relief within the die-attach layer produces a steep early drift rate, but as strain redistribution penetrates surrounding package materials, the rate of signal change transitions into logarithmic decay.
Laboratory verification confirmed a zero-offset drift rate of 0.12% full-scale span per 1,000 hours at 150 °C under steady-state creep conditions.
Interfacial creep impacts more than zero-point offset ~ it also alters full-scale span sensitivity. Beyond direct thermal variation in piezoresistive coefficients, structural diaphragm bending induced by asymmetric package relaxation changes mechanical gain. As pre-stress in the package decays, the diaphragm’s deflection response under applied pressure or acceleration alters accordingly.
Failing to account for interfacial strain redistribution leads directly to out-of-spec field performance, prompting early warranty returns and invalidating factory calibration long before component design life is reached.


Variance
Quantifying long-term drift uncertainty requires combining deterministic creep equations with stochastic material variability. In production environments, lot-to-lot variations in epoxy polymerization degree, filler particle distributions, solder void percentages, and die-attach bondline thickness introduce significant scatter into constitutive creep parameters.
This parametric uncertainty broadens continuously over long operating durations.
Evaluating total drift uncertainty involves propagating material parameter distributions through viscoplastic finite element models or analytical strain-transfer formulations. Standard frameworks like the Guide to the Expression of Uncertainty in Measurement (GUM) provide foundational methodology, though non-linear mechanical interactions frequently demand Monte Carlo simulation to establish realistic confidence intervals for 5-year signal drift.

How Does Interfacial Strain Decay Map to Drift?
Mapping stress relaxation kinetics into measurement uncertainty begins with defining probability distributions for primary creep parameters. Activation energy Q, stress exponent n, and initial deformation resistance s_0 fluctuate across polymer and solder batches, making sensitivity analysis essential to identify which variables drive overall drift uncertainty.
Table 2 breaks down the relative contribution of individual parameter variations to zero-offset drift uncertainty after 5,000 hours at 150 °C.
| Uncertainty Source | Distribution Type | Standard Uncertainty u(x_i) | Sensitivity Coefficient c_i | Uncertainty Contribution u_i(y) (% FS) |
|---|---|---|---|---|
| Activation Energy Q (kJ/mol) | Normal | ± 3.20 kJ/mol | 0.042 % FS / (kJ/mol) | 0.1344 |
| Creep Stress Exponent n | Normal | ± 0.25 dimensionless | 0.180 % FS / unit exponent | 0.0450 |
| Bondline Thickness d_a (µm) | Rectangular | ± 2.50 µm | 0.028 % FS / µm | 0.0700 |
| Die Attach Void Fraction (%) | Triangular | ± 4.00 % area | 0.035 % FS / % void | 0.1400 |
| Mold Compound T_g (°C) | Normal | ± 4.50 °C | 0.019 % FS / °C | 0.0855 |
| Die Alignment Offset (µm) | Normal | ± 8.00 µm | 0.012 % FS / µm | 0.0960 |
| Combined Standard Uncertainty u_c | Normal | Root Sum Squares | Not Applicable | ± 0.2452 % FS |
| Expanded Uncertainty U (k = 2) | Normal (95% coverage) | Coverage factor = 2 | Not Applicable | ± 0.4904 % FS |
Monte Carlo simulations propagate parameter variations by repeatedly solving strain redistribution equations across randomly sampled input vectors. Compiling 10,000 iterations constructs a continuous probability density function for expected long-term drift, revealing that scatter in activation energy Q and die-attach void percentage contributes most heavily to total output variance.
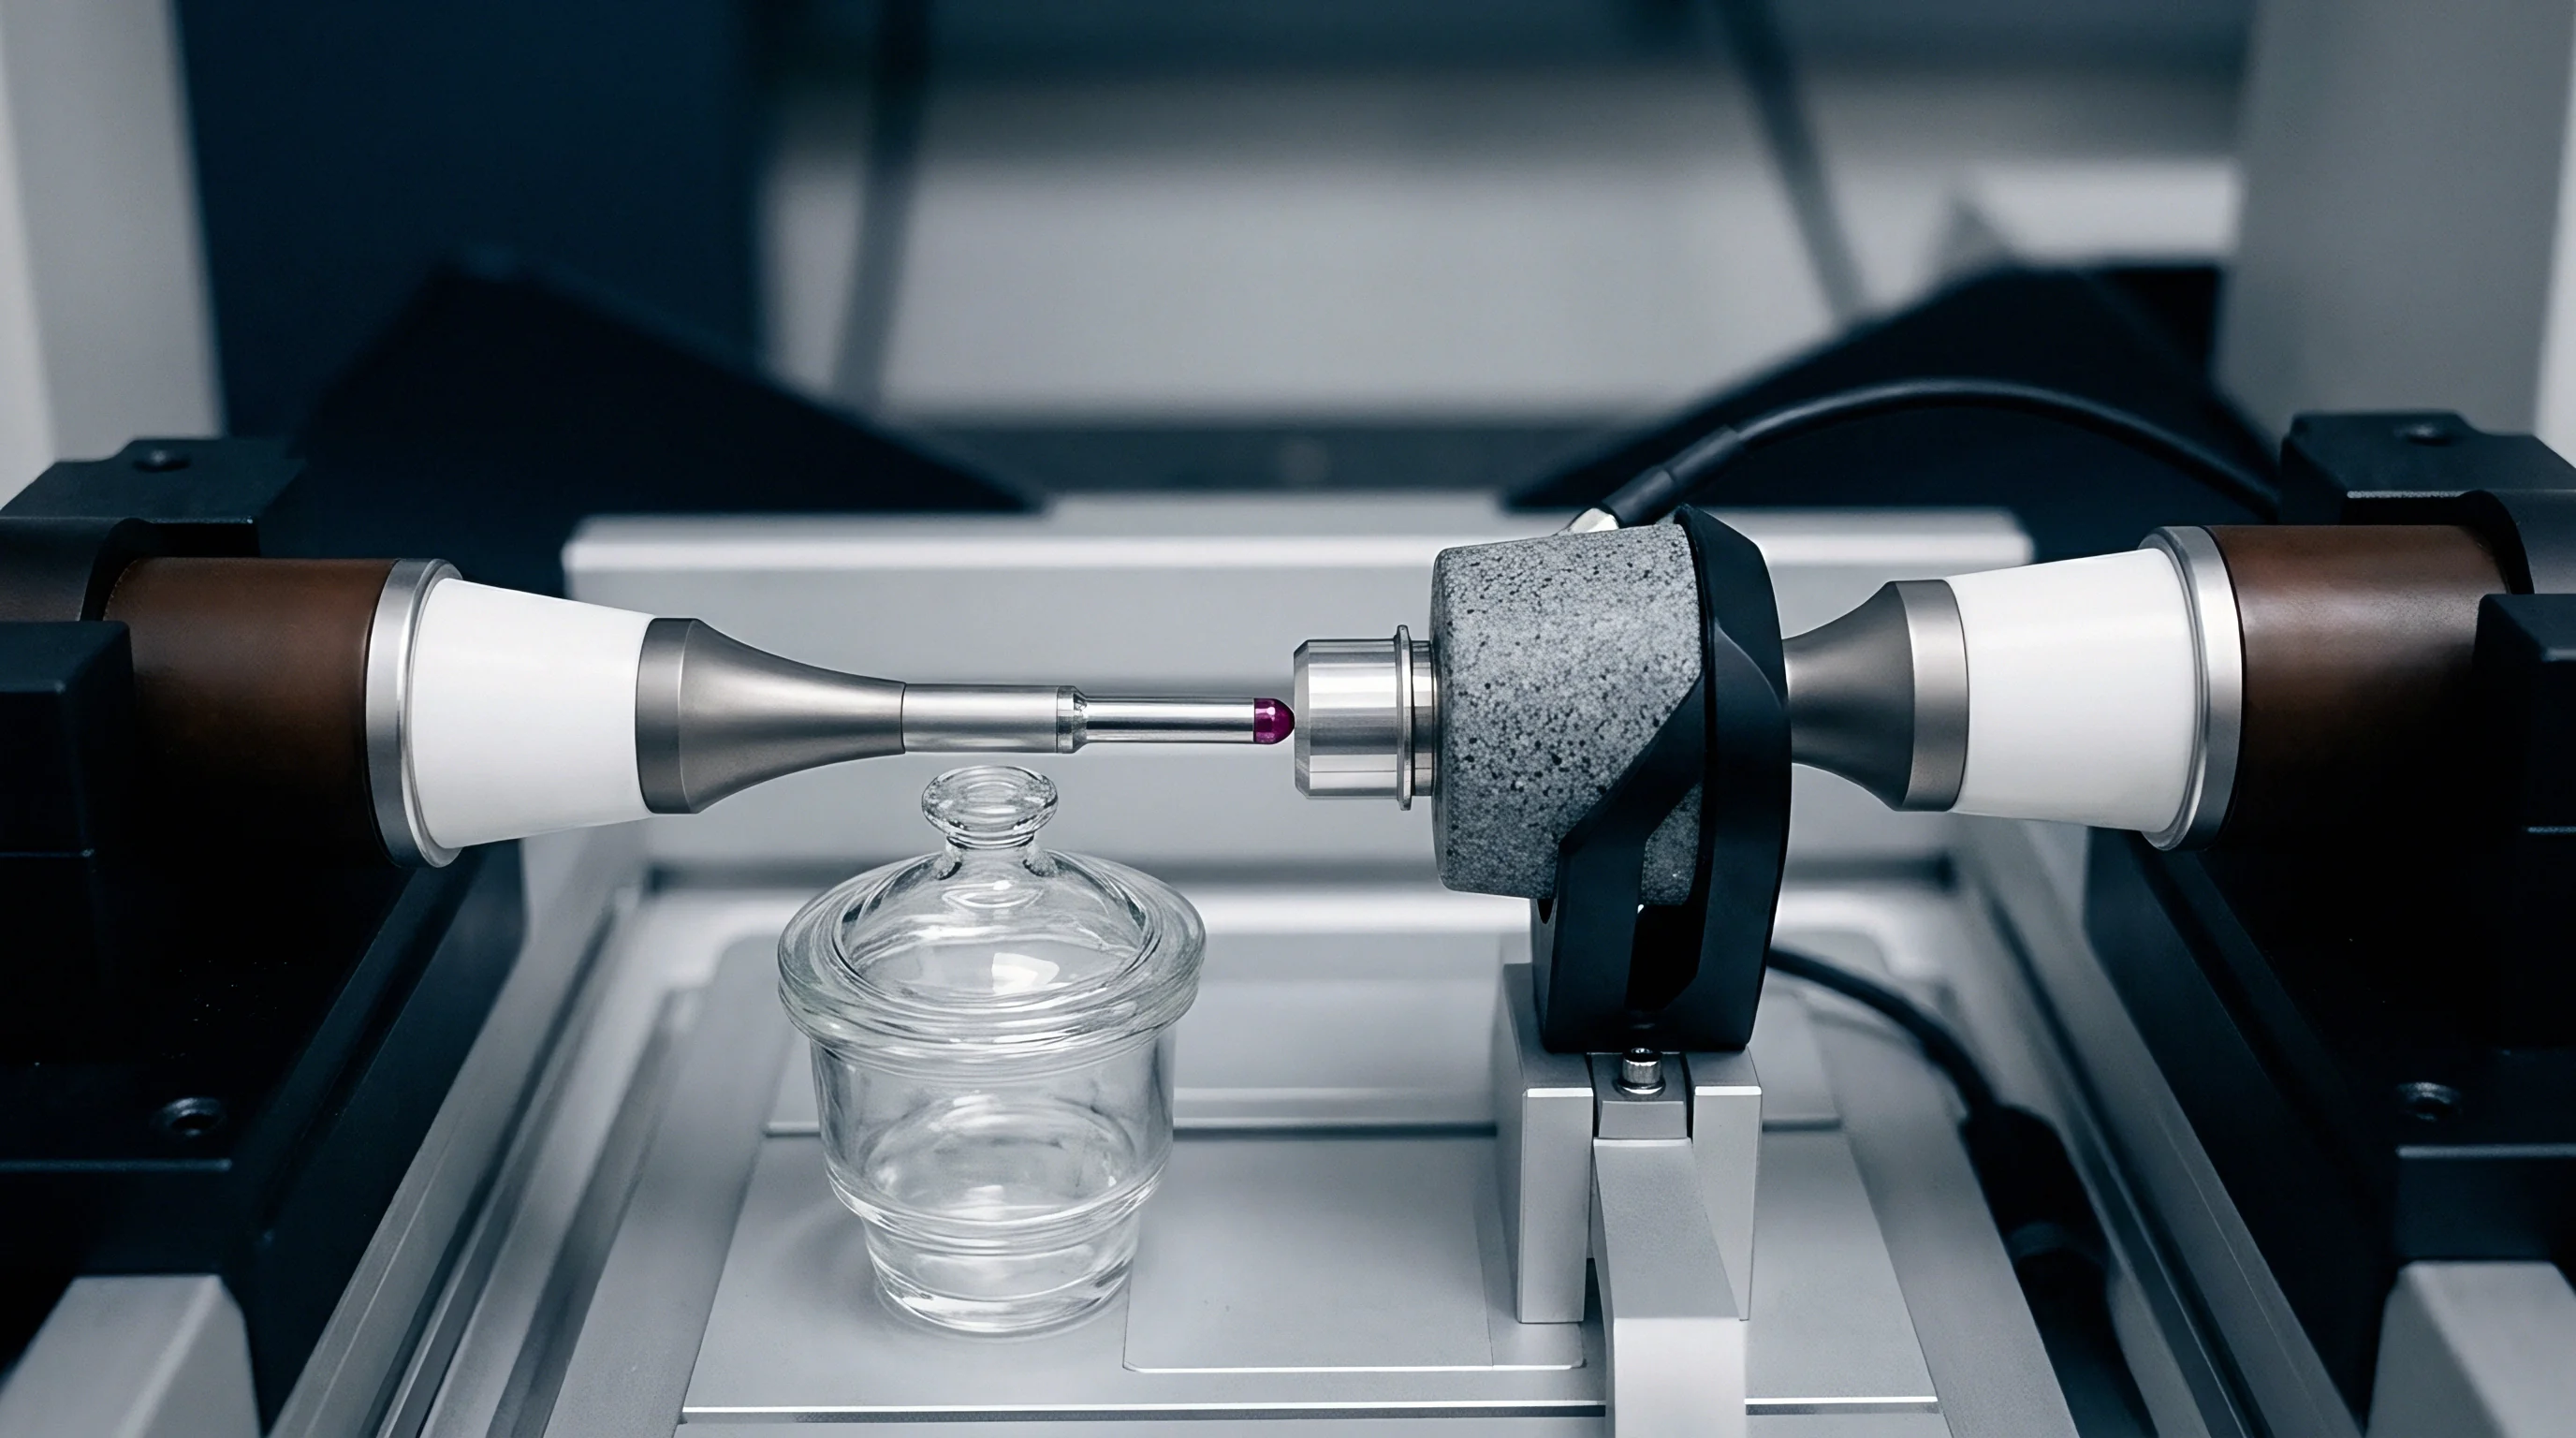
Uncertainty Budgeting for Long Term Drift
Building a robust calibration dossier requires converting standard laboratory uncertainties into time-dependent drift functions. The combined standard uncertainty u_c(y) for predicted drift y over operating time t combines individual uncertainties u(x_i) using partial derivatives as sensitivity coefficients c_i = ∂f / ∂x_i:
u_c^2(y) = SUM + 2 · SUM
When parameters share manufacturing roots ~ for instance, thermal curing profiles affecting both glass transition temperature T_g and initial modulus E_0 ~ covariance terms u(x_i, x_j) must be included. Ignoring positive correlations can underestimate total uncertainty by up to 30%.
Expanded uncertainty U is obtained by scaling the combined standard uncertainty by coverage factor k:
U = k · u_c(y)
For Gaussian drift distributions, k = 2 provides roughly 95% confidence. If non-linear dependence on activation energy skews the output distribution, the coverage factor should be adjusted via the Welch-Satterthwaite equation for effective degrees of freedom ν_eff:
ν_eff = u_c^4(y) / SUM
Where ν_i is the degrees of freedom for input contribution u(x_i). Lower effective degrees of freedom require higher coverage factors k to maintain a true 95% confidence bound, widening the guard bands on product datasheets.
Calculations should also reflect service temperature variations. If operating ambient temperatures cycle between 100 °C and 150 °C, thermal history can be integrated into an equivalent aging factor A_T using Arrhenius scaling:
A_T = exp
Integrating equivalent operating hours under actual temperature profiles yields realistic field drift limits, helping set appropriate recalibration schedules for high-reliability instruments.
What remains unresolved is whether atomic-level creep recovery mechanisms operating during low-temperature field shutdown periods fully reverse transient strain accumulation or permanently alter zero-offset baseline trajectories.
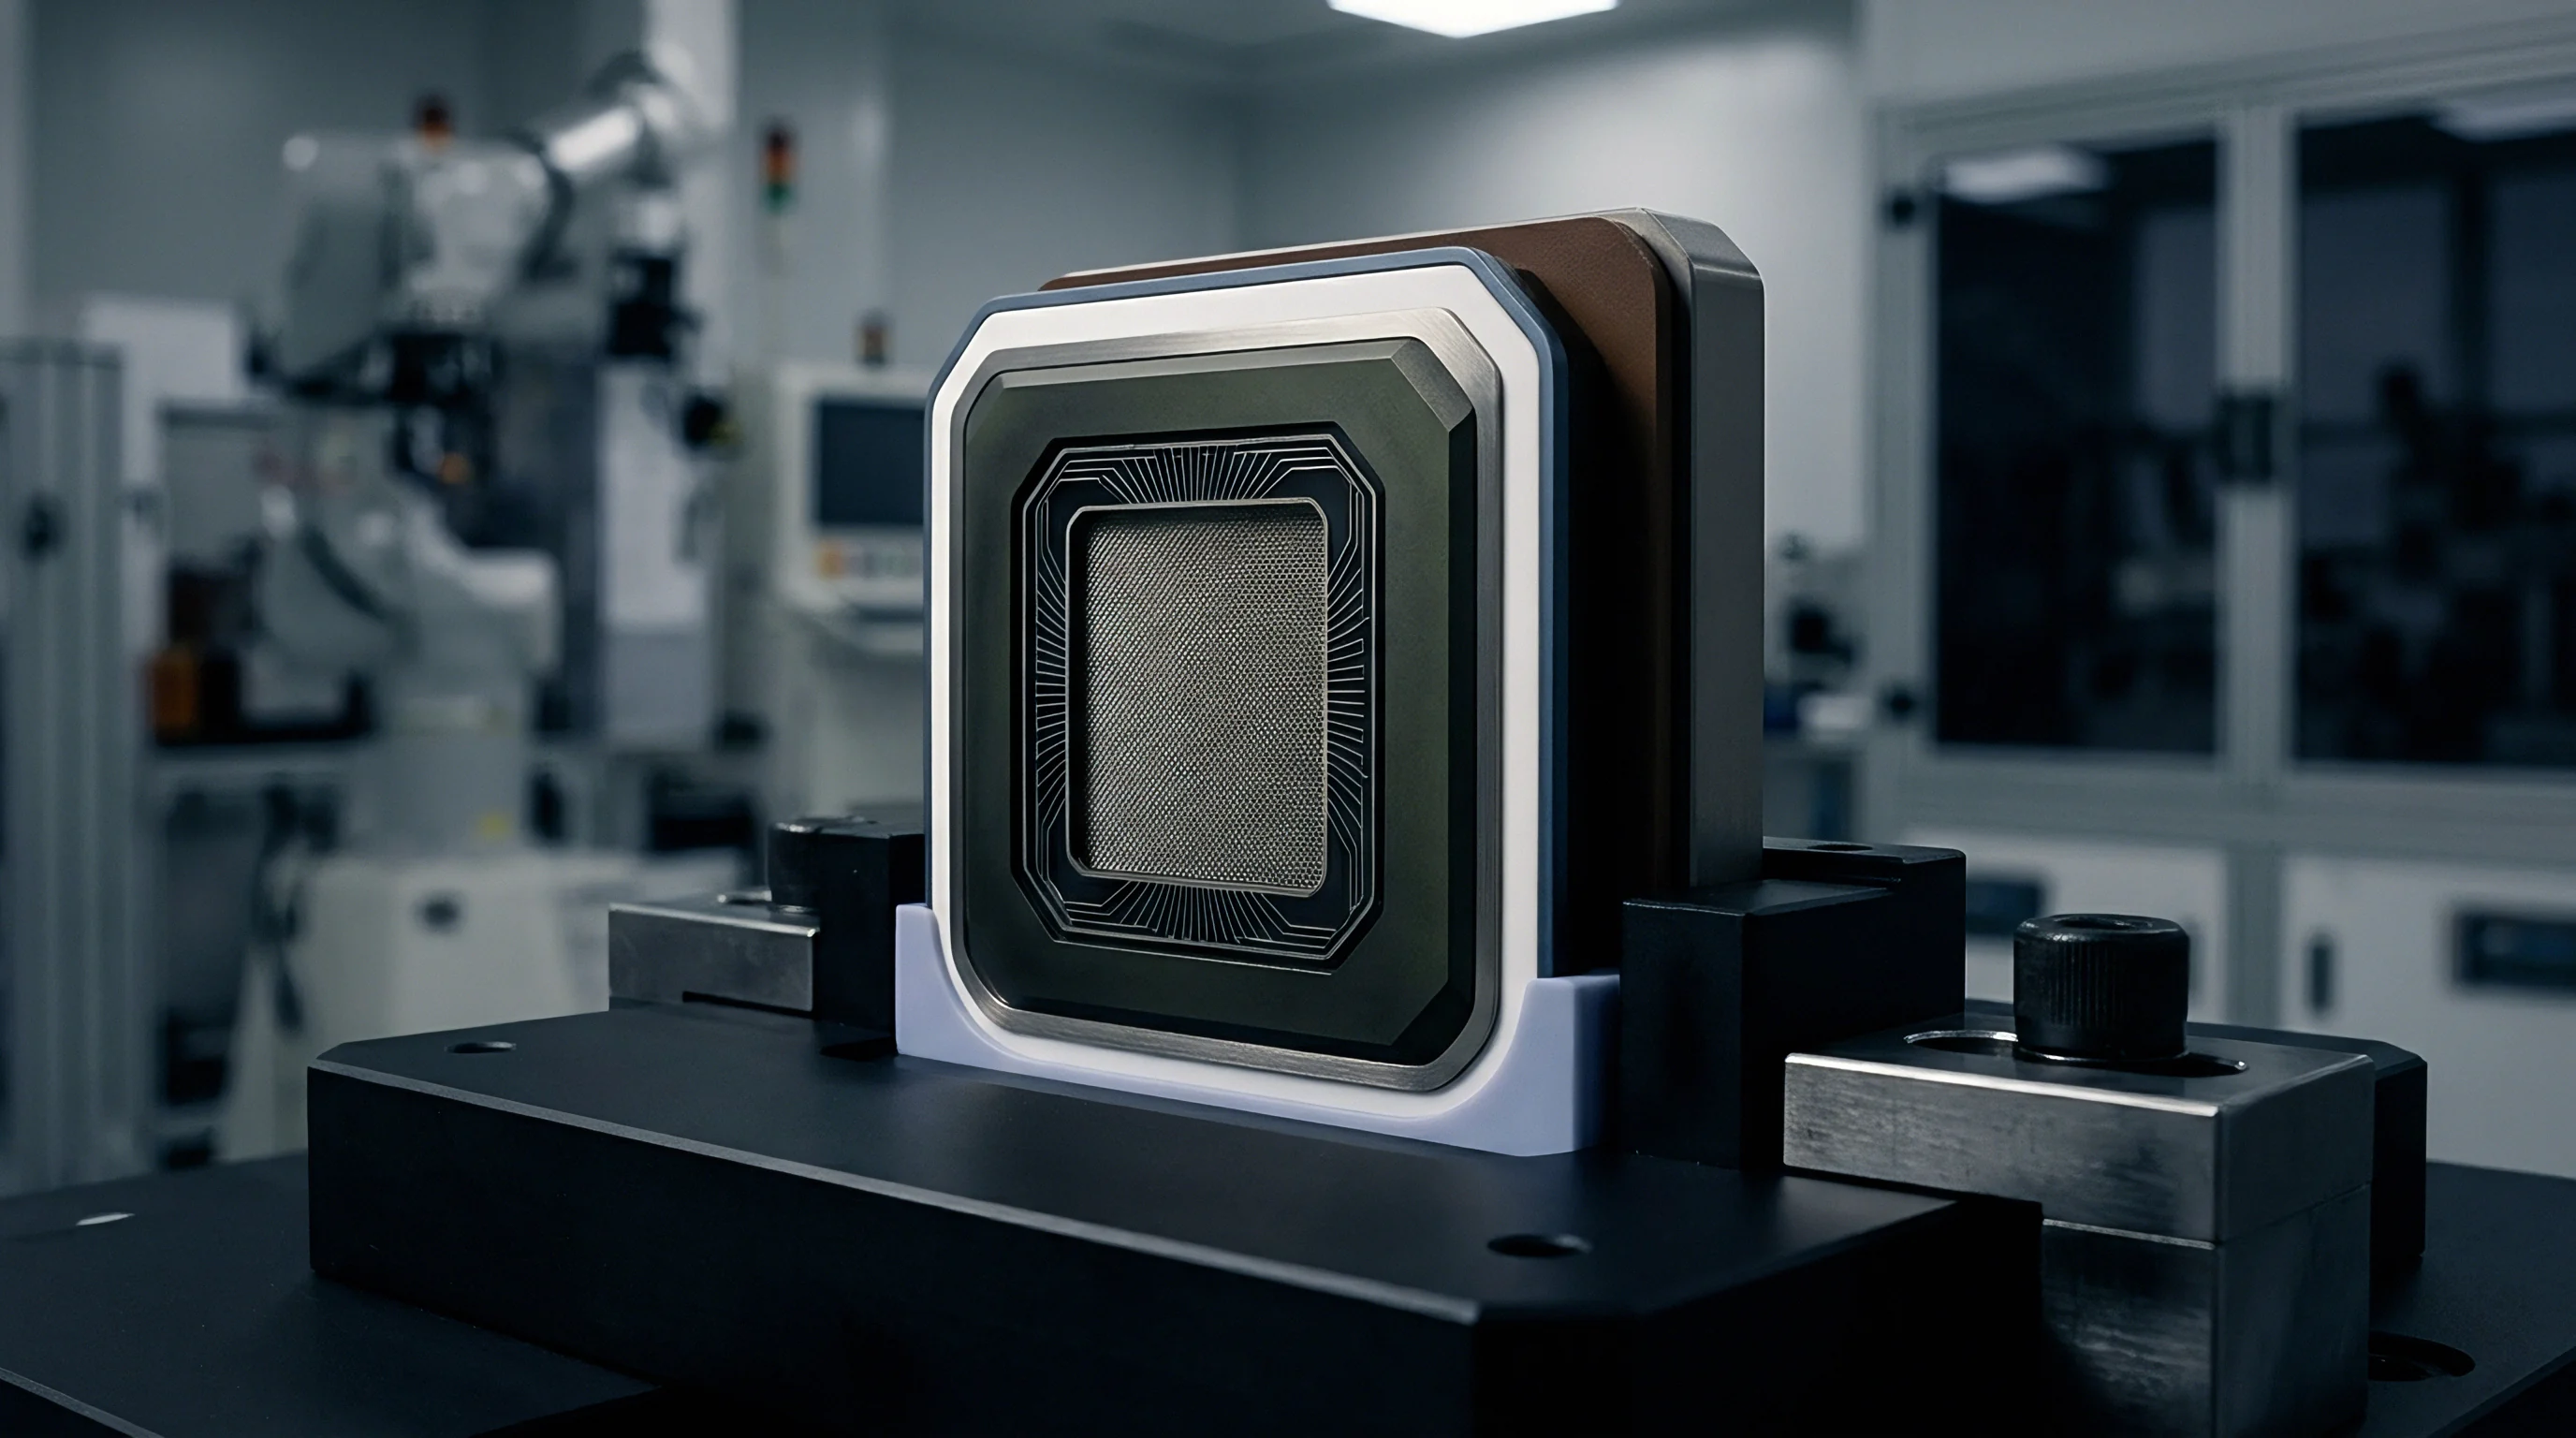

Fixture
Bench-level evaluation of high-temperature packaging creep demands strict optical and electrical isolation. Standard foil strain gauges degrade rapidly under sustained heat due to internal adhesive relaxation. To capture strain redistribution without measurement interference, experimental setups pair non-contact optical diagnostics with dedicated piezoresistive test die.
Non-contact optical methods measure surface deformations without introducing mechanical loading.
High-resolution optical Digital Image Correlation (DIC) maps planar strain fields in real time through quartz windows in chambers heated up to 200 °C. Test packages are prepped with a fine, high-contrast ceramic speckle pattern. Dual stereoscopic cameras view the sample through thermal-gradient compensated optics, tracking speckle displacement down to sub-micron resolution.
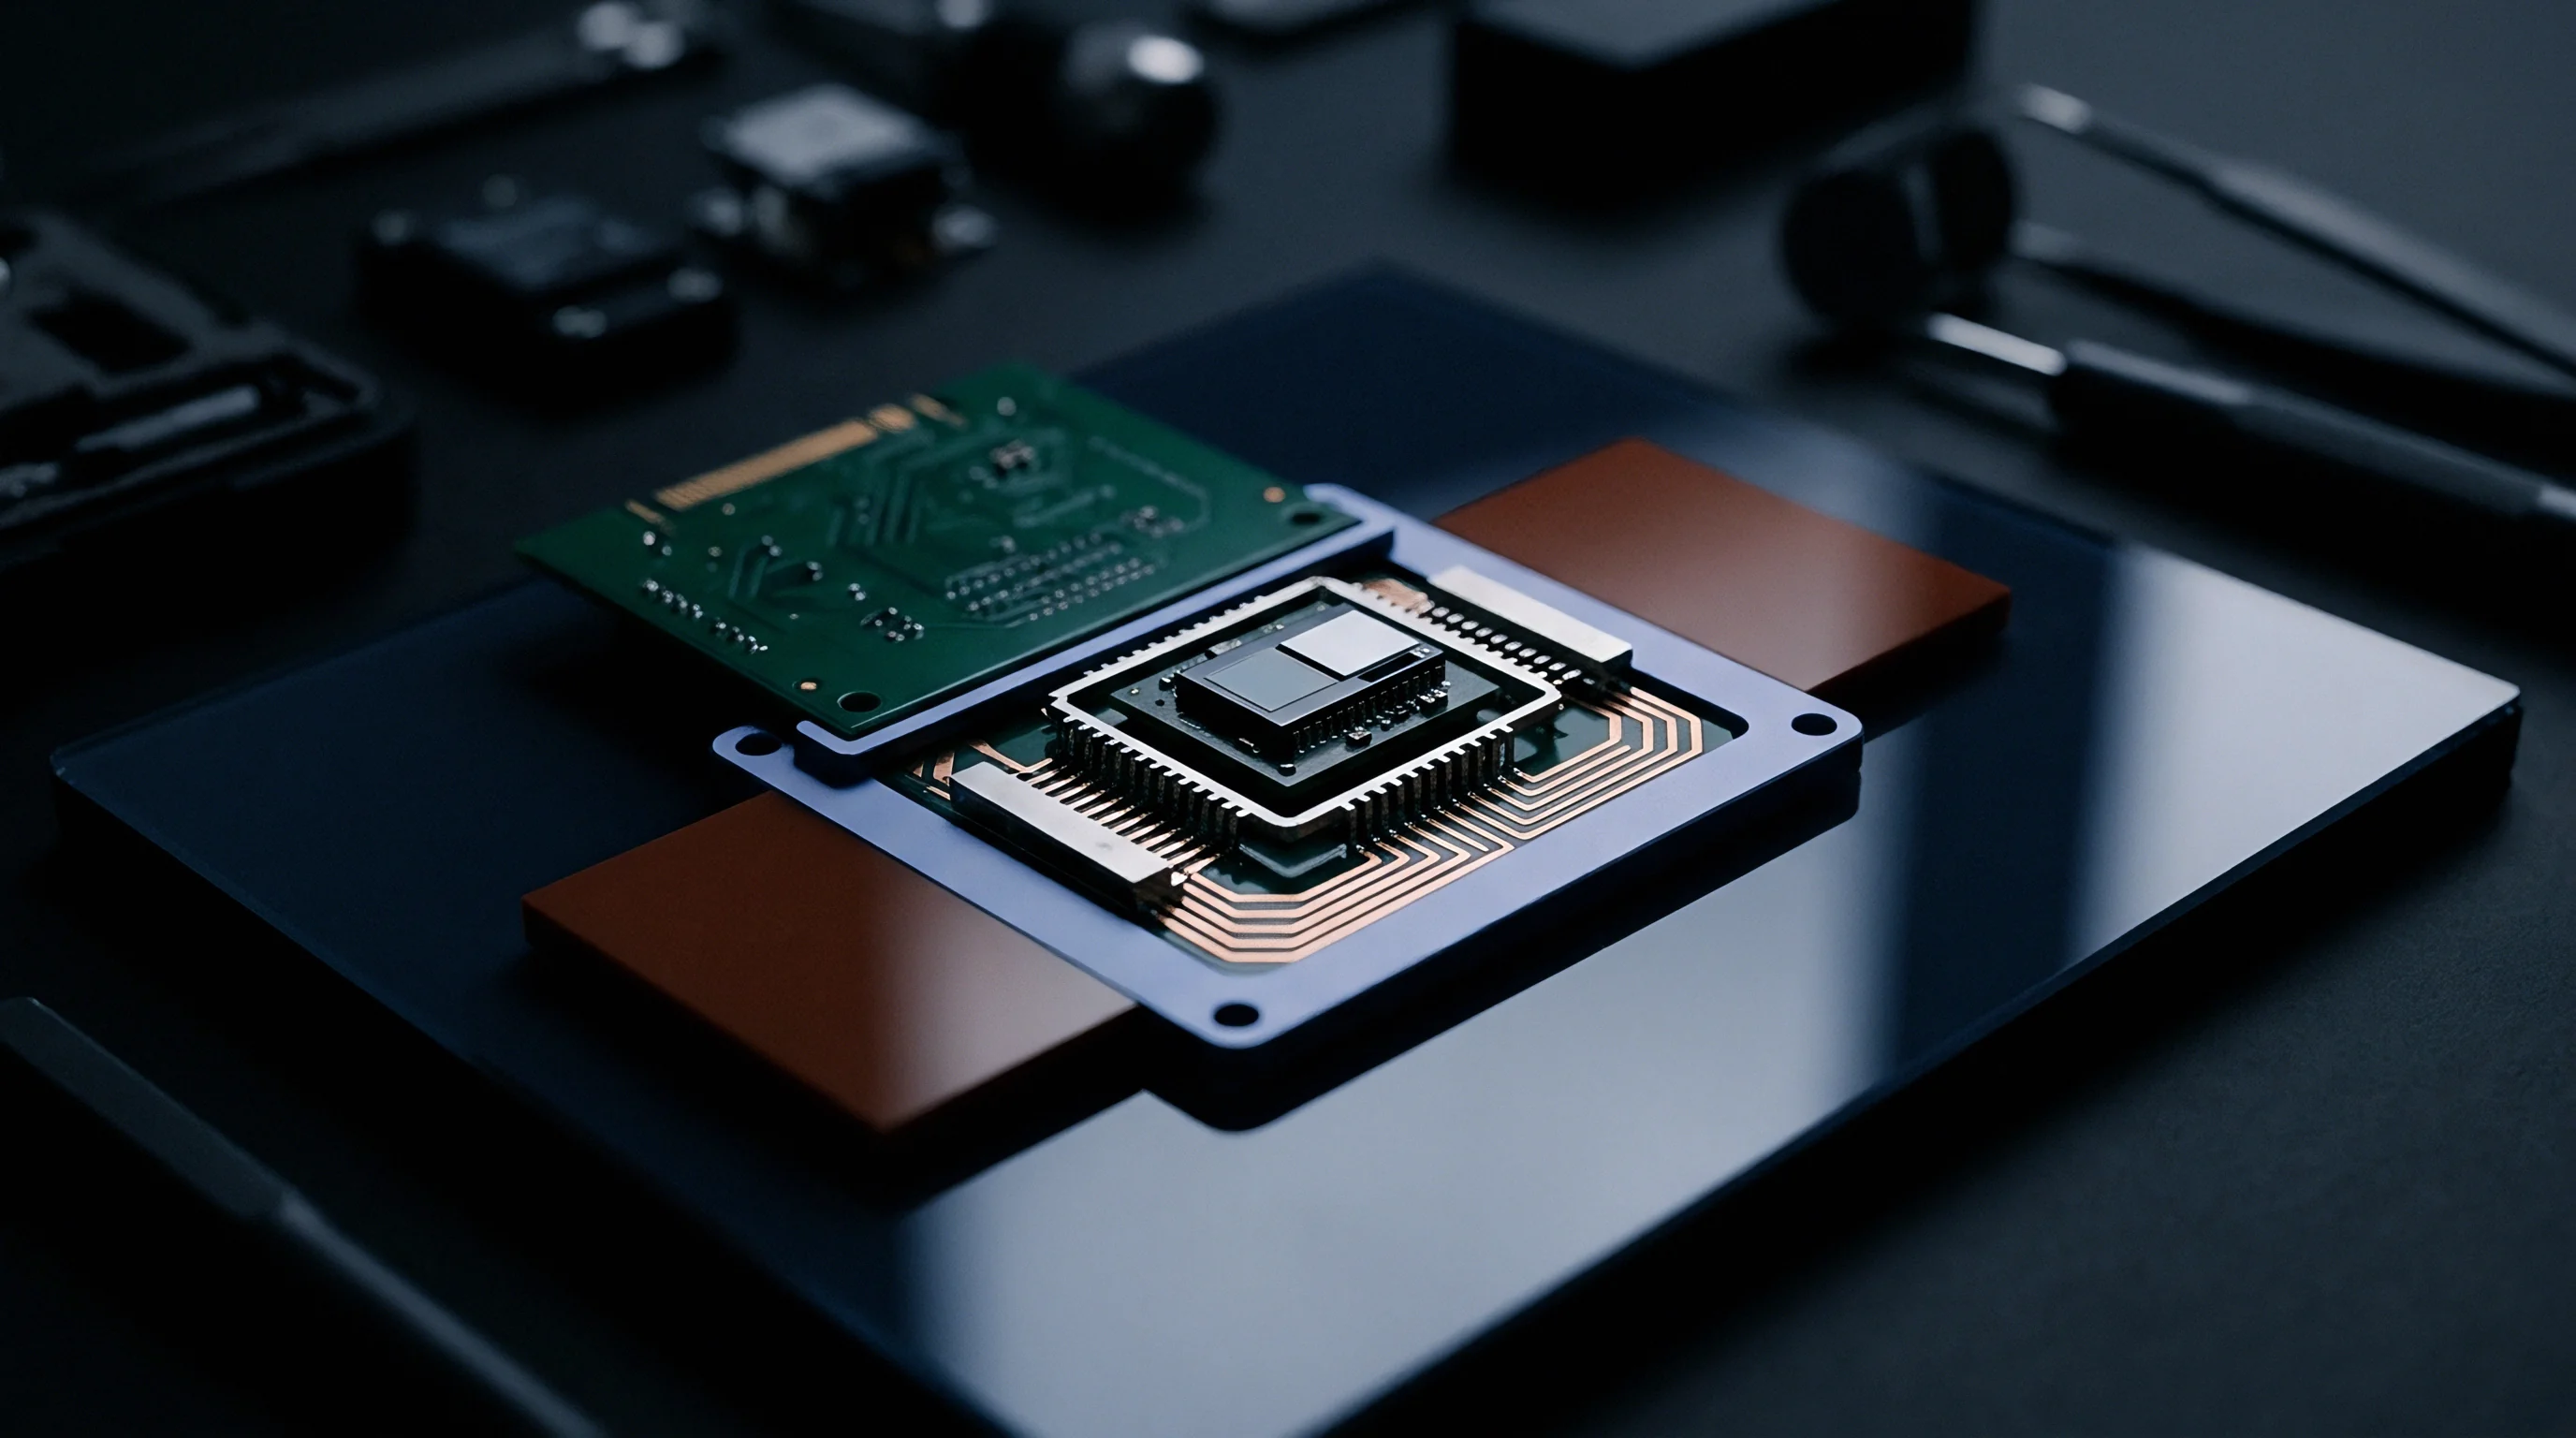
Optical Strain Mapping with Digital Image Correlation
Digital Image Correlation tracks speckle shifts between reference and deformed states. A digital subset is mapped using a first-order shape function vector, with the cross-correlation coefficient r identifying the best-fit displacement field across the package surface.
The Green-Lagrange strain tensor E_ij is derived from displacements u_i:
E_ij = 0.5 ·
Mapping strain evolution over 1,000 thermal hours yields temporal plots showing how package edge shear stresses decline while central die strains expand.
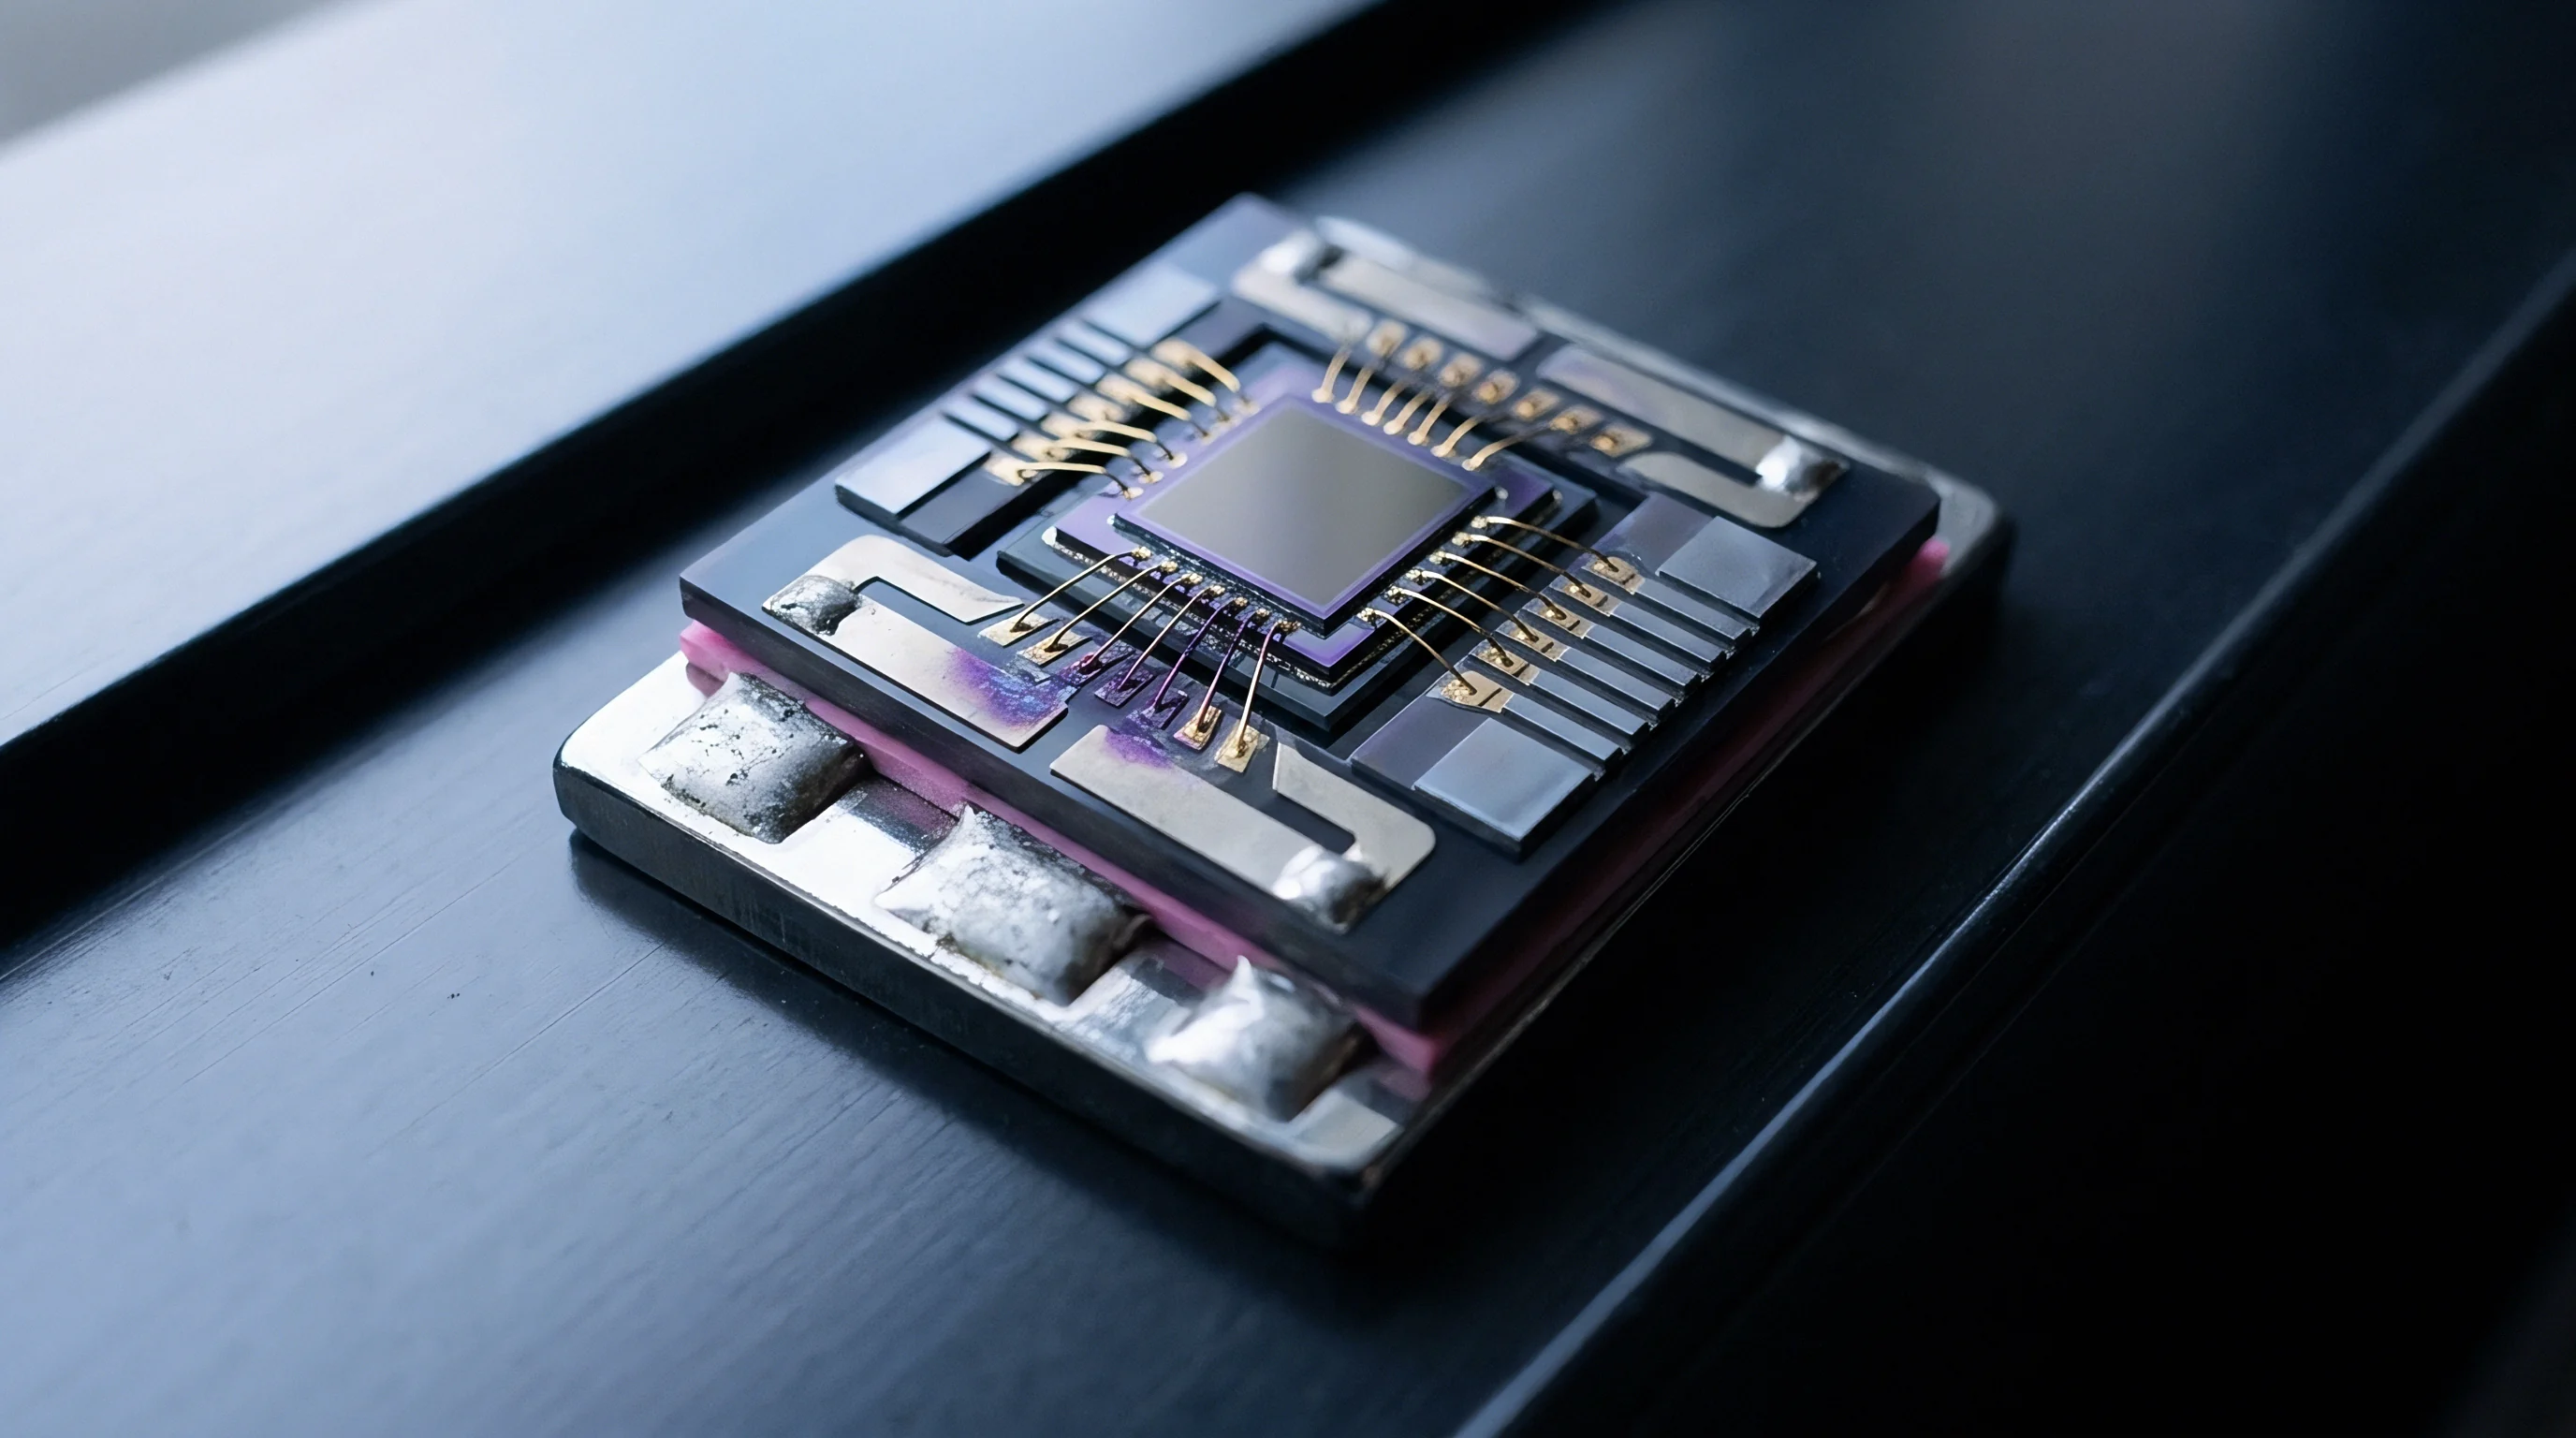
In parallel with DIC optical testing, custom piezoresistive test die are packaged directly. Containing dense arrays of resistor pairs along multiple crystallographic axes, these test chips allow simultaneous extraction of normal stress components σ_xx, σ_yy, and shear stress σ_xy across the die plane.
Decoupling Thermal Coefficients from Creep Drift
Separating time-dependent creep strain from temperature coefficient effects requires a controlled test sequence. The steps below isolate permanent structural drift from reversible thermal hysteresis.
- Place the packaged sensor test assembly inside a thermal test chamber equipped with optical quartz ports and active nitrogen purging to prevent surface oxidation.
- Stabilize the chamber at baseline reference temperature of 25 °C for two hours, recording baseline bridge offset voltages and baseline DIC optical speckle positions.
- Ramp chamber temperature at a controlled rate of 2 °C per minute up to target operating temperature of 150 °C to minimize transient thermal shock stresses.
- Maintain the target temperature of 150 °C for 168 hours while continuously logging piezoresistive bridge output voltages at 1-minute sampling intervals.
- Perform high-speed DIC optical strain captures every hour to record surface displacement maps and strain redistribution across package boundaries.
- Cool the assembly back to the reference temperature of 25 °C at 2 °C per minute and soak for two hours to measure permanent unrecovered offset drift.
- Repeat the thermal soak cycle for 500, 1,000, and 2,000 cumulative thermal exposure hours to construct long-term drift kinetics curves.
ISO/IEC 17025 accreditation guidelines demand that environmental drift verification protocols explicitly account for thermal chamber spatial gradient uncertainties.
Chamber temperature gradients must be tightly controlled. A spatial temperature variation of ± 1.5 °C across a test fixture introduces a 3% error in calculated creep rate parameters due to Arrhenius exponential sensitivity. Calibration labs place calibrated Pt100 RTDs around the fixture to bound spatial temperature variations.
Where drift tolerances are contractually defined, verified data must come from tests where chamber temperature remains within ± 0.2 °C and total optical strain measurement uncertainty stays below 50 microstrain.


Margin
Setting product specifications under package creep uncertainty requires guard-banding raw sensor performance limits. Stated datasheet accuracy must hold across the full operating temperature range over years of service. If package creep introduces 0.5% full-scale drift over three years at 150 °C, factory test limits must be tightened by that margin to protect field reliability.
Implementing guard bands ensures published accuracy limits are preserved throughout product life.
Guard-band limits are set by subtracting predicted maximum expanded drift uncertainty U_drift from the total allowable error band E_max. Initial factory tolerance T_initial is:
T_initial = E_max – U_drift
Tightening initial factory tolerances directly impacts manufacturing yield during final trim. If U_drift consumes 60% of total error E_max, the available factory trim window shrinks significantly, driving up fallout at wafer or package test.

Burn-In Acceleration of Primary Package Creep
To recover factory calibration yield, packaging operations often run high-temperature burn-in before final calibration trimming. Thermal burn-in accelerates primary creep, completing high-rate early stress relaxation prior to initial calibration.
Baking packaged sensors at 165 °C for 168 hours accelerates creep kinetics by a factor of 4.2 relative to 125 °C operation (based on Arrhenius scaling). During burn-in, primary creep completes its rapid initial phase, settling into slower steady-state secondary creep.
Table 3 shows how packaging style, substrate choice, and burn-in processing affect long-term drift and unit cost.
| Package Architecture Format | Die-Attach Material Choice | Burn-In Conditioning Profile | 5000-Hour Drift at 150°C (% FS) | Initial Factory Guard-Band Penalty (% FS) | Relative Package Landed Cost |
|---|---|---|---|---|---|
| Standard SOIC-8 Leadframe | Silver-Filled Conductive Epoxy | None (As-Molded) | ± 0.65 % FS | ± 0.45 % FS | 1.00x (Baseline) |
| Standard SOIC-8 Leadframe | Silver-Filled Conductive Epoxy | 168 Hours at 165 °C | ± 0.22 % FS | ± 0.15 % FS | 1.18x |
| Flip-Chip BGA Substrate | Capillary Underfill Polymer | 96 Hours at 165 °C | ± 0.12 % FS | ± 0.08 % FS | 1.45x |
| Stress-Isolated Ceramic Cavity | AuSn Eutectic Solder Bond | None (As-Molded) | ± 0.04 % FS | ± 0.02 % FS | 2.85x |
High-temperature burn-in adds energy and equipment costs, raising overall package landed costs by about 18%. However, pre-stabilizing creep reduces 5,000-hour drift by roughly two-thirds, opening up the factory tolerance window and raising final calibration yield from 82% to 97%.

Package Geometry and Stress Isolation Architecture
Package architecture offers another way to isolate active silicon from creep strain. Flip-chip designs replace continuous die-attach layers with discrete solder bumps encapsulated in polymer underfill.
The capillary underfill helps attenuate interfacial shear stress across the assembly.
Underfill spreads expansion shear forces across the solder bump array, dampening strain concentrations at die corners. Formulating underfills with high silica filler content (up to 70% by weight) drops the thermal expansion coefficient to 18 ppm/K, matching copper substrates and limiting shear stress on solder joints.
Selecting high-temperature package architectures involves trade-offs:
- Operating temperature bounds determine whether standard organic epoxy die-attach materials require replacement by high-lead or eutectic gold-tin solder bonds.
- Lifespan drift tolerances dictate whether expensive thermal burn-in bake steps must precede initial calibration trimming operations.
- Substrate thermal expansion coefficients govern the selection of underfill glass transition targets to prevent high shear strain generation above 125 °C.
- Assembly spatial constraints limit the feasibility of implementing stress-isolated ceramic cavity packages with suspended die pedestals.
Choosing an optimal packaging configuration requires balancing initial manufacturing expense against required measurement stability over system operating lifespans.
Yield
Precision measurement systems carry strict commercial penalties for drift. When sourcing sensors for high-temperature automotive powertrains, aerospace propulsion, or downhole industrial instruments, procurement teams evaluate initial unit cost against total cost of ownership ~ including recalibration labor, field replacement risk, and warranty costs driven by package creep drift.
Production yields drop sharply as long-term stability tolerances tighten.
A specification requiring a 0.1% full-scale error band over 5,000 hours at 150 °C rules out standard commercial leadframe packaging. Procurement must choose between paying more upfront for stress-isolated ceramic cavity packages or paying post-processing surcharges for thermal burn-in of plastic packages.

Grade Arithmetic and Accuracy Class Retention
Sensor pricing climbs steeply as long-term stability specs tighten. Translating physical drift mechanics into unit economics highlights how package choice directly impacts landed component cost.
Class A industrial transducers guarantee maximum total drift within ± 0.1% full scale over three years of continuous service at 150 °C. Class B devices hold a ± 0.25% full-scale spec under the same conditions, while Class C devices allow up to ± 0.5% full-scale drift.
Hitting Class A specs in plastic packages requires extended 168-hour burn-in, 100% multi-temperature screening, and strict wafer-level stress testing. These QA steps narrow the price gap between stabilized plastic packages and inherently stable ceramic cavity designs.
Specifying Class A drift limits increases plastic package test rejection by 14% compared to Class B requirements, raising effective purchasing costs.

Sourcing Specifications for High Temperature Applications
Procurement documents for high-temperature sensor components should include explicit verification clauses covering material creep stability. Datasheets quoting room-temperature initial accuracy while ignoring long-term high-temperature drift leave buyers exposed to reliability and financial risks.
Procurement specifications for precision packaging should explicitly require:
- Creep parameter verification requires suppliers to submit Anand model material parameters verified by accredited third-party laboratories.
- Long term drift testing mandates continuous 2,000-hour drift verification testing at maximum rated operating temperature under ISO/IEC 17025 protocols.
- Glass transition verification obligates vendors to report dynamic mechanical analysis curves showing storage modulus decay across the operating range.
- Lot acceptance limits establish maximum allowable zero-offset drift thresholds for sample batches subjected to thermal aging before lot release.
Including explicit creep verification in supply agreements assigns financial accountability for long-term drift back to component suppliers. Requiring verified 2,000-hour drift data under accredited test protocols before lot release protects downstream systems from early field failures and unplanned recalibration expenses.
Rigorous package creep modeling converts long-term drift from an unexpected field failure risk into a predictable, manageable engineering variable.