Accuracy Stated at Twenty Five Degrees and Sold for Outdoor Use
Room-temperature sensor calibrations omit outdoor thermal drift coefficients, expanding real field uncertainty far beyond published baseline claims.

Envelope
A factory calibration certificate issued at twenty-five degrees Celsius defines performance under bench conditions that rarely exist in field deployments. Sensors specified at room temperature carry performance statements recorded in climate-controlled calibration rooms where relative humidity rests at forty-five percent and ambient pressure remains constant. When these instruments enter outdoor service, ambient weather exposes the sensing element to daily temperature swings of forty degrees, solar radiation loading, atmospheric pressure shifts, and high humidity.
The original accuracy statement reflects only a single point on a complex thermal transfer function. Operating outside that single temperature point alters signal amplification, baseline reference voltages, and mechanical material strain.
Datasheet specifications frequently highlight a full-scale accuracy figure, such as plus or minus zero point one percent, recorded exclusively at twenty-five degrees. Below that header, in fine print, sits a thermal error coefficient expressed in percentage of full scale per degree Celsius. A sensor operating outdoors at minus fifteen degrees Celsius or plus fifty degrees Celsius experiences a thirty-five or twenty-five degree departure from the factory baseline.
Multiplying this departure by the temperature coefficient reveals that actual operational error expands by several multiples of baseline accuracy. Buying an instrument based on its room-temperature specification without integrating the thermal drift budget creates substantial measurement errors in environmental monitoring, meteorological networks, and industrial field automation.

Reference Conditions and Field Thermal Excursions
Datasheets state measurement uncertainty at a fixed laboratory point, usually room temperature, while outdoor ambient environments cycle across forty degrees daily. Atmospheric monitoring stations, pipeline pressure transmitters, and water treatment sensors operate continuously under unconditioned weather. Solar irradiance adds localized heating that elevates internal sensor housing temperatures twenty degrees above surrounding air.
A metal enclosure mounted on an unshaded tower reaches sixty degrees Celsius on a summer afternoon, even when ambient air temperature remains at thirty-five degrees. This solar loading generates internal heat gradients across circuit boards, distorting signal processing paths calibrated for uniform room-temperature operation.
Seasonal weather variation shifts baseline sensor output across months of operation. Winter operation exposes electronics to sustained sub-zero conditions where semiconductor bandgap references exhibit non-linear voltage variations. Operational amplifiers experience input bias current shifts that alter gain stage calculations.
Mechanical sensing elements, including piezoresistive silicon diaphragms and capacitive pressure cells, suffer physical modulus shifts as temperatures decrease. In high-precision applications, these physical changes shift zero-point values away from calibrated baseline figures, producing persistent offset errors that mimic physical process changes.
In bench testing across outdoor temperature profiles, total measurement error is calculated by summing reference uncertainty with thermal coefficient drift. The total error budget must account for both offset drift and span coefficient drift. Offset drift alters the zero-signal output across temperature variations, whereas span drift changes the sensitivity or slope of the sensor output response.
When an application requires accuracy across a broad outdoor operating range, relying on a single room-temperature factory calibration introduces unquantified uncertainty into field data collection.
Temperature Coefficients and Offset Shifts
Silicon piezoresistive elements, optical detectors, and electrochemical cells alter gain and zero-point output as ambient heat moves away from the calibration baseline. Piezoresistive pressure sensors rely on doped silicon resistors arranged in a Wheatstone bridge circuit. The resistance of doped silicon varies non-linearly with temperature, requiring internal temperature compensation networks consisting of series and parallel thermistors or active digital compensation algorithms.
Uncompensated thermal coefficients in low-cost pressure sensors reach zero point zero two percent of full scale per degree Celsius. Across a forty degree temperature swing, this coefficient introduces zero point eight percent of additional measurement error, exceeding the baseline accuracy claim by eight hundred percent.
Electrochemical gas sensors suffer severe sensitivity shifts when subjected to outdoor temperature variations. Electrolyte viscosity changes with temperature, altering gas diffusion rates through the sensor membrane. At sub-zero temperatures, reaction kinetics slow down, causing signal attenuation and delayed response times.
Conversely, elevated outdoor temperatures accelerate chemical reaction rates, creating artificial concentration spikes. Optical non-dispersive infrared gas detectors experience optical filter shift and infrared emitter output variations as internal chamber temperatures fluctuate. Without real-time internal thermal monitoring and dynamic software compensation, optical gas measurements diverge rapidly from calibrated standard values.
Standard ISO/IEC 17025 accreditation obligates laboratories to report measurement uncertainty for all non-standard calibration temperatures.
Analog front-end circuits contribute significantly to total transmitter temperature drift. Precision voltage references used in analog-to-digital converters drift by several parts per million for every degree shift in ambient temperature. Resistors within gain-setting networks expand and contract, altering amplifier feedback ratios.
Evaluating vendor datasheets for outdoor monitoring stations requires isolating zero drift from span temperature drift across the published operational range. The table below illustrates how temperature variations alter total measurement error across three common industrial sensor types calibrated at twenty-five degrees Celsius.
| Sensor Type | Base Accuracy (+25°C) | Thermal Coefficient | Cold Error (-15°C) | Hot Error (+50°C) |
|---|---|---|---|---|
| Piezoresistive Pressure | ±0.10% FS | ±0.015% FS/°C | ±0.70% FS | ±0.475% FS |
| Capacitive Relative Humidity | ±1.50% RH | ±0.050% RH/°C | ±3.50% RH | ±2.75% RH |
| Electrochemical Toxic Gas | ±2.00% FS | ±0.120% FS/°C | ±6.80% FS | ±5.00% FS |
Calibration certificates document past performance. A certificate issued at a single room temperature confirms only that the sensor met its specification inside the calibration laboratory on the day of testing. It provides zero evidence regarding sensor linearity, thermal coefficient accuracy, or zero-point stability under outdoor weather conditions.
Field drift beyond stated accuracy often stems from treating twenty-five degrees Celsius as a static benchmark, leaving environmental compensation as an integration task.
Frost
Sub-zero ambient conditions freeze ambient vapor within protective vents, alter dielectric values, and stiffen mechanical sensing diaphragms. Environmental sensors installed in cold climates encounter physical stress mechanisms that never appear during room-temperature factory testing. Liquid water expanding into ice within microporous hydrophobic vents restricts atmospheric pressure equalization, creating internal pressure build-up inside weather-proof enclosures.
This pressure differential distorts barometric compensation in vented gauge pressure transmitters, resulting in permanent output shifts during winter freezing cycles.
Ice accumulation on external sensing elements introduces mechanical loading and alters electrical properties. Capacitive weather sensors experience drastic dielectric shifts when ice forms directly on electrode surfaces, as the relative permittivity of ice differs substantially from air and liquid water. Optical windows on precipitation and dust monitors frost over when heating elements lack sufficient thermal power to overpower sub-zero wind chill.
Outdoor deployments in freezing environments demand specialized thermal management and physical weather protection to maintain measurement integrity.
Thermal Shock and Condensation Ingress
Rapid weather changes produce pressure differentials inside sealed housings, drawing moist air past elastomeric seals during rapid cooling phases. A solar-heated sensor enclosure rapidly cooled by a sudden summer rainstorm experiences an internal pressure drop relative to ambient air. This vacuum effect pulls moisture through silicone gaskets, cable glands, and thread sealants.
Once inside the housing, high-humidity air condenses onto cold circuit board surfaces as external temperatures drop at night.
Condensation forms microscopic water droplets across high-impedance electronic traces, creating parasitic resistance paths and surface leakage currents. Electrochemical corrosion accelerates when condensation interacts with residual flux residues on printed circuit board assemblies. Over operational months, trace oxidation increases circuit resistance, degrading signal-to-noise ratios and introducing uncompensated zero-point drift.
Sealed enclosures lacking internal desiccants or breathable waterproof membranes inevitably accumulate internal moisture through repeated diurnal pressure cycling.

Humidity Recovery and Dielectric Shift
Capacitive relative moisture detectors and printed wiring traces retain absorbed water molecules, causing persistent offset errors after rain events. Polymer-based capacitive humidity sensors absorb water molecules into a hygroscopic dielectric film, changing circuit capacitance proportionally to ambient moisture. Following prolonged exposure to one hundred percent relative humidity or fog, polymer films exhibit saturation effects.
The sensor fails to recover its baseline reading immediately upon returning to drier conditions, requiring hours or days to desorb moisture completely.
Absorbed water within circuit board substrates alters trace capacitance and insulation resistance. High-frequency oscillator circuits and high-gain analog amplification stages drift when surrounding board dielectric constants change. During thermal chamber validation of incoming batches, zero-point wander is measured at zero degrees Celsius before and after humidity exposure.
Unprotected printed circuit boards exposed to condensing moisture demonstrate persistent zero-point shifts that corrupt measurement accuracy long after ambient humidity levels drop.

Mechanical Strains and Package Contraction
Differential expansion rates between aluminum structures, circuit boards, and internal components generate physical force that distorts signal output. Materials expand and contract at rates determined by their linear thermal expansion coefficients. Aluminum housing materials contract faster than glass-filled epoxy circuit boards, producing physical strain across internal mounting points.
This mechanical stress transfers directly to sensitive silicon sensor dies and surface-mount components, altering electrical resistance through piezoresistive effects in component packages.
Thermal cycling causes solder joint fatigue across surface-mount components. Repeated mechanical expansion and contraction breaks micro-scale crystalline bonds within lead-free solder alloys, creating micro-cracks that increase electrical resistance over time. Piezoresistive bridge circuits mounted on metal headers experience thermal hysteresis, where the sensor output fails to return to its initial zero value after returning to twenty-five degrees Celsius.
Outdoor sensor designs must incorporate mechanical strain relief, flexible interconnects, and matched-expansion package materials to survive multi-year thermal cycling in field applications.
Direct solar radiation increases internal enclosure temperature far beyond ambient air measurements.
Field failures caused by outdoor environmental stress display distinct operational signatures. The list below identifies failure modes observed in outdoor sensor deployments exposed to wide temperature and humidity variations without adequate environmental compensation.
- Vented Gauge Hydrophobic Membrane Freezing prevents atmospheric pressure reference balancing, creating zero-point offset shifts exceeding five percent of full scale during winter conditions.
- Condensation-Induced Leakage Currents across high-impedance amplifier inputs cause baseline output wander and erratic signal spikes during high-humidity night cycles.
- Dielectric Saturation in Polymer Sensors causes hysteresis errors and delayed recovery times following saturated fog exposure in meteorological monitoring stations.
- Thermal Expansion Mismatch between ceramic sensor substrates and metallic housings induces physical strain that shifts zero balance across seasonal temperature changes.
- Optical Surface Frosting degrades light transmission in infrared gas and dust monitors, triggering false high-concentration alarm thresholds during cold morning shifts.
- Elastomeric Gasket Micro-Cracking from continuous ultraviolet radiation exposure allows moisture ingress, degrading internal circuit insulation resistance over time.
Uncorrected thermal hysteresis in outdoor monitoring networks degrades data integrity, triggers false process alarms, and forces premature hardware replacement across field assets.
Uncertainty
Quantifying measurement reliability requires evaluating every component contribution from the reference standard down to the analog front end. Measurement uncertainty cannot be expressed as a single static figure when equipment operates across wide outdoor thermal environments. An uncertainty budget compiled for twenty-five degrees Celsius represents only a baseline figure.
In field applications, additional uncertainty contributions emerge from thermal drift coefficients, power supply variations, environmental radiation, and sensor aging effects. Combining these contributions requires systematic evaluation according to international metrological frameworks.
Calculating expanded uncertainty involves identifying every random and systematic error source within the measurement chain. Standard uncertainty components are converted into standard deviations and combined using root sum square methods. Coverage factors, typically k equals two for a ninety-five percent confidence interval, scale the combined standard uncertainty to produce the final expanded uncertainty figure reported on calibration documentation.
Omitting thermal drift and environmental influence factors from this calculation results in an overly optimistic uncertainty estimate that fails to reflect field performance.
Guide to Expression of Uncertainty in Measurement
Standardized evaluation frameworks combine statistical sample data with manufacturer figures using root sum square calculations. The international Guide to the Expression of Uncertainty in Measurement establishes two categories of uncertainty evaluation. Type A evaluations calculate standard uncertainty from statistical analysis of repeated measurement observations on the bench.
Type B evaluations determine standard uncertainty using external information, including calibration certificates, manufacturer datasheets, historical stability data, and physical material specifications.
Constructing a reliable uncertainty budget for field instrumentation requires incorporating solar radiation impact along with housing conduction loss. Type B evaluation converts manufacturer thermal drift limits into standard uncertainties by assuming uniform or rectangular probability distributions across the operating temperature range. Dividing published temperature coefficient tolerances by the square root of three yields the standard uncertainty associated with thermal drift.
This standard uncertainty is then combined with laboratory calibration uncertainty, resolution limits, and hysteresis errors to calculate total field measurement uncertainty.
When Does Outdoor Ambient Thermal Gradient Exceed Factory Trim Limits?
Enclosures exposed to direct solar rays develop internal heat differences exceeding fifteen degrees relative to shaded air. Solar radiation loading creates localized hot spots within sensor housings, establishing thermal gradients across internal components. When a sensor assembly experiences a temperature gradient across its internal circuit board, cold-junction compensation sensors, bridge circuits, and reference amplifiers operate at different temperatures.
This temperature imbalance breaks circuit symmetry assumptions used during factory compensation procedures.
Factory trim operations assume that the entire sensor assembly reaches uniform thermal equilibrium inside a calibration chamber. In field deployments, rapid solar heating causes the external housing to heat up while internal electronics lag behind. This dynamic thermal gradient produces transient offset errors that exceed published static temperature coefficient limits.
Sensor assemblies installed outdoors without radiation shields experience severe measurement drift during morning and afternoon solar exposure peaks. The table below details an uncertainty budget for an outdoor pressure transmitter operating across a minus ten to plus forty-five degree Celsius field environment.
| Uncertainty Source | Value | Probability Distribution | Divisor | Standard Uncertainty |
|---|---|---|---|---|
| Reference Calibration Standard | ±0.020% FS | Normal (k=2) | 2.000 | ±0.0100% FS |
| Sensor Resolution | ±0.005% FS | Rectangular | 1.732 | ±0.0029% FS |
| Thermal Zero Drift (-10°C to +45°C) | ±0.350% FS | Rectangular | 1.732 | ±0.2021% FS |
| Thermal Span Drift (-10°C to +45°C) | ±0.250% FS | Rectangular | 1.732 | ±0.1443% FS |
| Power Supply Regulation (12-24V) | ±0.010% FS | Rectangular | 1.732 | ±0.0058% FS |
| Annual Drift and Aging | ±0.100% FS | Rectangular | 1.732 | ±0.0577% FS |
| Combined Standard Uncertainty (Root Sum Square) | ±0.2552% FS | |||
Multiplying the combined standard uncertainty of zero point two five five two percent by a coverage factor of k equals two yields an expanded uncertainty of plus or minus zero point five one percent of full scale. This expanded uncertainty is five times larger than the room-temperature factory baseline accuracy claim of plus or minus zero point1 percent. Whether low-cost digital temperature compensation algorithms can fully isolate sensor drift without individualized multi-point chamber testing remains an open analytical question.

Validation
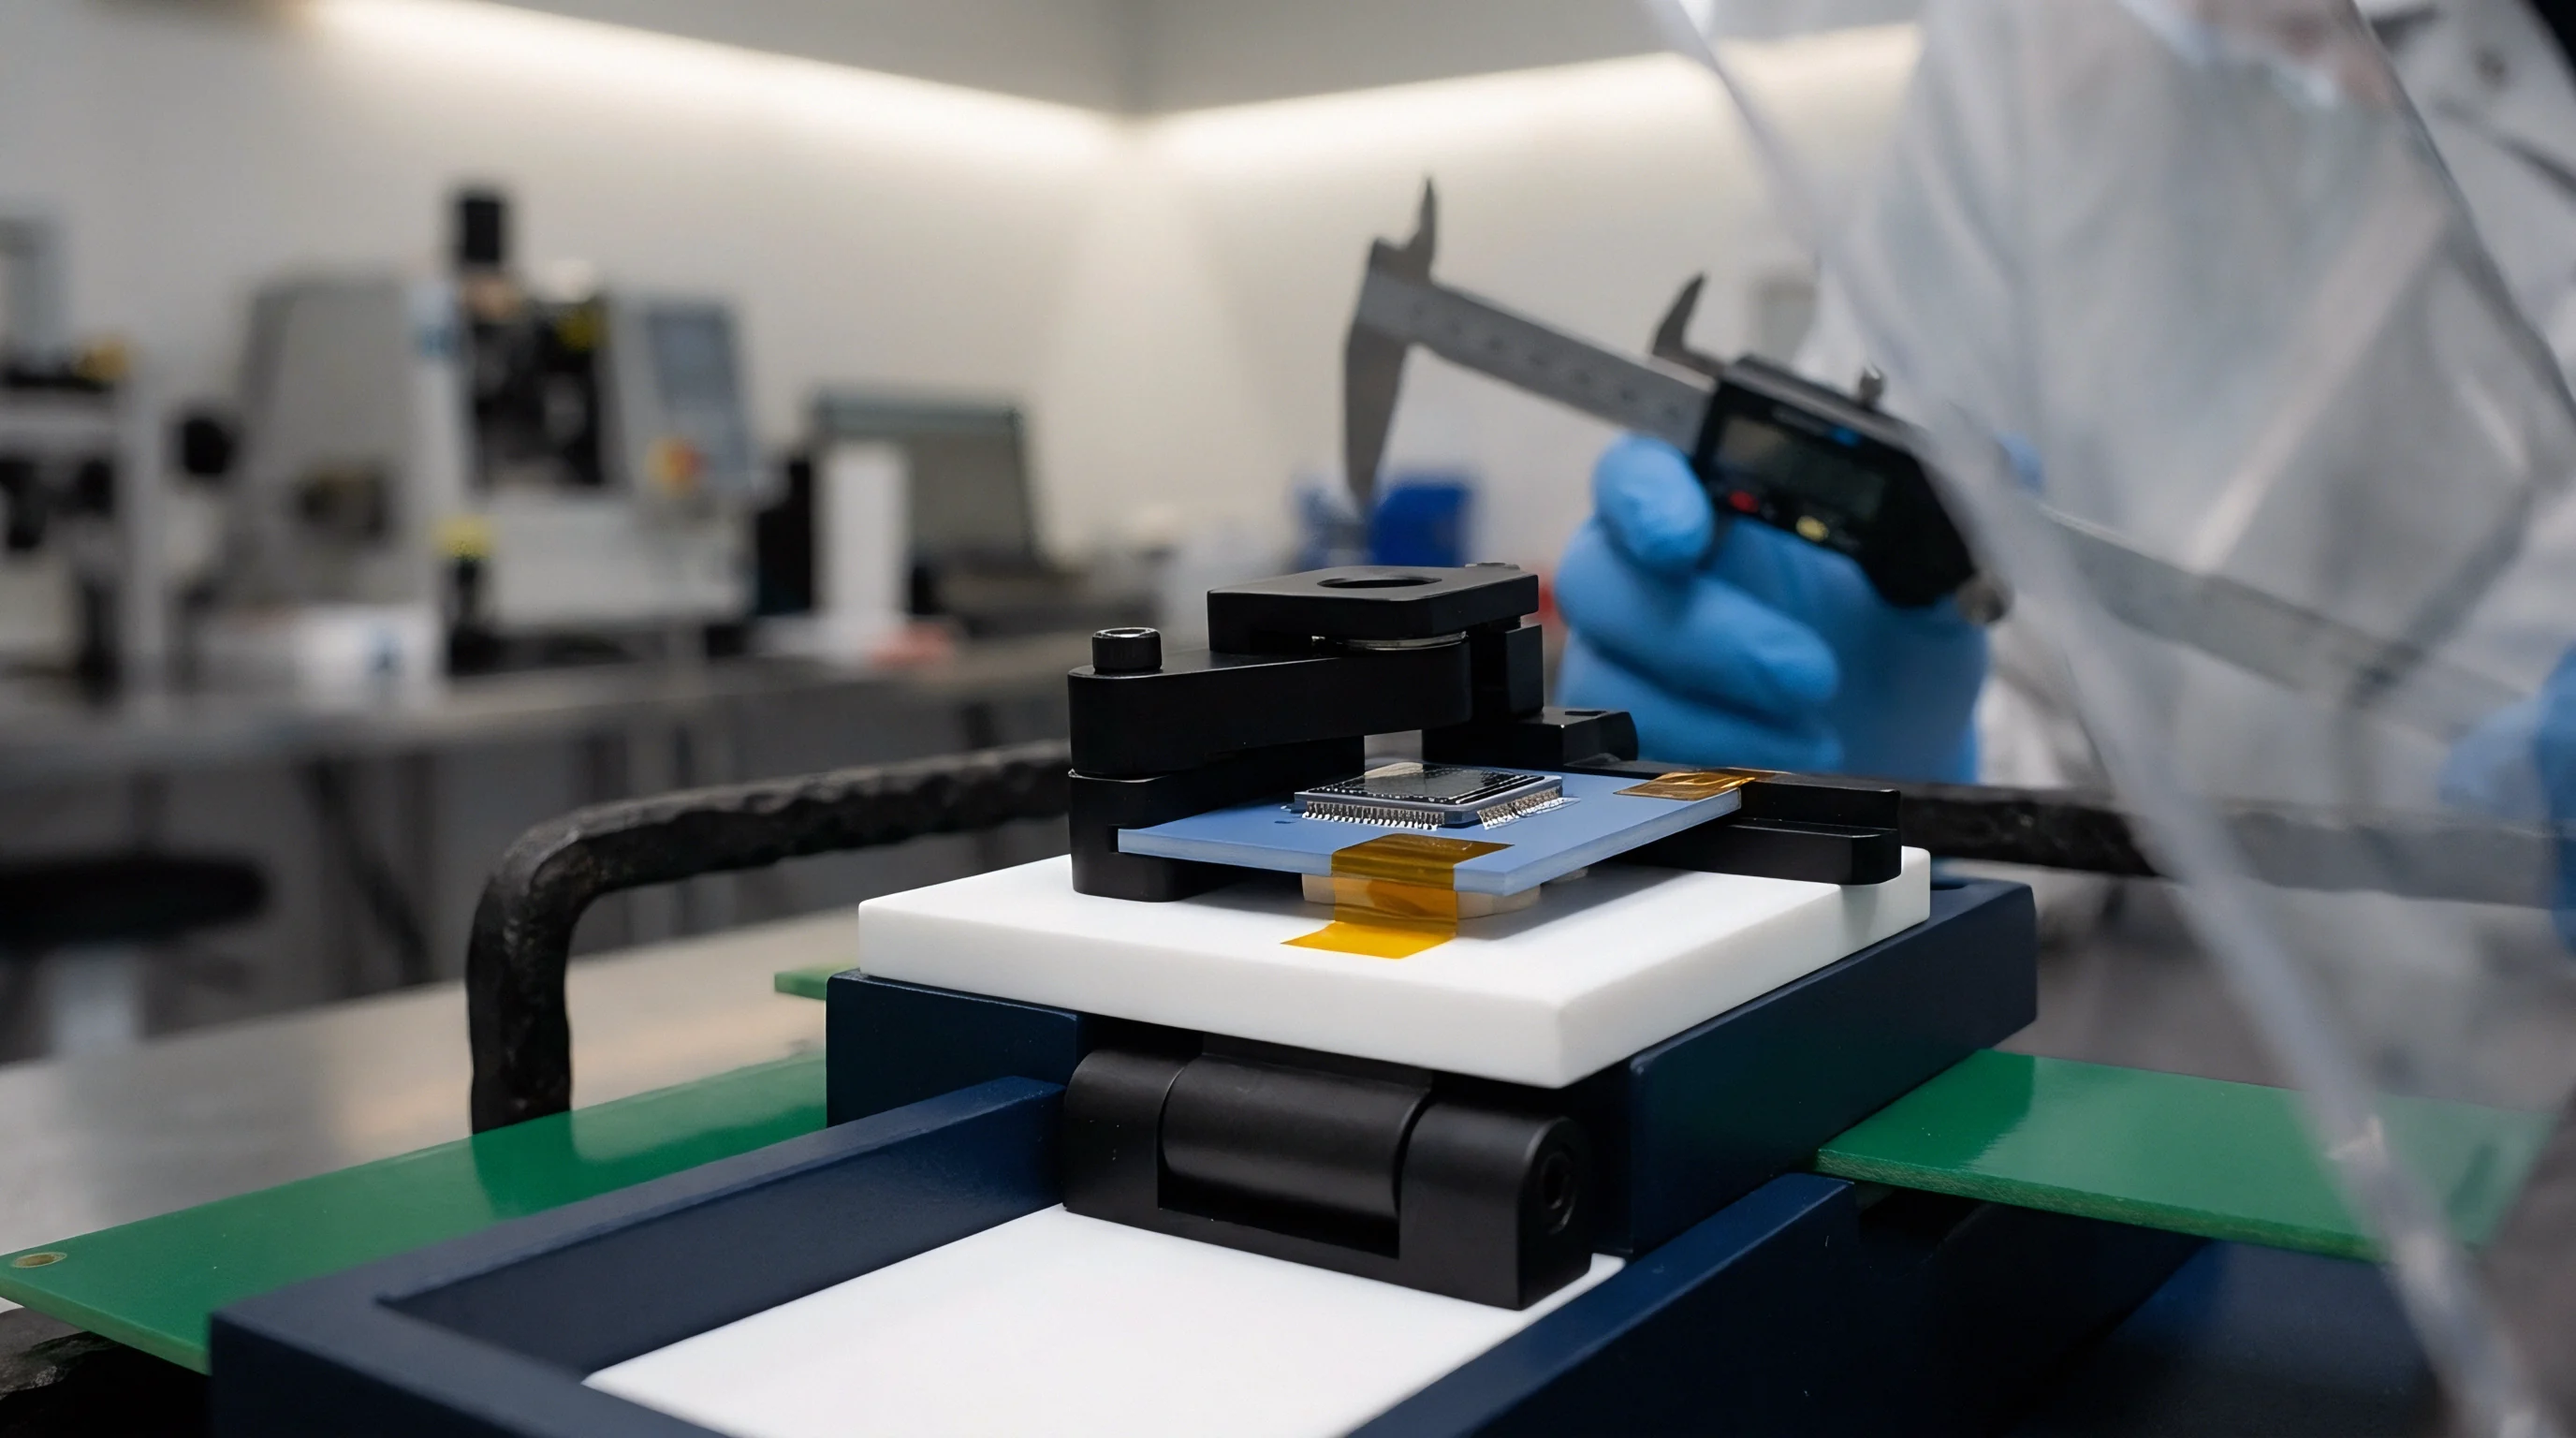
Bench testing incoming sensor shipments across expected operational temperature ranges exposes discrepancies between published claims and real hardware performance. A rigorous incoming inspection process verifies vendor claims before parts enter field installation. Factory calibration certificates cannot substitute for physical lot acceptance testing, as production variations and assembly tolerances create significant unit-to-unit spread in temperature coefficients.
A baseline verification sequence tests zero-point stability, span accuracy, thermal hysteresis, and electrical insulation resistance under controlled environmental chamber conditions.
Thermal chambers must provide programmed temperature ramping, precision humidity control, and multi-channel automated data acquisition. Testing incoming sensor lots prevents installing defective or out-of-spec instruments in remote field locations where replacement costs far exceed unit purchase prices. Developing an in-house thermal testing capability provides empirical evidence to negotiate vendor specifications and enforce quality performance standards.

Environmental Chamber Testing Sequence
Thermal cycling profiles hold devices at target temperature plateaus for two hours to reach complete internal thermal equilibrium. Rapid thermal ramps introduce dynamic stress that helps identify marginal solder joints, physical package strains, and unstable internal wire bonds. Testing starts at room temperature, ramps down to the minimum rated outdoor temperature, steps upward to the maximum operating temperature, and returns to twenty-five degrees Celsius to evaluate thermal hysteresis.
Data logging systems record continuous output measurements throughout the thermal ramp and soak cycle. Comparing baseline zero readings taken before thermal cycling with readings taken after returning to room temperature quantifies irreversible thermal shift. Sensors exhibiting zero shifts that exceed baseline stability thresholds indicate physical strain or material degradation within the sensing element package.
The numbered procedure below outlines the physical validation steps required to qualify outdoor sensor shipments prior to installation.
- Mount incoming sensor units inside the environmental chamber and connect electrical power, signal logging channels, and atmospheric pressure reference lines.
- Record baseline output readings, power supply current draw, and insulation resistance at twenty-five degrees Celsius and fifty percent relative humidity.
- Ramp chamber temperature down to minus twenty degrees Celsius at a rate of one degree per minute and maintain thermal soak for two hours.
- Log zero output voltage and span response across three pressure test points while holding the sub-zero plateau.
- Increase chamber temperature to plus sixty degrees Celsius at one degree per minute and maintain thermal soak for two hours.
- Measure high-temperature zero drift, span deviation, and power supply current consumption under peak thermal loading.
- Return chamber temperature to twenty-five degrees Celsius, allow two hours for thermal recovery, and measure residual offset hysteresis.

Incoming Inspection Protocol and Acceptance Limits
Statistical sampling plans establish lot compliance based on zero-point offset stability, span accuracy, and insulation resistance after damp heat exposure. Applying ISO 2859-1 sampling standards defines the required sample size based on total shipment volume. Acceptance Quality Limit levels dictate the maximum allowable number of non-conforming units before an entire production lot faces rejection and return to the supplier.
Uncompensated sensor offset drift leads to systemic measurement bias in remote outdoor networks.
Acceptance limits must account for thermal coefficient variations and baseline zero-point shifts recorded during chamber testing. Individual units exceeding thermal drift limits are rejected, while lot-wide failures indicate systemic manufacturing or calibration deficiencies at the factory. Establishing tight acceptance thresholds ensures that only field-ready instruments pass into operational inventory.
Long-term environmental stability testing evaluates sensor drift across weeks of continuous thermal cycling and humidity exposure. Accelerating environmental aging inside environmental test chambers exposes latent failure mechanisms, including seal degradation, metallic corrosion, and polymer dielectric breakdown. Continuous logging during accelerated aging reveals whether thermal compensation algorithms remain stable over prolonged outdoor service life.
Landed
Procurement costs scale rapidly when specifications mandate tight measurement accuracy across wide operating temperatures. Purchasing cheap sensors with baseline twenty-five degree Celsius specifications appears cost-effective on initial purchase orders. However, uncompensated environmental drift forces engineering teams to add external weather shields, secondary temperature sensors, heating elements, and software compensation layers.
The total cost of acquiring, housing, compensating, and maintaining a low-grade sensor frequently exceeds the initial purchase price of a fully calibrated wide-temperature instrument.
Precision outdoor instrumentation requires laser-trimmed thin-film resistor networks, hermetically sealed stainless steel housings, dynamic digital compensation microcontrollers, and individualized multi-point thermal chamber testing. Each manufacturing step adds direct cost to the bill of materials and production cycle times. Sourcing decisions must balance baseline purchase price against total landed cost, which includes verification testing, field re-calibration schedules, enclosure hardware, and potential warranty liabilities caused by inaccurate field measurements.
Grade Arithmetic and Unit Cost Escalation
Selecting an industrial sensor with expanded temperature calibration adds individual testing fees, mounting hardware expenses, and protective housing overhead. Commercial sensor offerings typically fall into three distinct grade tiers based on thermal calibration depth and housing construction. Standard commercial grade units carry single-point room-temperature calibration figures.
Industrial grade instruments include active internal thermal compensation and factory characterization across a standard operating range. High-reliability metrology grade instruments undergo multi-point thermal calibration inside automated environmental chambers, with individual calibration matrices stored in non-volatile memory onboard the sensor.
Price jumps non-linearly between grade levels. Transitioning from a single-point room-temperature calibrated unit to an individually multi-point temperature-compensated unit increases unit purchase price by two hundred to four hundred percent. However, choosing the higher grade sensor eliminates external compensation hardware and simplifies system integration.
The table below compares total acquisition and operational costs for three sensor sourcing strategies over a five-year outdoor deployment lifecycle.
| Cost Component | Commercial Grade (Uncompensated) | Industrial Grade (Factory Compensated) | Metrology Grade (Individual Multi-Point) | |
|---|---|---|---|---|
| Initial Unit Purchase Price | $85.00 | $275.00 | $650.00 | |
| Enclosure and Radiation Shielding | $120.00 | $60.00 | $40.00 | |
| Incoming Validation Testing | $45.00 | $25.00 | $15.00 | |
| Field Re-Calibration (5 Years) | $350.00 | $150.00 | $75.00 | |
| Estimated Thermal Error Impact | ±2.50% FS | ±0.50% FS | ±0.15% FS | |
| Total 5-Year Landed Cost Per Point | $600.00 | $510.00 | $780.00 | |||
Low-cost sensors demand frequent field re-calibration to adjust for zero-point drift and thermal aging, requiring technician site visits, reference calibrator transport, and system downtime. Industrial grade sensors with built-in thermal compensation provide the lowest total landed cost across a five-year service life by balancing reasonable initial purchase prices with minimal ongoing field maintenance needs.

Warranty Seams and Contract Specification Lines
Disputes between hardware buyers and original equipment manufacturers emerge when operating conditions fall outside reference calibration notes. Standard vendor sales terms specify that published accuracy limits apply exclusively at twenty-five degrees Celsius unless explicitly contracted otherwise. When field equipment fails accuracy audits due to outdoor thermal drift, manufacturers routinely deny warranty claims by pointing to temperature coefficient clauses buried in technical datasheets.
Contractual procurement specifications must explicitly define required accuracy limits across the entire expected operational temperature band. Specification lines should state maximum allowable total error budgets, including zero drift, span drift, and thermal hysteresis, across specified temperature endpoints. The decision list below outlines key contractual items procurement engineers must specify when buying outdoor measurement hardware.
- Operating Temperature Range Accuracy specifies maximum allowable total error across full environmental boundaries, including thermal drift coefficients.
- Individual Multi-Point Calibration Certificates require vendors to supply empirical test data recorded at minimum, ambient, and maximum operating temperatures.
- Thermal Hysteresis Boundaries set maximum allowable offset differences recorded before and after thermal cycling tests.
- Ingress and Condensation Resistance Standards demand verified IP67 or IP68 ratings alongside internal hydrophobic vent requirements.
- Long-Term Stability Guarantees define maximum allowable zero and span drift per year under continuous field service conditions.
A thermal coefficient of 0.05 percent per degree Celsius adds 1.25 percent error across a twenty-five degree temperature shift.
Contractual agreements must include explicit acceptance testing clauses that bind suppliers to replace non-conforming shipments. Incorporating ISO 10012 measurement management compliance requirements into procurement contracts obligates vendor compliance with standardized calibration, uncertainty reporting, and environmental validation procedures.