Auditing Traceability Chains and Uncertainty Budgets in Submersible Sensors
Submersible sensor accuracy requires unbroken ISO 17025 traceability and pressure-thermal uncertainty budgets to prevent costly subsea deployment failures

Lineage
Unbroken SI Transfer in Deepwater Instrumentation
Subsea sensor accuracy depends on an unbroken chain of comparisons from the ocean floor back to international standards maintained by National Metrology Institutes. Every link adds unallocated variance to the total measurement uncertainty. At four thousand meters depth, a pressure sensor reporting hydrostatic head produces raw voltages or counts that must be converted to absolute pressure; if its calibration rests on a secondary standard missing ISO/IEC 17025 accreditation, the claimed accuracy cannot be defended mathematically.
Physical factors in marine environments ~ fluid density shifts, thermal gradients, and transport shock on the way to deepwater berths ~ only widen these transfer errors.
Primary standards for submersible pressure gear rely on deadweight testers built with tungsten carbide piston-cylinder assemblies, calibrated directly at national laboratories. Conductivity measurements used for salinity trace back to Standard Seawater batches from Ocean Scientific International Ltd, where ratios match pure potassium chloride solutions under the Practical Salinity Scale of 1978. Temperature channels require platinum resistance thermometers calibrated at fixed points on the International Temperature Scale of 1990 ~ specifically water’s triple point and gallium’s melting point.
A discrepancy at any link skews sensor readings across an entire basin.
ISO/IEC 17025 Clause 7.8.4.3 requires calibration certificates to state expanded uncertainty alongside coverage factors, rendering bare tolerance claims contractually void.
Traceability breaks down most often during field span checks and routine factory recalibrations. Technicians and suppliers frequently run two-point trims against internal standards that are past due for calibration or were exposed without environmental controls. Once an unverified trim overwrites the factory calibration coefficients in non-volatile memory, the chain to national standards is cut.
Verifying a dossier means checking every certificate for explicit uncertainty values, reference ID numbers, ambient test conditions, and accredited scope approvals.
The table below details the calibration standard transfer hierarchy required to maintain metrological integrity from national institutes down to deployed oceanographic payloads.
| Calibration Level | Reference Artifact | Typical Standard Uncertainty | Primary Drift Mechanism |
|---|---|---|---|
| National Standard | Primary Tungsten Carbide Piston Gauge | 0.002% of reading | Piston wear and mass mass-property shifts |
| Accredited Transfer Lab | Secondary Quartz Pressure Reference | 0.008% of full scale | Crystal lattice relaxation and thermal creep |
| Factory Calibration Rig | Automated Pressure Controller | 0.015% of full scale | Valve seat leakage and manifold thermal shifts |
| Field Verification Unit | Portable Pressure Module | 0.050% of full scale | Transit shock, condensation, and zero drift |
A single unaccredited transfer step invalidates the calibration dossier for offshore monitoring and custody transfer. When contracts specify ISO 10012 measurement management systems, data backed by a broken chain must be rejected outright.

Bath
Hydrostatic and Thermal Equilibrium Test Conditions
Bench tests must replicate deep-sea fluid dynamics to be meaningful. Ambient room conditions cannot reproduce the mechanical stress or thermal stratification of deep water, where diaphragms, optical windows, and electrodes behave non-linearly under combined high pressure and near-freezing temperatures. Room-temperature testing masks cell distortion and pressure-induced thermal hysteresis.
Reaching thermal equilibrium in a calibration bath takes time because oceanographic housings hold so much heat. A heavy titanium or stainless enclosure with internal electronics often needs four hours in the bath to clear internal thermal gradients. Rapidly ramping temperature creates transient gradients across piezoresistive pressure bridges or platinum resistance elements, inducing false zero shifts that look like signal noise.
Hydrostatic testing also induces adiabatic heating. Taking a chamber to sixty megapascals warms the hydraulic fluid directly through compression. Reading a sensor immediately after pressurization captures an elevated temperature state that decays as the chamber dumps heat into its cooling jacket; accurate calibration requires waiting for the fluid temperature to settle within five millikelvins before taking output readings at each step.
- Thermal Stabilization Soak holds the fully immersed sensor housing in a bath controlled within two millikelvins for at least four hours before acquiring data.
- Pressure Cycling Pre-Conditioning runs three full-scale pressure sweeps from atmospheric to maximum ocean depth to work-harden seals and relieve stress in the housing.
- Multi-Point Ascending Measurement records steady-state output at no fewer than six pressure points across the depth range at a fixed bath temperature.
- Multi-Point Descending Measurement steps back down through the same pressure points to isolate diaphragm hysteresis.
- Thermal Step Repetition repeats the pressure matrix across three temperature plateaus representing surface, thermocline, and benthic conditions.
This sequence isolates physical hysteresis from baseline sensor drift. Skipping pre-conditioning introduces offset errors that show up as soon as the instrument settles on the seafloor.
Hydrostatic compression of hydraulic test fluid elevates chamber temperature, introducing transient measurement errors if calibration data is taken prior to thermal decay.
Mechanical flexing under ocean pressure also impairs accuracy. When housing end-caps flex, internal dimensions shift. On inductive conductivity sensors, this distorts the external electromagnetic field path; on optical dissolved oxygen sensors, window deflection alters the luminescence path length.
Test cells must have enough volume to keep chamber walls from interfering with sensor heads.
Factory acceptance tests conducted in ambient water tanks under zero applied pressure rely on theoretical finite element models rather than empirical testing under load.

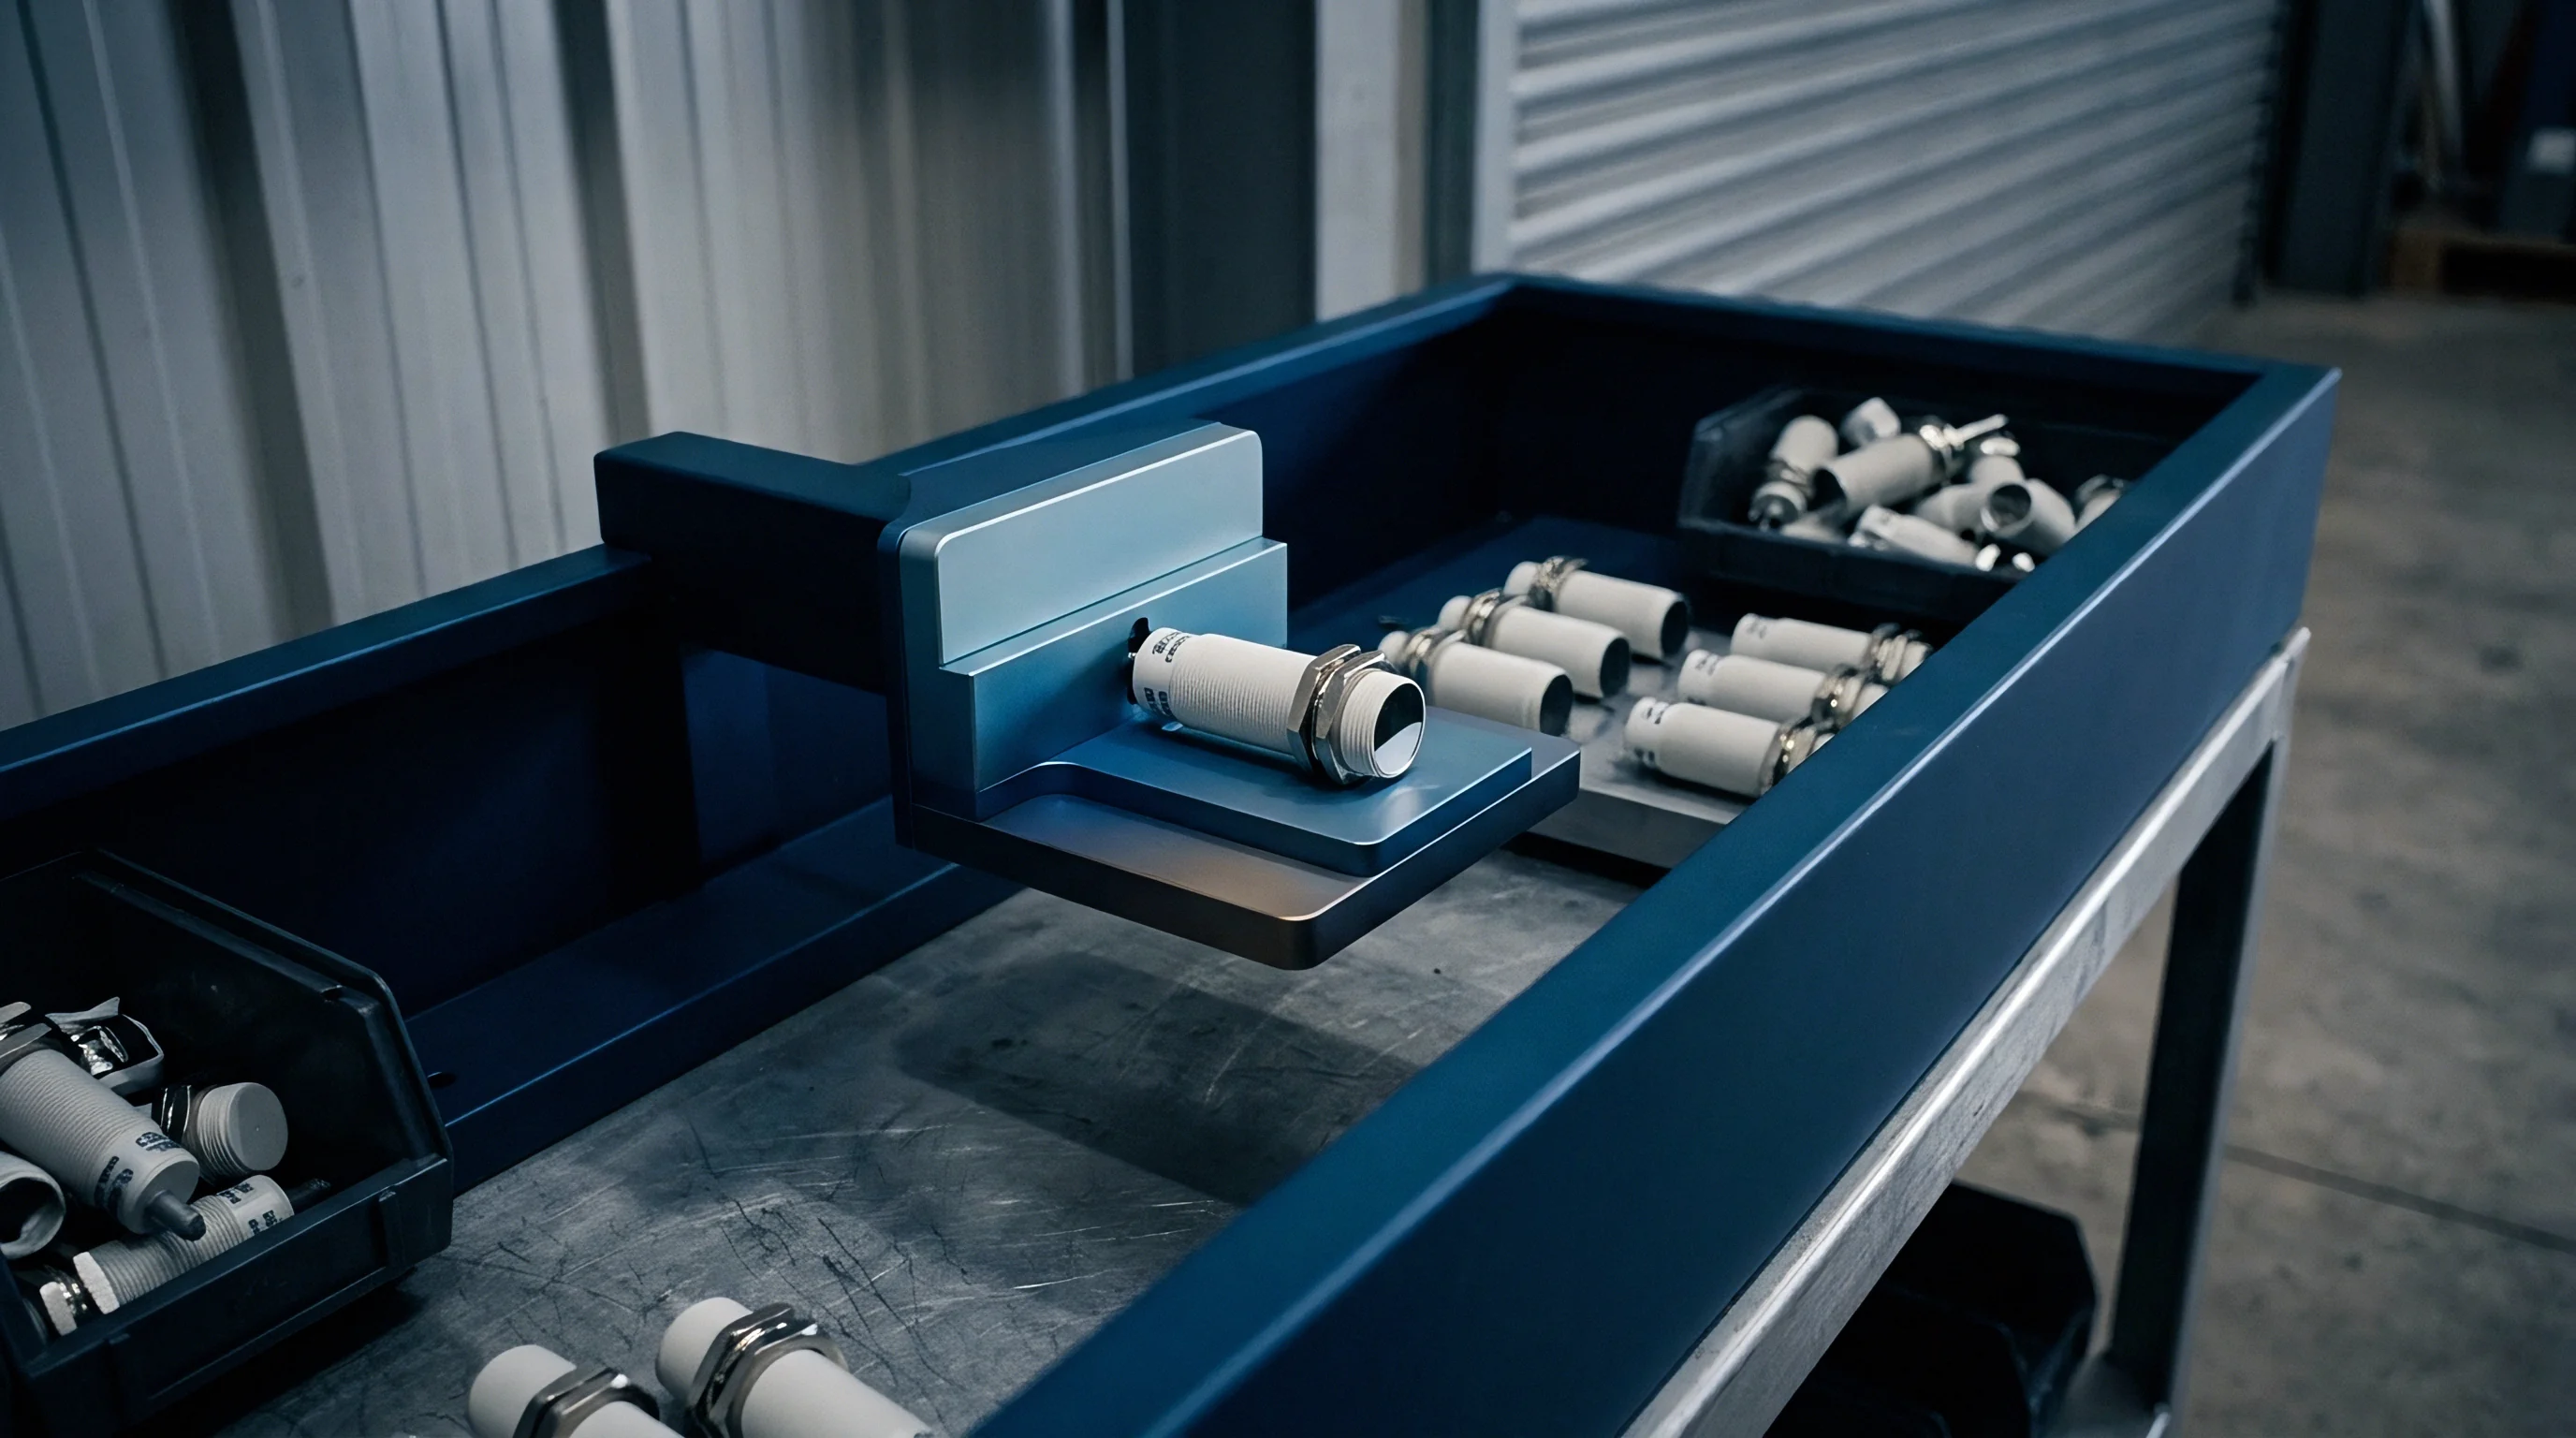
Budget
Quantifying Type a and Type B Uncertainty Components
Building a sound uncertainty budget follows JCGM 100:2008 (the Guide to the Expression of Uncertainty in Measurement). For submersible instruments, total uncertainty combines statistical analysis of repeated observations with determinations drawn from sensor physics, reference standards, and environmental factors. Evaluating a sensor deployed at three thousand meters means accounting for every individual contributor.
Type A evaluation isolated random fluctuations during steady-state bench testing. Repeated readings under controlled pressure and temperature reveal the noise floor of internal converters and signal conditioning circuits, with the experimental standard deviation of the mean giving the Type A value. Type B evaluation covers systematic effects: reference standard uncertainty, sensor non-linearity, residual thermal coefficients, power fluctuations, and element drift over time.
Consider a piezoresistive sensor rated for forty megapascals ~ roughly four thousand meters depth. Combining standard uncertainties yields the expanded measurement uncertainty at a ninety-five percent confidence level, using a coverage factor of k = 2.
The working assumptions for this evaluation include:
- Reference Standard Uncertainty carries a documented value of 0.80 kilopascals from an accredited calibration certificate, converted assuming a rectangular distribution.
- Sensor Non-Linearity and Hysteresis shows a maximum residual terminal error of 2.00 kilopascals across temperature, evaluated under a rectangular distribution.
- Thermal Coefficient Residuals add an uncorrected temperature effect of 1.20 kilopascals post digital compensation, assuming a normal distribution.
- Analog Signal Digitization Noise contributes 0.45 kilopascals of quantization uncertainty, modeled as a uniform rectangular distribution.
- Observed Measurement Repeatability produces a Type A standard deviation of the mean of 0.35 kilopascals over twenty continuous runs.
Converting these terms to standard uncertainties (ui) requires applying standard metrological divisors: rectangular distributions divide half-width limits by root three (roughly 1.732), while normal distributions divide by their coverage factor.
Reference calibration standard uncertainty is 0.80 divided by 2, or 0.400 kilopascals. Non-linearity is 2.00 divided by 1.732, giving 1.155 kilopascals. Thermal residual uncertainty is 1.20 divided by 2, giving 0.600 kilopascals.
Digitization noise is 0.45 divided by 1.732, yielding 0.260 kilopascals. Type A repeatability enters directly at 0.350 kilopascals.
Combining these independent variances requires taking the square root of the sum of their squares:
Combined Standard Uncertainty (uc) = sqrt( (0.400)^2 + (1.155)^2 + (0.600)^2 + (0.260)^2 + (0.350)^2 )
Combined Standard Uncertainty (uc) = sqrt( 0.1600 + 1.3340 + 0.3600 + 0.0676 + 0.1225 ) = sqrt( 2.0441 ) = 1.430 kilopascals.
Applying standard coverage factor k = 2 gives the final expanded uncertainty (U):
Expanded Uncertainty (U) = 2 × 1.430 = 2.860 kilopascals.
Converted to equivalent head, the sensor carries an expanded uncertainty of approximately 0.29 meters at four thousand meters depth under ideal conditions.
An uncertainty budget omitting thermal coefficient residuals systematically understates total measurement error by up to forty percent in deep ocean deployments.
The table below summarizes the uncertainty budget components for this representative submersible pressure sensor, detailing distribution models and sensitivity coefficients.
| Uncertainty Source | Value (+/-) | Probability Distribution | Divisor | Standard Uncertainty (ui) |
|---|---|---|---|---|
| Secondary Reference Standard | 0.80 kPa | Normal (k=2) | 2.000 | 0.400 kPa |
| Sensor Non-Linearity & Hysteresis | 2.00 kPa | Rectangular | 1.732 | 1.155 kPa |
| Residual Temperature Effect | 1.20 kPa | Normal (k=2) | 2.000 | 0.600 kPa |
| Quantization & Digital Noise | 0.45 kPa | Rectangular | 1.732 | 0.260 kPa |
| Type A Repeatability | 0.35 kPa | Normal (k=1) | 1.000 | 0.350 kPa |
Flaws in the budget lead directly to mistakes in subsea engineering ~ misinterpreting pressure changes during pipeline hydrotests or missing small movements in subsea manifolds.


Fouling

Temporal Degradation Mechanisms in Ocean Deployments
Submersing sensors for long periods subjects them to biological and chemical degradation that factory calibration cannot account for. Factory specs reflect clean, unexposed hardware. In seawater, marine organisms settle on optical lenses, glass electrodes, and membranes, driving drift that accelerates over time.
Bacteria form a gel matrix on exposed surfaces within hours, altering chemical diffusion and light transmission.
Optical sensors tracking dissolved oxygen, turbidity, or fluorometry lose signal as algae and organisms blanket quartz windows. Copper-nickel housings and wipers help delay growth but do not stop local chemical shifts. In luminescence-quenching oxygen sensors, bio-fouling consumes oxygen within the boundary layer, causing the sensor to read low even when its electronics and calibration coefficients are perfectly sound.
Conductivity cells suffer when growth restricts internal channels. Whether inductive or electrode-based, a cell relies on a fixed cell constant derived from its physical geometry. Barnacles or tubeworms attached inside the cell shrink the internal volume and shift that constant permanently.
Mineral scale and salt precipitation around hydrothermal vents alter cell geometry in the exact same way.
- Biofilm Layer Accumulation cuts optical transmission through glass windows, causing loss of sensitivity and span attenuation.
- Conductivity Cell Dimension Shift restricts flow paths, shifting cell constants and dragging salinity readings low.
- Glass Electrode Leaching strips alkali ions from pH glass membranes, raising impedance and slowing sensor response.
- Membrane Permeability Decay clogs porous barriers on galvanic oxygen sensors, driving zero-point offset drift.
- Piezoresistive Diaphragm Deposition builds mineral scale on thin metal diaphragms, adding mass and shifting the zero-pressure baseline.
Fouling distorts localized chemistry long before a sensor fails mechanically. Keeping sensors accurate over multi-year deployments requires mechanical wipers and periodic physical verification.

Outlay

Commercial Evaluation of Accuracy Tiers and Maintenance Logistics
Buying oceanographic instruments requires balancing upfront capital cost against support over the sensor’s lifecycle. Commercial datasheets emphasize accuracy figures achieved under bench conditions. Buying on unit price alone ~ without factoring in accredited calibration certificates, field verification gear, and offshore recalibration logistics ~ exposes long-term monitoring programs to unexpected costs.
Certificate costs depend heavily on accreditation levels and the number of pressure and temperature test points. A basic factory compliance certificate at two room-temperature points adds little cost, but yields far too little data for deepwater work. An ISO/IEC 17025 accredited certificate covering six pressure steps across four temperature plateaus can add thirty percent to the purchase price ~ though skipping it forces expensive third-party testing before deployment.
Field maintenance dominates lifecycle operating budgets. Recalibrating deepwater sensors requires retrieving them, which means booking offshore vessels with heavy crane and ROV capability at fifty thousand to over one hundred fifty thousand dollars a day. Cheap sensors with unverified drift rates around 0.1% of full scale per year force frequent retrievals; paying more for stable units with documented drift under 0.01% full scale extends deployment intervals from twelve to thirty-six months, saving far more in vessel time than the instrument cost.
Choosing accuracy grades comes down to matching sensor specs to actual project requirements. Specifying high-precision sensors for short-term surveys drives up capital costs with no practical benefit, while over-specifying tolerances narrows the vendor pool, stretches lead times, and raises routine calibration fees. Under-specifying tolerances in subsea custody transfer is equally risky, exposing operators to financial losses from unquantified volume errors.
Procurement must balance initial cost against long-term risk, maintenance, and uncertainty targets.