Determining Accelerometer Zero Offset Errors during Bench Calibration
Static multi-position gravity inversion separates zero-g offset from scale factor while Allan variance bias instability defines maximum valid integration time.

Tumble
Static multipoint inversion separates zero-g bias from gravitational acceleration by relying on geometric symmetry. Aligning an accelerometer’s sensitive axis parallel and orthogonal to gravity creates reference input states without requiring dynamic shakers or optical standards. In a standard six-position tumble test, the unit rotates through positive and negative alignments along the local geographic axes.
At each static dwell, proof mass deflection captures true sensor bias combined with gravity, cross-axis coupling, and mounting package stress.
Local gravity varies across the Earth’s surface from roughly 9.780 m/s² at the equator to 9.832 m/s² at the poles. Because of this variation, bench fixtures using local gravity as a reference require an accurate local figure derived from elevation and latitude models or direct gravimeter readings. Resting a triaxial sensor on a leveled granite plate with its z-axis pointing straight up yields an output vector equal to the 1 g gravity vector plus the internal zero-offset vector.
Inverting the package 180 degrees flips the direction of gravity across the sense combs, but the zero-offset voltage retains its polarity.
Summing readings from opposing orientations isolates fixed bias from scale factor. Defining the upright reading as positive output voltage and the inverted reading as negative output voltage, adding the two cancels the gravity vector and leaves twice the zero-g offset. Subtracting them cancels the offset instead, yielding twice the scale factor scaled by local gravity.
This basic algebraic split underpins most static calibration routines.
A six-position static tumble test across positive and negative orthogonal axes cancels the local gravitational component to isolate zero-g bias within 15 micro-g at 25 degrees Celsius.
The capacitive front-end signal chain introduces its own DC offset. Switched-capacitor charge amplifiers convert sub-femtofarad shifts between moving proof mass fingers and stationary substrate fingers into baseband voltages. Input offset voltages in the CMOS operational transconductance amplifiers, analog switch charge injection mismatches, and trace parasitics in package routing all register as static DC offsets.
Mechanically, proof mass displacement from internal package stress produces an output indistinguishable from real acceleration.

Orientation Sequences and Mathematical Extraction
Six orthogonal positions represent the minimum necessary to extract all three bias terms and three scale factors simultaneously. Precision dividing heads or motorized indexers step the device through positive and negative alignments along X, Y, and Z. The test routine integrates stationary output over a defined window once mechanical settling finishes.
Table 1 outlines the orientation matrix and ideal output responses for a triaxial sensor undergoing a six-position static tumble sequence. Measured values depart from these ideal responses due to true zero offset, scale factor error, and cross-axis misalignments.
| Orientation Index | Device Facing Axis Upward | X Sense Output | Y Sense Output | Z Sense Output | Primary Target Parameter |
|---|---|---|---|---|---|
| Pos-1 | +Z Axis (Zenith) | 0 g + Bias X | 0 g + Bias Y | +1 g + Bias Z | Z Scale Factor & Bias Z |
| Pos-2 | -Z Axis (Nadir) | 0 g + Bias X | 0 g + Bias Y | -1 g + Bias Z | Z Axis Inversion Reference |
| Pos-3 | +X Axis (Zenith) | +1 g + Bias X | 0 g + Bias Y | 0 g + Bias Z | X Scale Factor & Bias X |
| Pos-4 | -X Axis (Nadir) | -1 g + Bias X | 0 g + Bias Y | 0 g + Bias Z | X Axis Inversion Reference |
| Pos-5 | +Y Axis (Zenith) | 0 g + Bias X | +1 g + Bias Y | 0 g + Bias Z | Y Scale Factor & Bias Y |
| Pos-6 | -Y Axis (Nadir) | 0 g + Bias X | -1 g + Bias Y | 0 g + Bias Z | Y Axis Inversion Reference |
Calculating the bias vector requires a basic linear combination. For each axis, the true zero-g offset equals the arithmetic mean of the positive and negative readings taken along that axis:
Bias X = 0.5 (Output Pos-3 + Output Pos-4)
Bias Y = 0.5 (Output Pos-5 + Output Pos-6)
Bias Z = 0.5 (Output Pos-1 + Output Pos-2)
Extracting scale factor involves dividing half the difference between opposing static readings by the local gravity constant:
Scale Factor X = (Output Pos-3 – Output Pos-4) / (2 g_local)
Scale Factor Y = (Output Pos-5 – Output Pos-6) / (2 g_local)
Scale Factor Z = (Output Pos-1 – Output Pos-2) / (2 g_local)
Twelve and Twenty-Four Position Extensions
Die-to-package non-orthogonality warps data collected from basic six-position routines. If a sensitive axis tilts by an angle theta relative to the package reference flat, a cross-axis component proportional to the sine of theta leaks into the measurement. An angular error of 0.1 degrees projects 1.745 milli-g of gravity into an axis that should see zero stimulus.
Standard six-position runs cannot isolate these cross-axis tilt angles from true electrical and mechanical zero offsets without separate fixture characterization.
Expanding calibration to twelve or twenty-four positions decouples these cross-axis terms. Twelve-position routines generally incorporate intermediate 45-degree canted angles or rotate the package 90 degrees about its sensing normal at each cardinal orientation. Inverting the sensor diagonally forces cross-axis coupling to reverse phase relative to the sensor frame.
A nonlinear least-squares fit then resolves an ellipsoid model with nine parameters: three biases, three scale factors, and three inter-axis cross-coupling angles.
Higher-order tumble routines demand strict control over motion and sampling timing:
- Mounting plate thermal equilibrium stabilizes the fixture and sensor package within 0.05 degrees Celsius of ambient test chamber setpoints prior to commencing mechanical indexing steps.
- Dividing head orientation sequencing positions the carrier through predetermined angular coordinates with an indexing precision exceeding 2 arcseconds per axis.
- Post-index mechanical dwell period allows motor vibration, elastomeric settling, and fluidic squeeze-film damping transients within the sensor package to decay completely before sampling.
- Synchronous burst sampling captures digital acceleration words over an integer number of power line cycles to reject 50 Hz and 60 Hz magnetic interference and ripple.
- Matrix inversion parameter fitting solves the nine-parameter sensor error equation through singular value decomposition of the measured gravity projection vectors.
Adding orientations lowers residual uncertainty in extracted zero offsets. A twenty-four-position tumble averages out planar wobble in rotary stage bearings; keeping indexing errors under 5 arcseconds restricts residual gravity contamination to less than 24 micro-g per axis.
Test engineers must balance integration time against thermal drift during longer runs. A twenty-four-position sequence dwelling twenty seconds per point takes eight minutes. If chamber temperature shifts just 0.5 degrees Celsius across that window, temperature coefficients between 0.1 and 1.0 milli-g per degree Celsius corrupt the calculated zero-g figures.
Thermal stability must hold relative to total sequence runtime.
Whenever fixture alignment strays outside tolerance, unmodeled gravity projections corrupt zero-offset calculations across all three axes.

Hysteresis
Thermal swings induce mechanical stress changes within MEMS packages that leave non-repeatable zero-offset errors. Silicon carries a coefficient of thermal expansion near 2.6 parts per million per Kelvin, compared to 14 to 17 parts per million per Kelvin for standard FR4. Die-attach adhesives and epoxy mold compounds sit between these values, with glass transition temperatures that alter viscoelastic behavior during thermal ramps.
As temperature cycles, expansion mismatches create asymmetric shear and compressive strain across the silicon suspension springs.
These thermo-mechanical stresses directly distort the anchor pads supporting the proof mass fingers. Moving an anchor by a single nanometer alters differential capacitance by fractions of a femtofarad, appearing as tens of milli-g of apparent offset. Because polymers in die adhesives relax viscoelastically over time, the stress state at any given temperature depends on whether the device was heated or cooled to reach it.
This path divergence between heating and cooling curves forms thermal zero-offset hysteresis.
Measuring offset across temperature requires closed-loop environmental chambers fitted with conductive heat-sink fixtures. Thermal slew rates should stay below 1.0 degree Celsius per minute; rapid ramps generate internal temperature gradients across the package, driving differential expansion between opposing die anchors. Transient offset spikes from these gradients mask true steady-state behavior.
Can Multipoint Calibration Eliminate Package Stress Shifts?
Polynomial temperature compensation in host firmware corrects repeatable linear and quadratic drift. Third-order curves map zero offset against an on-chip temperature diode, which works reliably for monotonic drift. They cannot, however, track or cancel path-dependent hysteresis loops caused by structural relaxation in mounting adhesives.
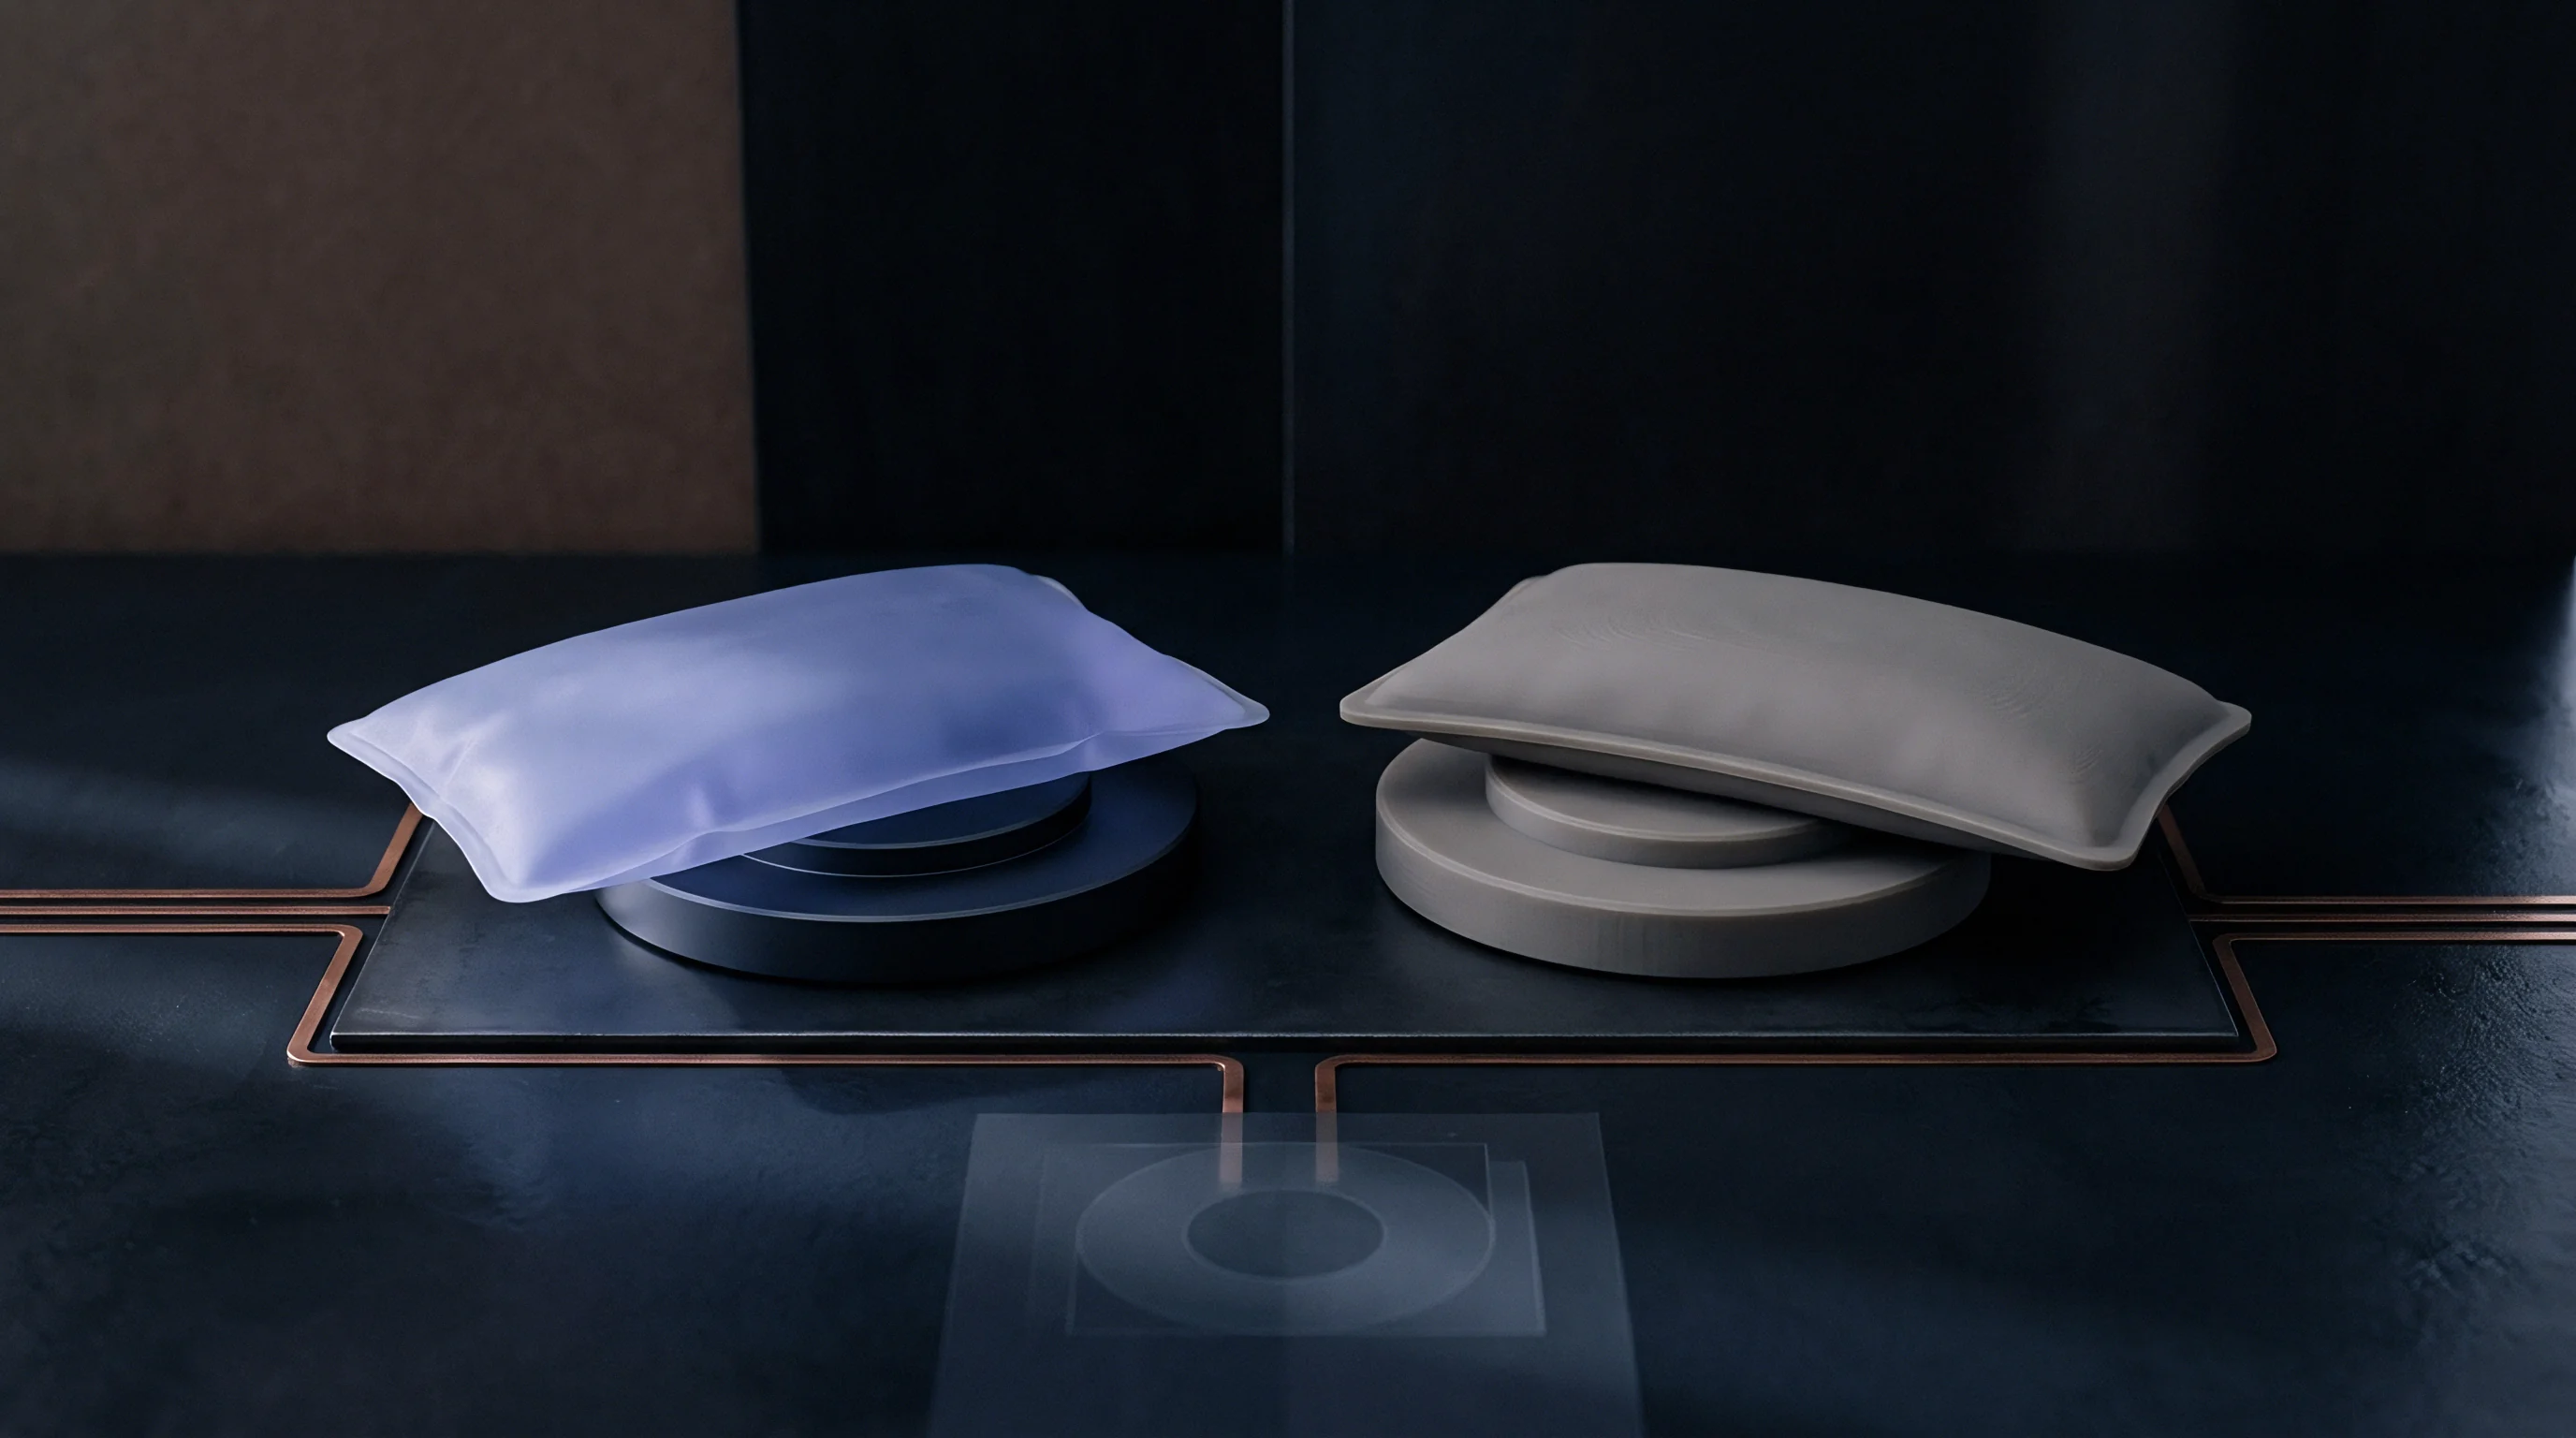
Figure 1 demonstrates thermal hysteresis behavior in a capacitive MEMS accelerometer cycled between -40 degrees Celsius and +85 degrees Celsius. The heating trajectory diverges from the cooling trajectory by an offset delta that standard single-variable polynomial lookup tables cannot correct.
| Temperature Setpoint | Heating Branch Zero Offset | Cooling Branch Zero Offset | Hysteresis Delta | On-Chip Diode Voltage |
|---|---|---|---|---|
| -40 °C | +12.4 mg | +14.1 mg | 1.7 mg | 0.724 V |
| -20 °C | +8.1 mg | +10.5 mg | 2.4 mg | 0.680 V |
| 0 °C | +3.5 mg | +6.2 mg | 2.7 mg | 0.636 V |
| +25 °C | 0.0 mg (Ref) | +2.9 mg | 2.9 mg | 0.581 V |
| +50 °C | -4.2 mg | -1.8 mg | 2.4 mg | 0.526 V |
| +70 °C | -8.9 mg | -7.1 mg | 1.8 mg | 0.482 V |
| +85 °C | -13.5 mg | -13.5 mg | 0.0 mg | 0.449 V |
The widest hysteresis gap occurs mid-range, near room temperature (+25 degrees Celsius). At thermal extremes (-40 degrees Celsius and +85 degrees Celsius), extended dwell times allow adhesive relaxation toward temporary equilibrium, narrowing the gap between branches. Returning the component to ambient bench conditions after a high-temperature soak leaves a residual offset of roughly 2.9 milli-g.
When a design relies strictly on factory room-temperature calibration, that baseline shifts after the initial heat cycle in operation.
Procurement evaluation requires separating bare-die numbers from board-mounted performance. Datasheet zero-g drift over temperature is frequently evaluated in unconstrained ceramic packages or via wafer probers. Soldering a component onto an FR4 PCB creates rigid joints that transfer board warpage straight into the die.
Lead-free SAC305 reflow cycles peak near 260 degrees Celsius, locking in baseline strain during cooldown that can amplify thermal hysteresis three- to five-fold.

Thermal Time Constants and Gradient Settling
Thermal conduction through calibration fixtures governs the wait time needed before logging usable data. Air temperature sensors in a test chamber reach setpoints long before an encapsulated die inside an LGA or QFN stabilizes. The thermal time constant tau for a surface-mount package on a test board ranges from 15 to 45 seconds, depending on nearby copper plane mass.
Sampling before five time constants elapse captures dynamic gradient artifacts rather than steady-state offsets. If the top mold compound cools faster than the bottom ground pad, the resulting internal bending moment flexes the cavity ceiling. This alters the squeeze-film air gap over the proof mass and unbalances the capacitive bridge.
A thermal rate of change exceeding 1.0 degree Celsius per minute introduces dynamic internal package gradients that distort steady-state zero offset extractions by up to 5 milli-g.
Bench design should address these thermal dynamics using several structural techniques:
- Direct fixture conduction paths utilize copper or aluminum mounting chucks with embedded Peltier thermoelectric coolers to bypass sluggish forced-air convective transfer dynamics.
- Symmetric ground plane geometries prevent anisotropic board warping beneath the sensor package during temperature ramps across the operating envelope.
- Underfill adhesive selection matches the glass transition temperature outside the operating calibration envelope while balancing modulus to prevent stress concentration.
- Corner stress relief routing introduces isolation slots in the printed circuit board surrounding the accelerometer footprint to decouple structural board flexure.
Secondary thermal shifts also originate in the voltage reference driving the internal ADC. Bandgap references exhibit parabolic temperature drift, typically 10 to 50 parts per million per Kelvin. A 100 microvolt shift in reference voltage scales digital output, producing an apparent acceleration offset if the sensing bridge is non-ratiometric.
Published three-sigma drift figures across a wafer run often mask lot-to-lot variations in epoxy cure shrinkage.
Noise
Inherent noise in the sensing element and signal chain establishes the floor for zero-offset measurement precision. Pickoff amplifier resistors generate white Johnson-Nyquist noise, while Brownian motion of residual gas molecules against the proof mass creates mechanical force noise scaling inversely with mass and damping. These wideband sources integrate into velocity random walk, imposing statistical uncertainty over finite averaging windows.
At lower frequencies, 1/f flicker noise from gate oxide interfaces in input MOS transistors dominates below 10 Hz. Unlike white noise, flicker noise cannot be averaged out by extending acquisition times. Longer integration windows capture non-stationary baseline drift that mimics genuine long-term offset shift.
Allan variance analysis identifies the crossover point between white noise reduction and flicker noise drift. Plotting Allan deviation against cluster time tau on logarithmic axes highlights the specific averaging window that minimizes offset uncertainty.
Allan Variance Characterization of Offset Limits
The Allan deviation curve drops with a -1/2 slope where white noise dominates. In this region, averaging N points reduces the standard error of the mean by 1/sqrt(N). As tau increases, the curve reaches its minimum at the bias instability floor.
Beyond this trough, it turns upward with a +1/2 slope as flicker noise, thermal wander, and aging dominate.
Table 2 lists representative Allan variance parameters and noise performance boundaries across three MEMS accelerometer operational grades measured at 25 degrees Celsius.
| Sensor Operational Grade | Noise Density | Velocity Random Walk | Bias Instability Floor | Optimal Averaging Time (Tau) |
|---|---|---|---|---|
| Consumer Mobile (Capacitive) | 150 ug / sqrt(Hz) | 0.088 m/s / sqrt(hr) | 45 ug | 12 seconds |
| Industrial Navigation (Capacitive) | 20 ug / sqrt(Hz) | 0.012 m/s / sqrt(hr) | 3.5 ug | 110 seconds |
| Tactical Inertial (Resonant Silicon) | 1.5 ug / sqrt(Hz) | 0.0009 m/s / sqrt(hr) | 0.2 ug | 850 seconds |
The minimum point on the curve marks the threshold where integration should end. For consumer sensors, averaging past 12 seconds degrades the zero-offset estimate as flicker noise and thermal drift pull the mean away from true zero-g. Industrial sensors benefit from integration up to roughly two minutes, while tactical-grade resonant silicon units sustain continuous averaging for fifteen minutes before reaching their bias floor.

Does Short Integration Time Mask Thermal Bias Drift?
Shortening integration times to boost bench throughput introduces substantial random sampling error into offset calculations. If an automated handler logs data for only 50 milliseconds to maintain high UPH, wideband noise feeds straight into offset registers. For a sensor with 150 micro-g per square root Hertz noise density running at a 1 kHz sample rate, a 50-millisecond window captures 50 samples ~ leaving a standard error near 670 micro-g.
Conversely, excessively long single-orientation dwells leave measurements exposed to lab temperature shifts. Without tight climate control within a fraction of a degree, routine HVAC cycles induce linear temperature ramps that distort the Allan variance curve and artificially raise the measured bias instability floor.
The signal chain requires specific conditioning steps to ensure valid offset calculations:
- Anti-aliasing filter configuration sets internal digital low-pass corner frequencies to less than one-third of the target output data rate, preventing high-frequency out-of-band package resonances from folding into baseband.
- Decimation and burst logging captures raw uncalibrated digital acceleration words directly from register memory without onboard firmware offsets or digital high-pass filters enabled.
- Data stationarity verification computes the rolling variance over sub-windows to detect external acoustic shocks or mechanical footsteps that invalidate static assumptions.
- Optimal window integration averages stationary acceleration words across the exact tau duration defined by the device bias instability minimum.
Power supply rejection also influences offset stability. Switching regulators running at 1.2 MHz or 2.4 MHz create supply line ripple that couples into internal charge pumps. A 10-millivolt ripple can induce a DC offset shift of 2 to 5 milli-g through asymmetric rectification in input charge amplifier switches.
Clean linear regulators or battery supplies are essential for sub-milli-g measurement.
Longer averaging windows suppress white noise, but they do nothing to correct low-frequency baseline drift.
Averaging static acceleration output past the Allan variance bias instability floor increases measurement error by integrating low-frequency flicker noise and ambient thermal drift.
Trimming test integration times below twenty time constants in production yields broad, artificial zero-offset distributions driven entirely by noise sampling artifacts.

Fixture
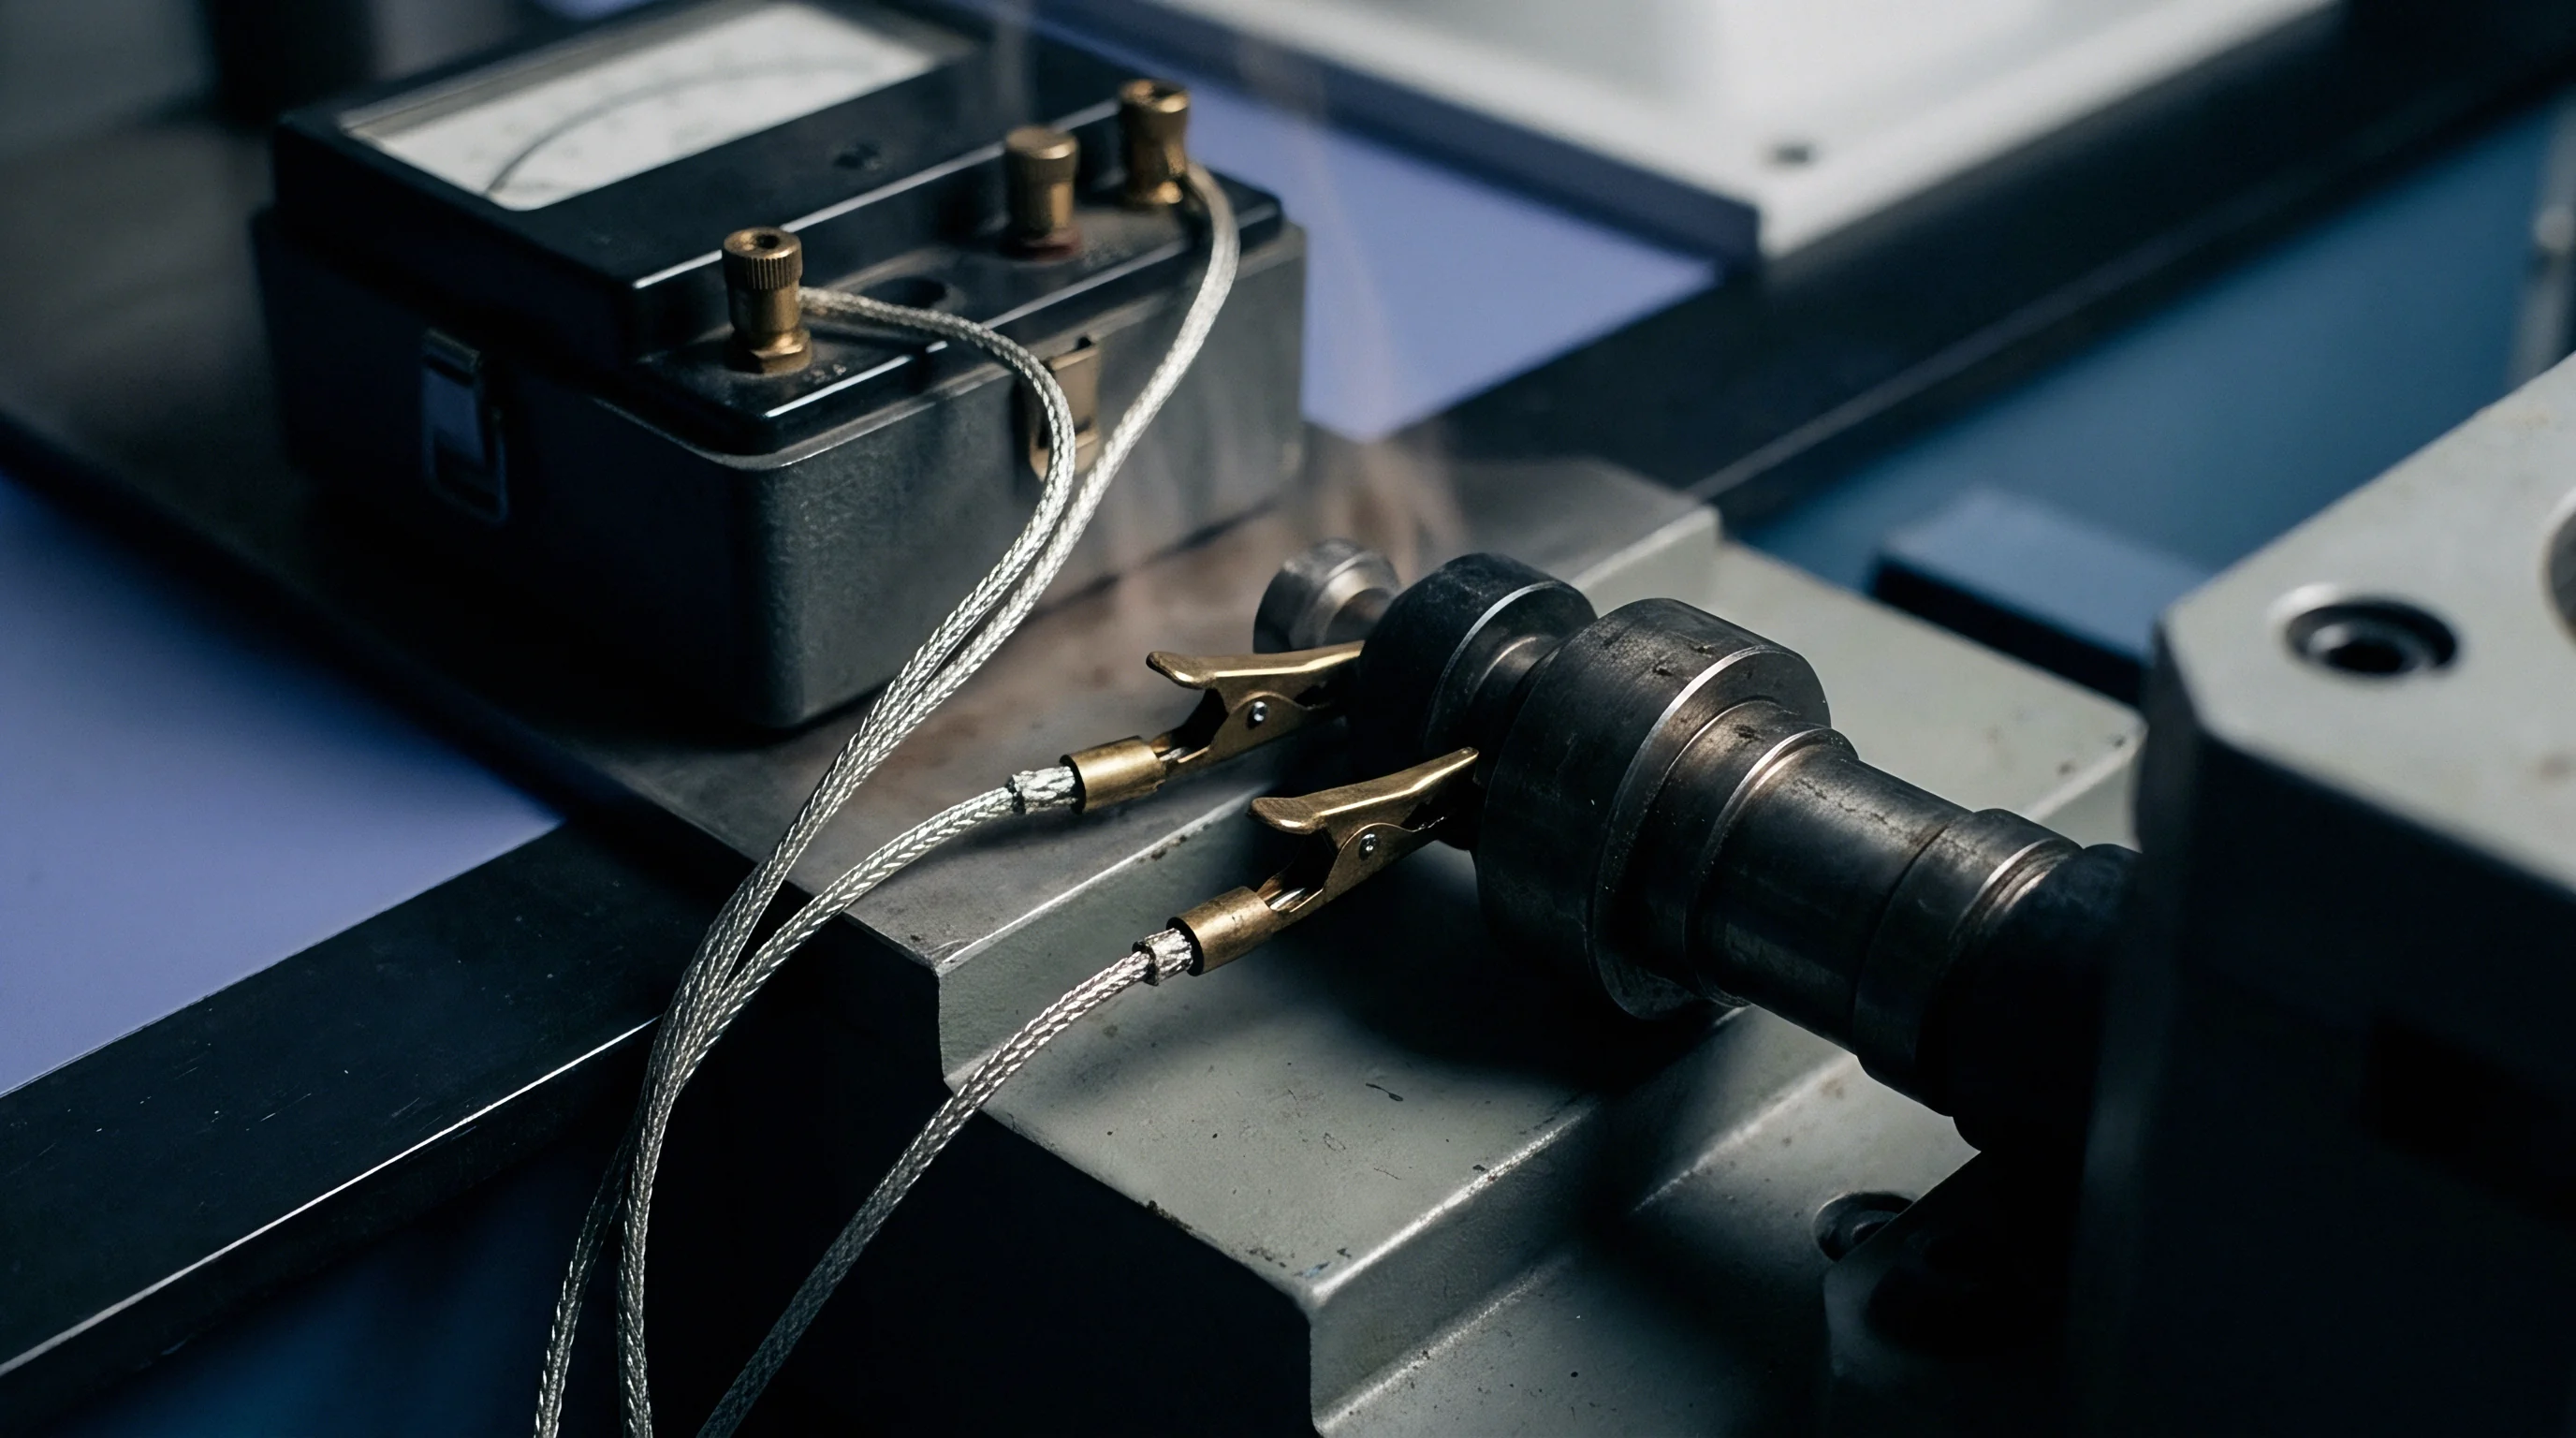
Mechanical coupling between the sensor package and reference plane readily distorts zero-offset measurements. Clamping forces, fastener torque, and socket contact pins transmit strains through the leadframe to the die. Uneven load on an LGA package corner, for instance, induces a bending moment that mimics proof-mass deflection, creating artificial offsets up to 15 milli-g.
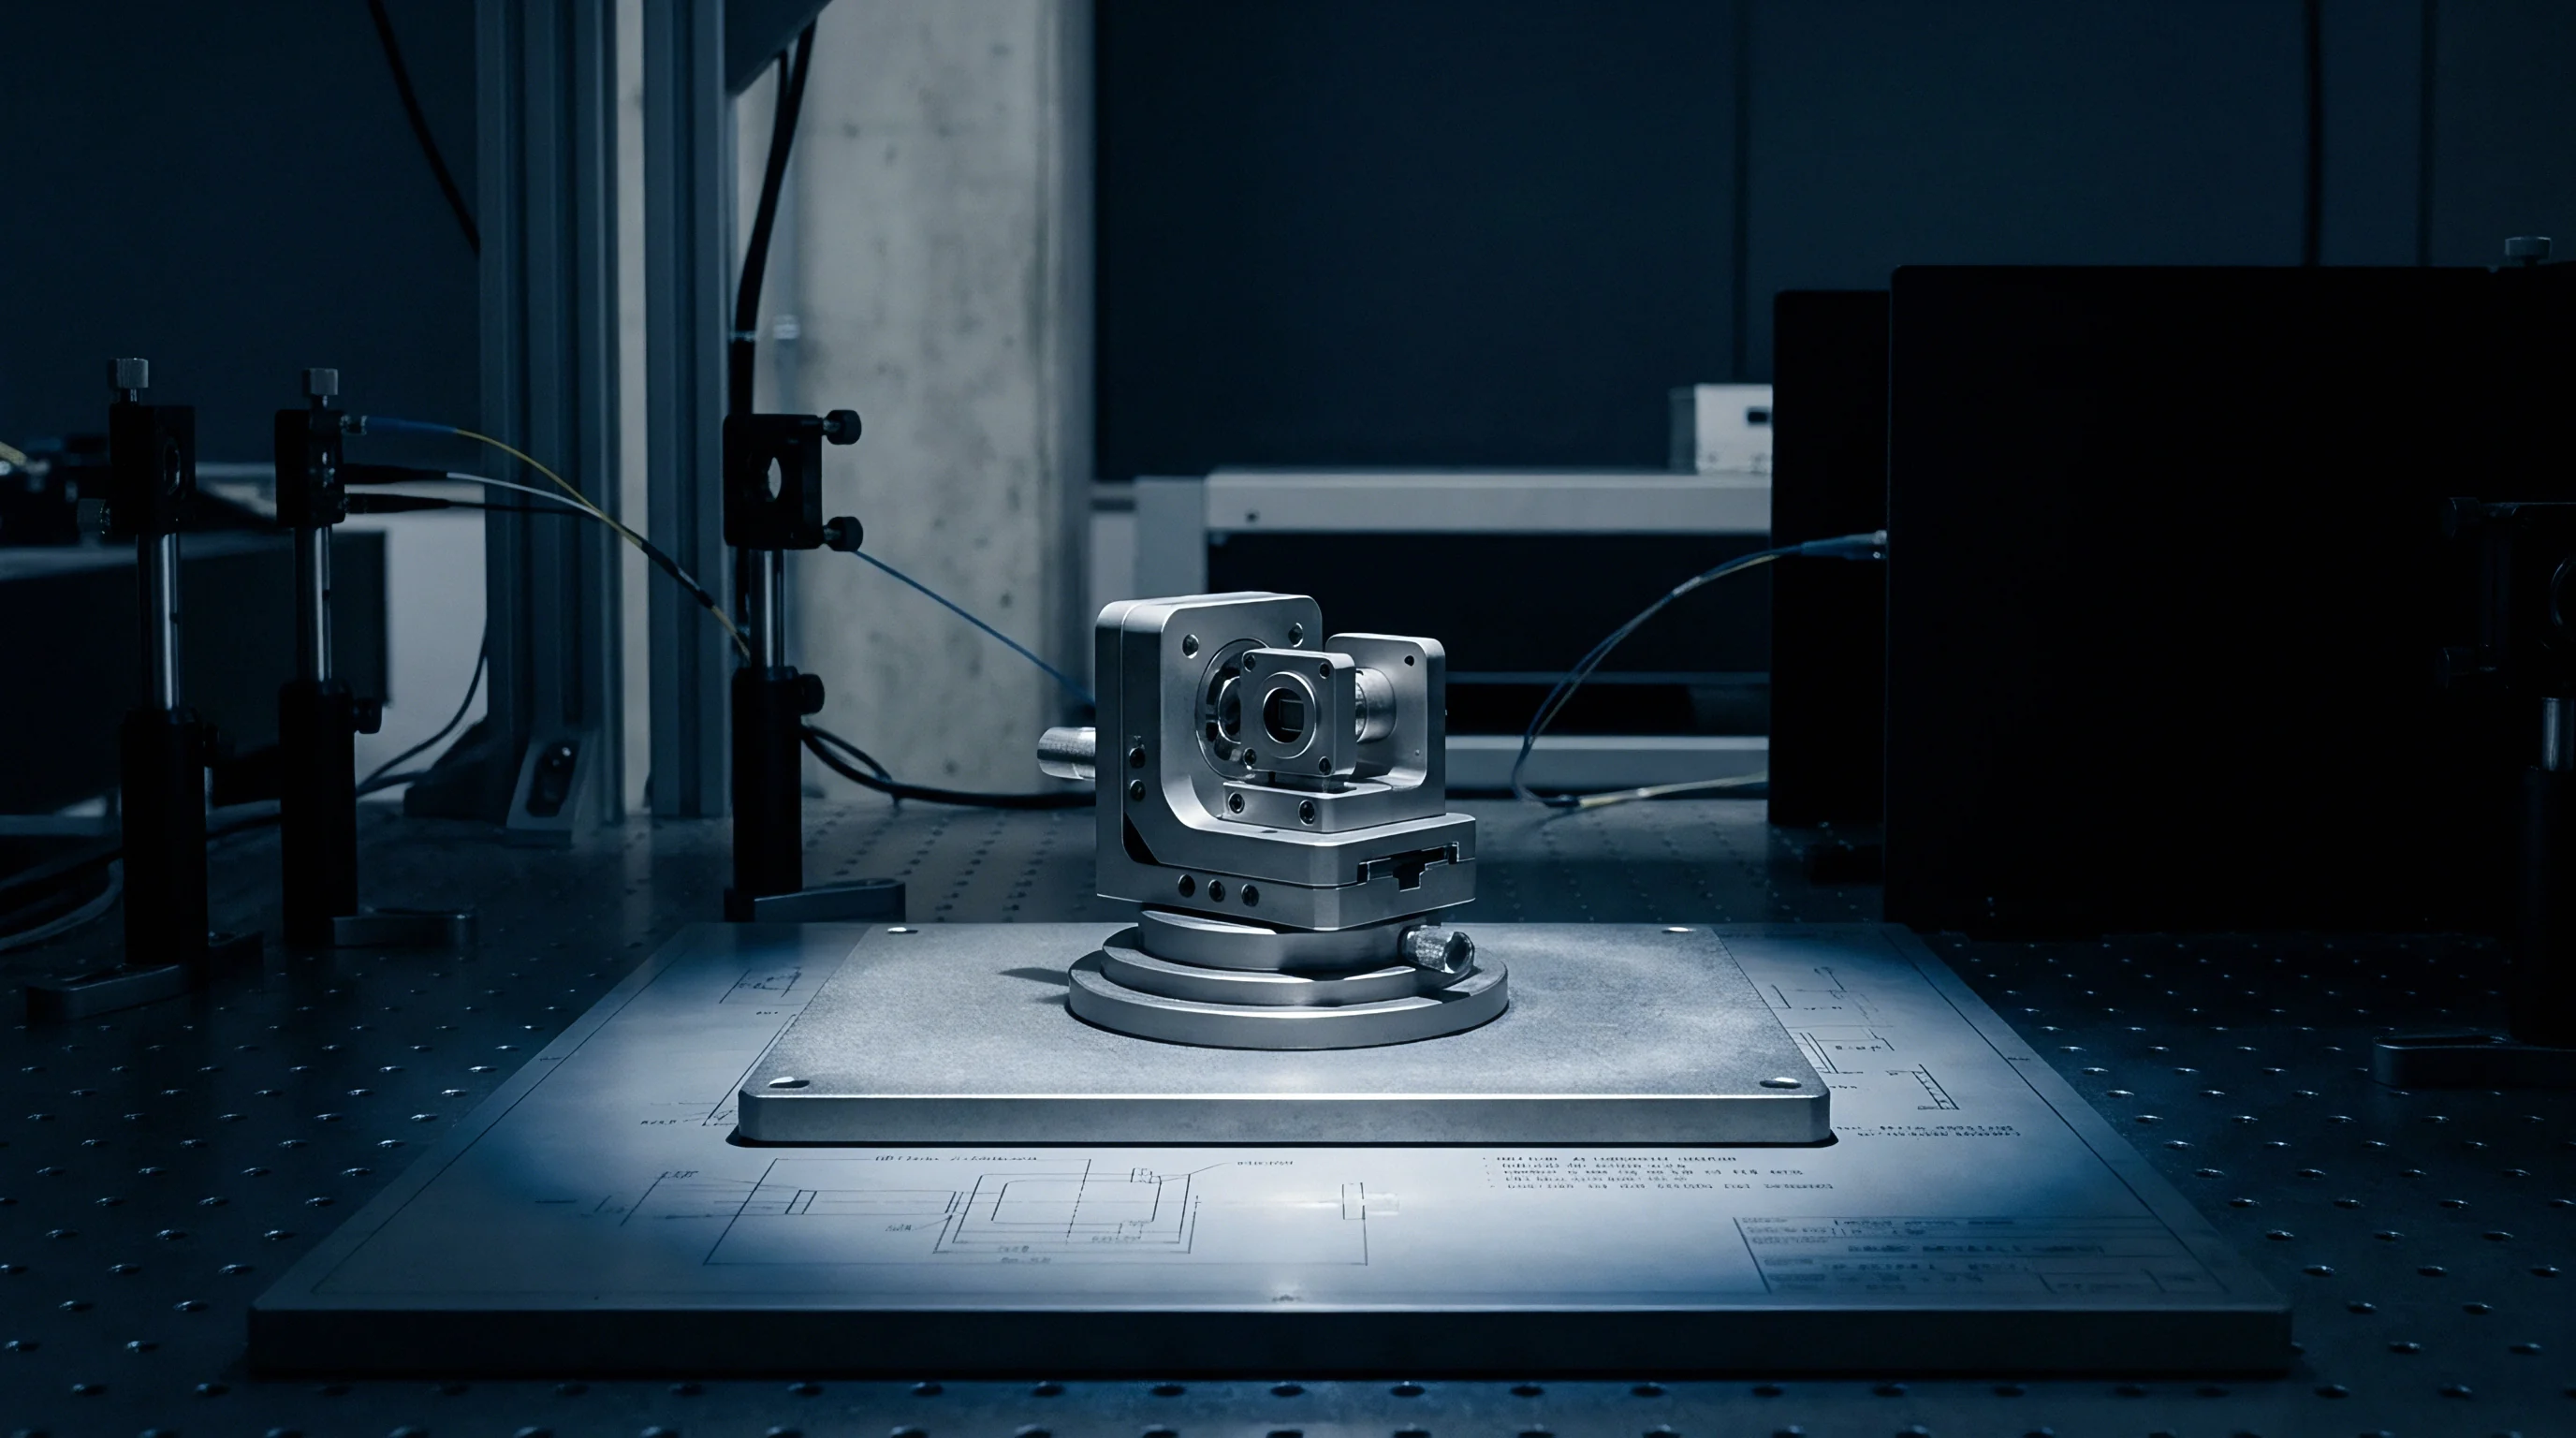
Reference planes must match micro-g precision targets. A standard Grade AA granite plate maintains flatness within 1.0 to 2.5 micrometers over a one-meter span. If an adapter fixture has surface burrs, machining irregularities, or particulate contamination, torquing mounting screws introduces mechanical tilt.
A tilt of just 10 arcseconds leaks 48.5 micro-g of gravity into orthogonal horizontal axes, corrupting horizontal offset calculations.
Mechanical Clamping Stress and Socket Design
Pogo-pin production sockets exert 15 to 30 grams of force per pin. On a 16-pin LGA, that totals over 400 grams concentrated across 9 square millimeters of package area. Without a rigid backing plate, this localized force flexes the carrier board, establishing steady-state shear stresses throughout the solder array.
Table 3 evaluates zero offset shifts and repeatability errors induced by various mechanical mounting and clamping mechanisms commonly deployed on calibration benches.
| Mounting Mechanism | Contact Pressure / Torque | Induced Zero Offset Shift | Axis Misalignment Spread | Settling Time Constant |
|---|---|---|---|---|
| Pogo Pin Test Socket (Asymmetric) | 25 g / pin (16 pins) | +8.2 to +14.5 mg | 12 to 35 arcsec | 1.2 seconds |
| Pulsed Vacuum Chuck (Elastomeric Ring) | -80 kPa Differential | +0.4 to +0.9 mg | 3 to 8 arcsec | 0.1 seconds |
| Precision Torque Screw (SAC305 Solder) | 0.15 N-m (M1.6 Screws) | +2.1 to +4.8 mg | 5 to 12 arcsec | 18.0 seconds |
| UV-Curable Structural Adhesive Flat | Zero Dynamic Load | +0.1 to +0.3 mg | 2 to 4 arcsec | 45.0 seconds |
Vacuum chucks avoid localized point loads by securing the package flat with uniform atmospheric pressure. Adding a soft fluoroelastomer seal isolates the die from lateral clamping forces. Sockets relying on rigid mechanical lid clamps frequently show poor insertion-to-insertion repeatability across production batches.
Carrier board fasteners require precise torque control. Uneven torque warps PCB laminate: tightening one M1.6 screw to 0.25 N-m while leaving another at 0.10 N-m produces over 6 milli-g of differential zero-offset shift between X and Y axes. Calibrated torque drivers and progressive cross-pattern tightening balance mounting strain.
Granite Flatness and Optical Alignment
Verifying reference plane level requires electronic tiltmeters or dual-axis autocollimators. Precision calibration stations float the granite plate on pneumatic air isolators with leveling valves maintaining horizontal alignment within 0.5 arcseconds, compensating for mass shifts as equipment moves across the surface.
Optical targets mounted on the carrier board allow autocollimators to track true pitch and roll during rotation. If dividing head bearings show more than 5 arcseconds of axial runout or wobble during tumble sequences, the actual gravity vector departs from nominal geometric projections. Optical tracking provides correction vectors that can be subtracted from raw measurements before extracting zero-g bias.
A surface particulate contamination of five micrometers under one edge of a three-millimeter sensor package tilts the sensing axis by 343 arcseconds, generating an artificial offset of 1.66 milli-g.
Thermal expansion mismatches within the fixture can introduce angular tilt. Bolting aluminum brackets (23 ppm/K) directly to steel rotary platters (11 ppm/K) creates bimetallic bending. A 2-degree Celsius change in room temperature can tilt a bracket by several arcseconds, corrupting long-term offset tests.
Fixtures built for thermal sweeps should use low-expansion alloys like Invar-36 or Super Invar.
Cleanliness around the fixture is equally vital. A single five-micrometer dust particle trapped under one edge of a 3 mm package tilts the die by 343 arcseconds, introducing over 1.6 milli-g of gravitational error into uncalibrated readings.
ASTM E251 mounting practices for strain gauges apply directly here: package stress relaxation over time causes uncalibrated zero offsets to drift continuously after mechanical clamping.

Economics
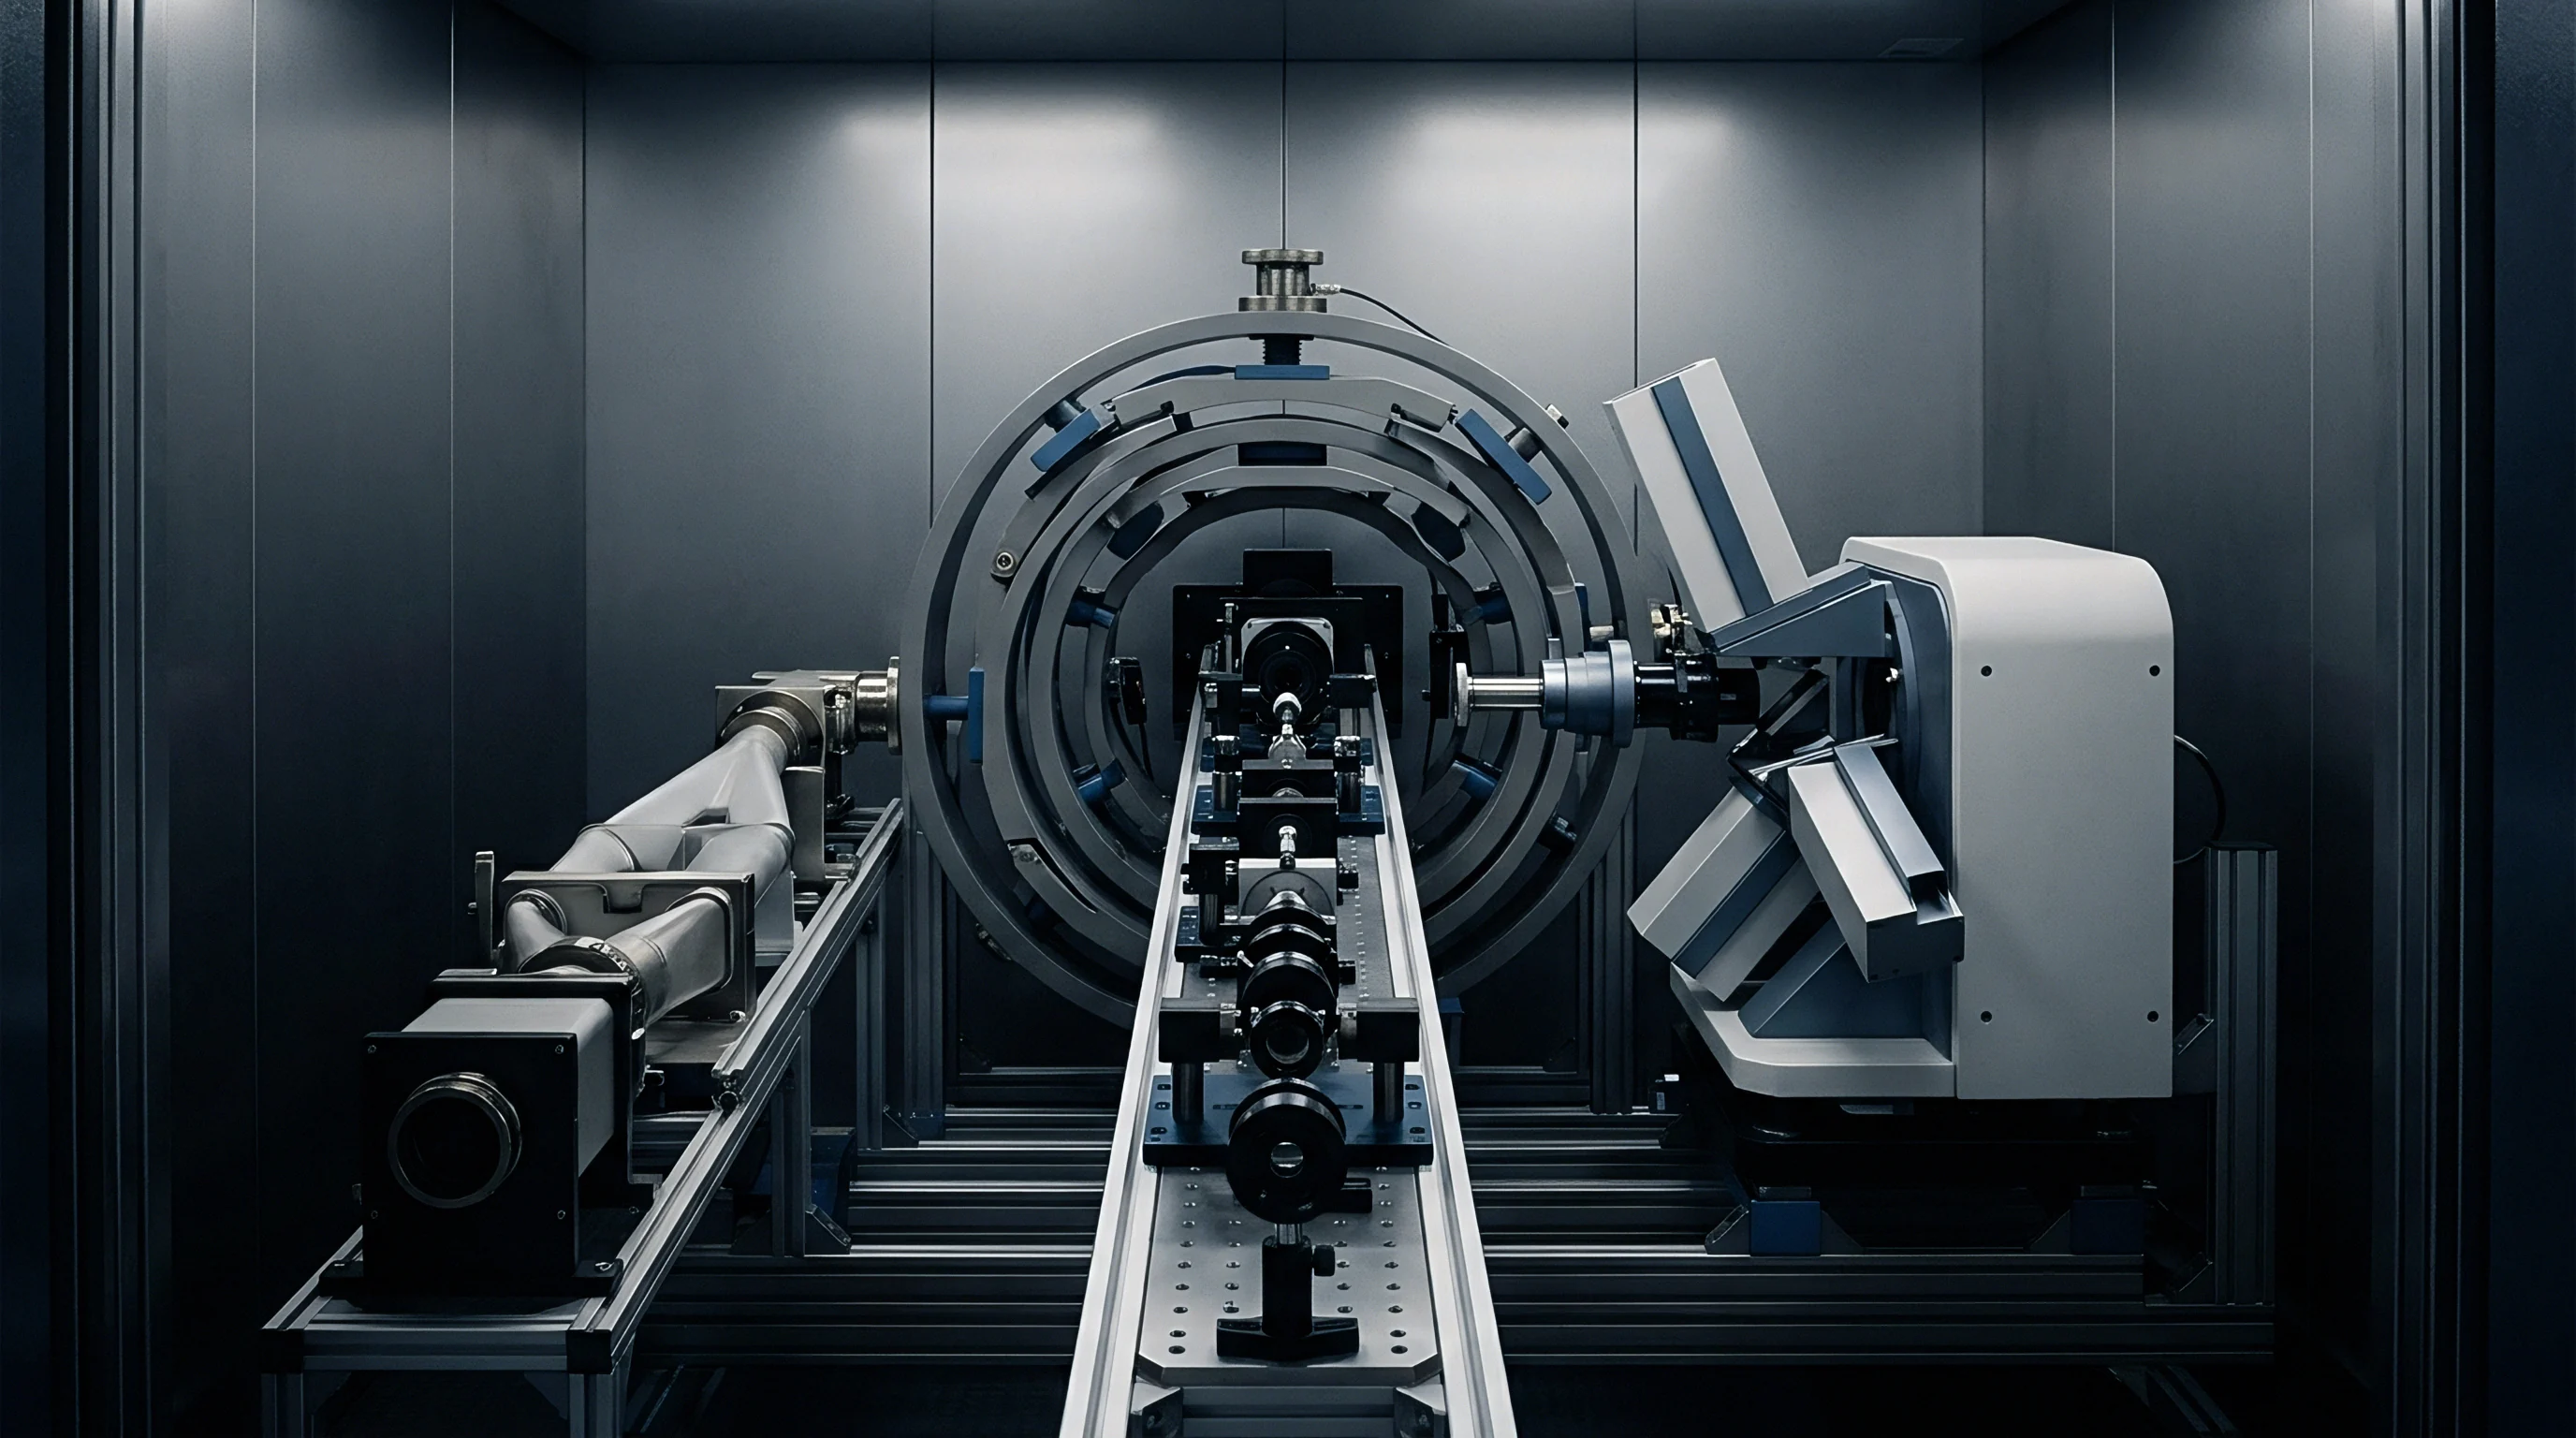
High-volume calibration throughput involves a direct trade-off between test duration and residual offset uncertainty. Tighter zero-g bias tolerances require longer socket dwells and costlier test hardware. A consumer sensor with a +/- 40 milli-g specification can be verified using a 300 ms two-point tumble on a high-speed gravity handler.
An industrial unit rated for +/- 3 milli-g over temperature requires a full six-position tumble inside an automated multi-site thermal chamber, extending test time beyond three minutes per unit.
This dwell-time gap separates the MEMS market into clear price tiers. Turret handlers process consumer components at over 15,000 units per hour using parallel vacuum chucks, trimming room-temperature bias via OTP eFuses without thermal cycling. Industrial sensors, tested across temperature in strip carriers, run below 500 units per hour and raise test costs from cents to several dollars per unit.
Yield Tradeoffs and Factory Trim Coding
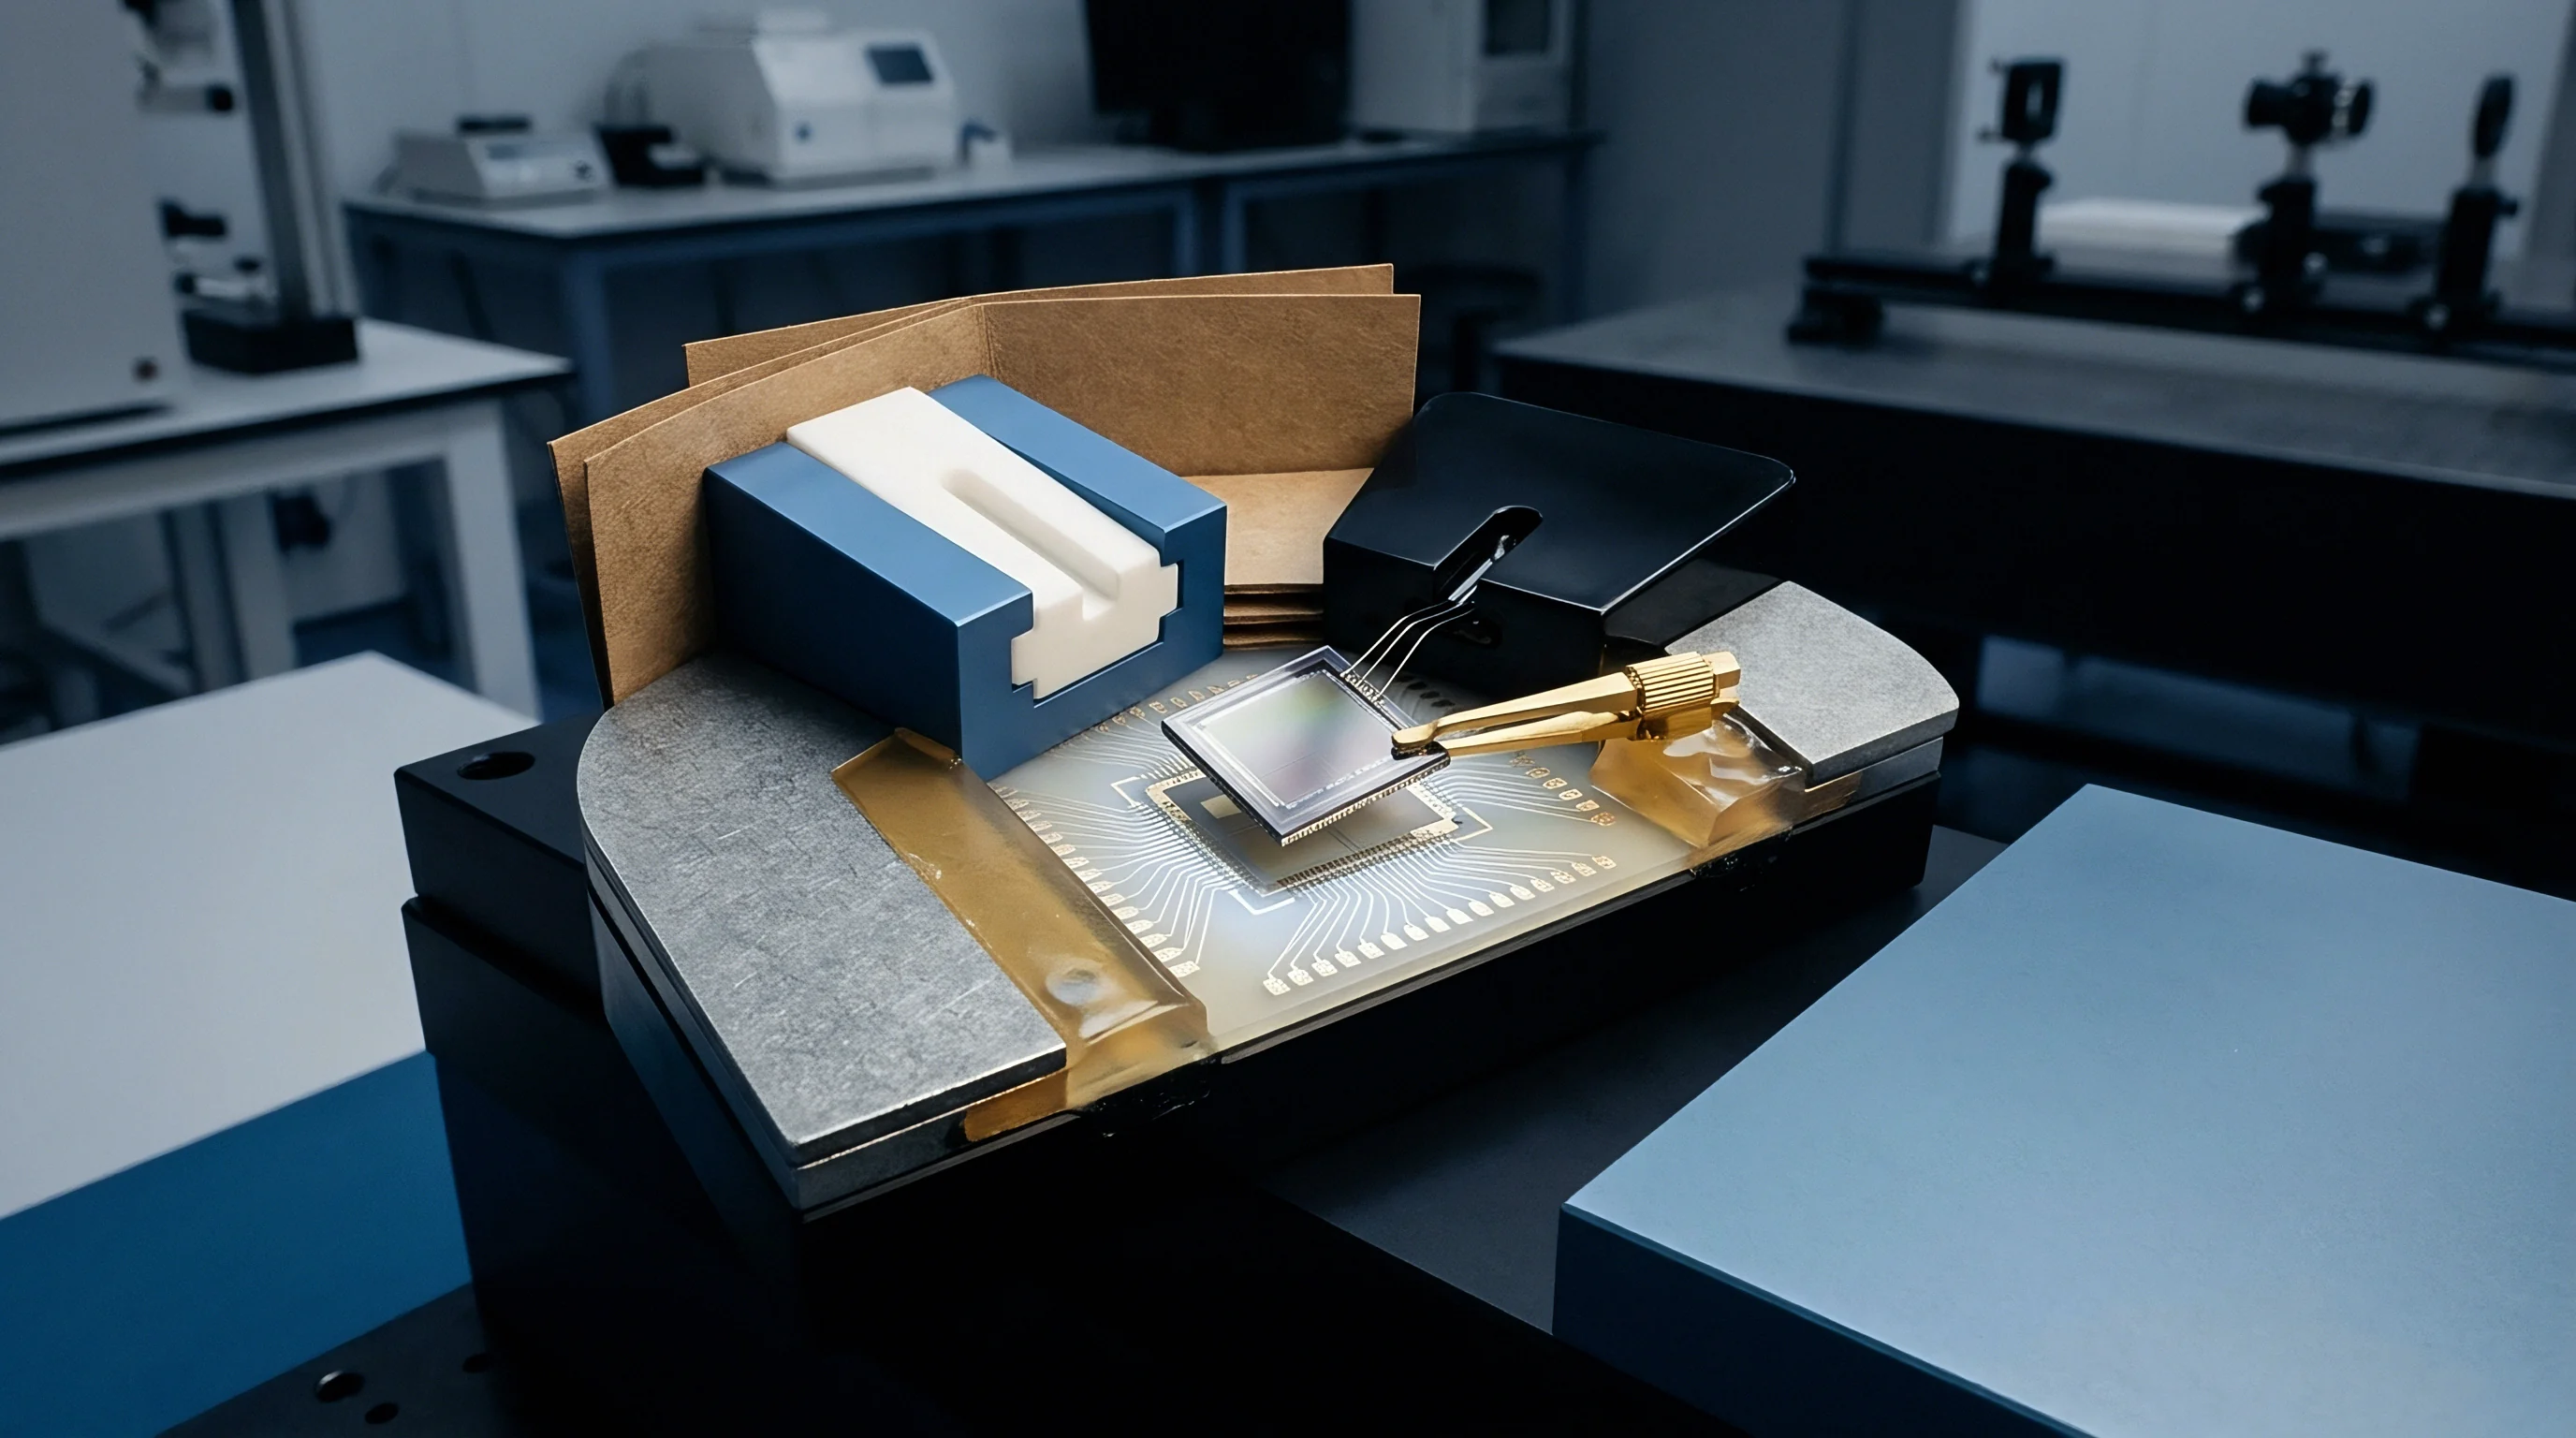
ASIC trim networks rely on digital-to-analog converters to feed compensation currents into the capacitive front end. The resolution of this trim DAC sets the quantization limit for zero-offset adjustment. A 6-bit DAC covering a +/- 50 milli-g distribution provides a step size of roughly 1.56 milli-g per LSB.
Reaching sub-milli-g residuals requires a 10-bit or 12-bit DAC, which takes up more silicon area and increases search time during automated testing.
Table 4 provides an economic and operational comparison of calibration methodologies, associated manufacturing cost premiums, and typical factory throughputs across industry supply tiers.
| Calibration Strategy | Total Socket Dwell Time | Factory Cost Impact per Unit | Throughput (Units per Hour) | Residual Zero Offset Band |
|---|---|---|---|---|
| Single-Orientation Fast Trim | 150 to 300 ms | $0.01 to $0.03 | 12,000 to 18,000 | +/- 40 to 60 mg |
| Six-Position Ambient Tumble | 2.5 to 5.0 s | $0.08 to $0.15 | 2,000 to 3,500 | +/- 10 to 15 mg |
| Six-Position Multi-Temp Sweep | 180 to 360 s | $1.80 to $4.50 | 150 to 400 | +/- 2 to 5 mg |
| Full 24-Position Inertial Grade | 600 to 1200 s | $15.00 to $35.00 | 10 to 30 | +/- 0.1 to 0.5 mg |
Specifying overly narrow uncalibrated offset limits penalizes wafer yield. Silicon wafers exhibit radial stress gradients from CVD film shrinkage and CMP non-uniformity, meaning die near the wafer perimeter carry larger baseline offsets. Enforcing a strict 10 milli-g cutoff on uncalibrated parts forces suppliers to discard edge die, dropping gross wafer yield from 92 percent to 74 percent and raising component unit costs.
Second-Sourcing and Post-Assembly Calibration
Board assembly often alters high-accuracy factory calibration. Solder reflow thermal shock shifts zero-offset baselines by 5 to 20 milli-g, counteracting expensive factory multi-temperature trims. For high-volume manufacturing, a practical alternative is purchasing a loosely trimmed component and calibrating after full board assembly.
Executing a static two- or six-position tumble on the populated PCB assembly captures post-reflow mechanical stress, board flexure, and connector loading in a single step. The end-of-line station measures the assembled board across gravity orientations, calculates updated bias parameters, and writes them to host microcontroller non-volatile memory. This bypasses the price premium for pre-calibrated silicon while improving final system accuracy.
When qualifying alternate sensor sources, verify register map compatibility for zero-offset trim values. One vendor may use two’s complement registers scaled at 0.5 milli-g per bit, while a pin-compatible alternate uses sign-magnitude encoding at 1.22 milli-g per bit. If firmware fails to account for these differences, automated calibration routines write incorrect trim coefficients and cause downstream test failures.
Datasheet offset specifications should also be reviewed to confirm whether they reflect post-reflow performance across temperature or simply room-temperature bare-package test results.