Piezoresistive Pressure Transducer Thermal Zero Drift Calibration Methods
Thermal zero drift calibration of piezoresistive pressure transducers requires precise thermal soak equilibrium, bridge resistance thermometrics, and low-order polynomial matrix surface fitting to achieve residual zero offset errors below 0.05 percent of full-scale output across broad operating temperatures.
Strain
Physics of Semiconductor Piezoresistive Thermal Offset
Pressure transducers built on silicon piezoresistive diaphragms rely on four strain-sensitive resistors arranged in a Wheatstone bridge configuration. Applied mechanical pressure deflects the membrane, inducing longitudinal and transverse stress in the doped silicon regions. Piezoresistive coefficients map these mechanical stress states directly to local electrical resistivity changes.
Heat alters this relationship by changing fundamental carrier concentration and mobility inside the bulk semiconductor material. Doped monocrystalline silicon displays a positive temperature coefficient of resistance alongside a negative temperature coefficient of piezoresistive sensitivity. When thermal energy raises the junction temperature, charge carriers scatter across the crystal lattice more frequently.
This mobility drop alters the baseline resistance of all four bridge arms simultaneously, shifting the uncompensated output voltage at zero applied pressure.
Zero drift originates from small physical imbalances across the bridge arms, stemming from dopant density gradients during ion implantation, geometric photolithography variations, or localized residual stresses left by die-attach adhesives and anodic glass bonding. If all four piezoresistors possessed identical resistance values and identical temperature coefficients across the target thermal operating range, the differential output voltage across the Wheatstone bridge would remain zero millivolts regardless of temperature. Manufacturing tolerances make perfect symmetry impossible.
A resistance mismatch as small as 0.01 percent between adjacent bridge arms produces a noticeable drift in the zero-pressure output signal when the operating environment sweeps from sub-zero conditions to elevated temperatures. The temperature coefficient of offset describes this thermal zero shift, expressed as a percentage of full-scale output per degree Celsius or Kelvin.
Mechanical strain introduces another severe layer of zero drift. Piezoresistive silicon chips bond to support headers made of Pyrex glass, Kovar, or stainless steel alloys, each maintaining a distinct coefficient of thermal expansion. Temperature excursions create differential thermal expansion between the silicon diaphragm and the underlying substrate, sending structural shear forces through the die-attach layer into the active sensor region.
The piezoresistive bridge reads this packaging-induced strain as physical pressure. Thermal zero drift measured on an unpackaged silicon die differs drastically from the thermal zero drift observed once that same die sits inside a welded housing filled with silicone oil and sealed behind an isolation diaphragm. Thermal calibration routines evaluate the fully packaged device to account for these mechanical package interactions.
At a constant reference pressure of zero absolute, silicon piezoresistive Wheatstone bridges exhibit non-passivated offset shifts up to 0.12 percent of full-scale output per ten-degree shift.
Piezoresistive Coefficients and Junction Thermometrics
Piezoresistance in p-type silicon depends heavily on hole concentration within the heavy and light hole valence bands. As temperature rises, thermal generation of intrinsic carriers distorts the engineered doping profiles of p-type resistors diffused into an n-type substrate. The piezoresistive coefficients decrease non-linearly with increasing temperature, causing sensor sensitivity to drop while baseline resistivity increases.
This dual drift behavior requires precise separation during calibration. Thermal zero drift represents voltage shifts occurring at zero applied pressure differential, while thermal span drift represents changes in the sensitivity scale factor under applied load. Calibrating zero drift isolation demands maintaining zero applied pressure across the complete thermal cycle while recording output signals.
Internal junction temperature serves as the true independent variable during calibration, given that external housing temperature measurements lag behind actual silicon junction temperatures during thermal transients. Utilizing the Wheatstone bridge total input resistance as an integrated temperature sensor provides high precision thermometrics. Because bulk silicon resistance increases predictably with temperature, measuring the total current drawn under constant voltage excitation yields the actual junction temperature of the sensing elements without introducing thermal lag errors.
Monitoring bridge excitation current during thermal sweeps maps baseline offset against exact internal silicon temperatures, avoiding the spatial gradient errors introduced by external surface thermocouples.
Higher-order thermal effects compound piezoresistive drift at environmental extremes. Below minus forty degrees Celsius, carrier freeze-out alters the conductivity profile of low-dopant silicon structures, introducing non-linear zero shifts. Above one hundred twenty degrees Celsius, intrinsic carrier generation begins overwhelming substrate doping, altering leakage currents through p-n isolation junctions.
Isolation leakage currents divert excitation current around the active bridge arms, creating apparent zero shifts that do not follow standard polynomial models. High-accuracy calibration protocols identify these non-linear boundaries before attempting mathematical model fitting.
Unresolved structural changes inside the silicon-die attachment interface remain a persistent cause of unrepeatable zero drift across repeated thermal cycles.


Soak

Thermal Profile Design and Chamber Equilibrium
Data acquisition during thermal zero calibration demands total thermal equilibrium across the test sample population. Environmental test chambers utilize forced-convection air currents or fluid baths to cycle transducers across target operating bands. Step-change thermal profiles hold transducers at discrete temperature plateaus until sensor readings satisfy equilibrium criteria.
A temperature change rate below 0.05 degrees Celsius per minute across a ten-minute window generally confirms acceptable thermal stability for industrial transducers. Rapid thermal profiling introduces transient thermal stress across the transducer body, generating transient offset voltages that disguise the true static thermal zero characteristic. Test execution relies on settling times matched to sensor thermal mass, housing geometry, and internal fill-fluid volume.
Continuous thermal ramping presents an alternative to stepped temperature plateaus. Slow ramp rates between 0.1 and 0.5 degrees Celsius per minute allow continuous data collection across the entire temperature spectrum, capturing localized non-linearities missed by widely spaced temperature steps. Continuous profiling requires verification that internal silicon junction temperatures do not lag behind chamber temperature readings.
Comparing continuous ramp data collected during heating cycles against continuous ramp data collected during cooling cycles exposes dynamic lag. The average of rising and falling ramp curves isolates static thermal zero drift, provided the thermal lag remains symmetrical across the cycle rate.
Pressure controls must maintain strict zero differential pressure throughout the thermal test sequence. Open-to-atmosphere gauge pressure sensors remain vulnerable to barometric pressure fluctuations caused by weather shifts during long thermal soak runs. Atmospheric pressure shifts during an eight-hour thermal calibration cycle mimic thermal zero drift, corrupting calibration parameters.
Absolute pressure transducers require evacuating calibration manifolds to high vacuum levels below 0.1 Pascal to ensure true zero absolute pressure during thermal steps. Differential transducers need equalized manifold pressures across both port connections throughout chamber temperature transitions.
Failure modes originating from incorrect thermal soak execution compromise mathematical compensation models:
- Spatial Gradient Errors occur when transducers positioned at chamber outer edges experience different temperatures than control reference sensors, generating unrecorded offset shifts.
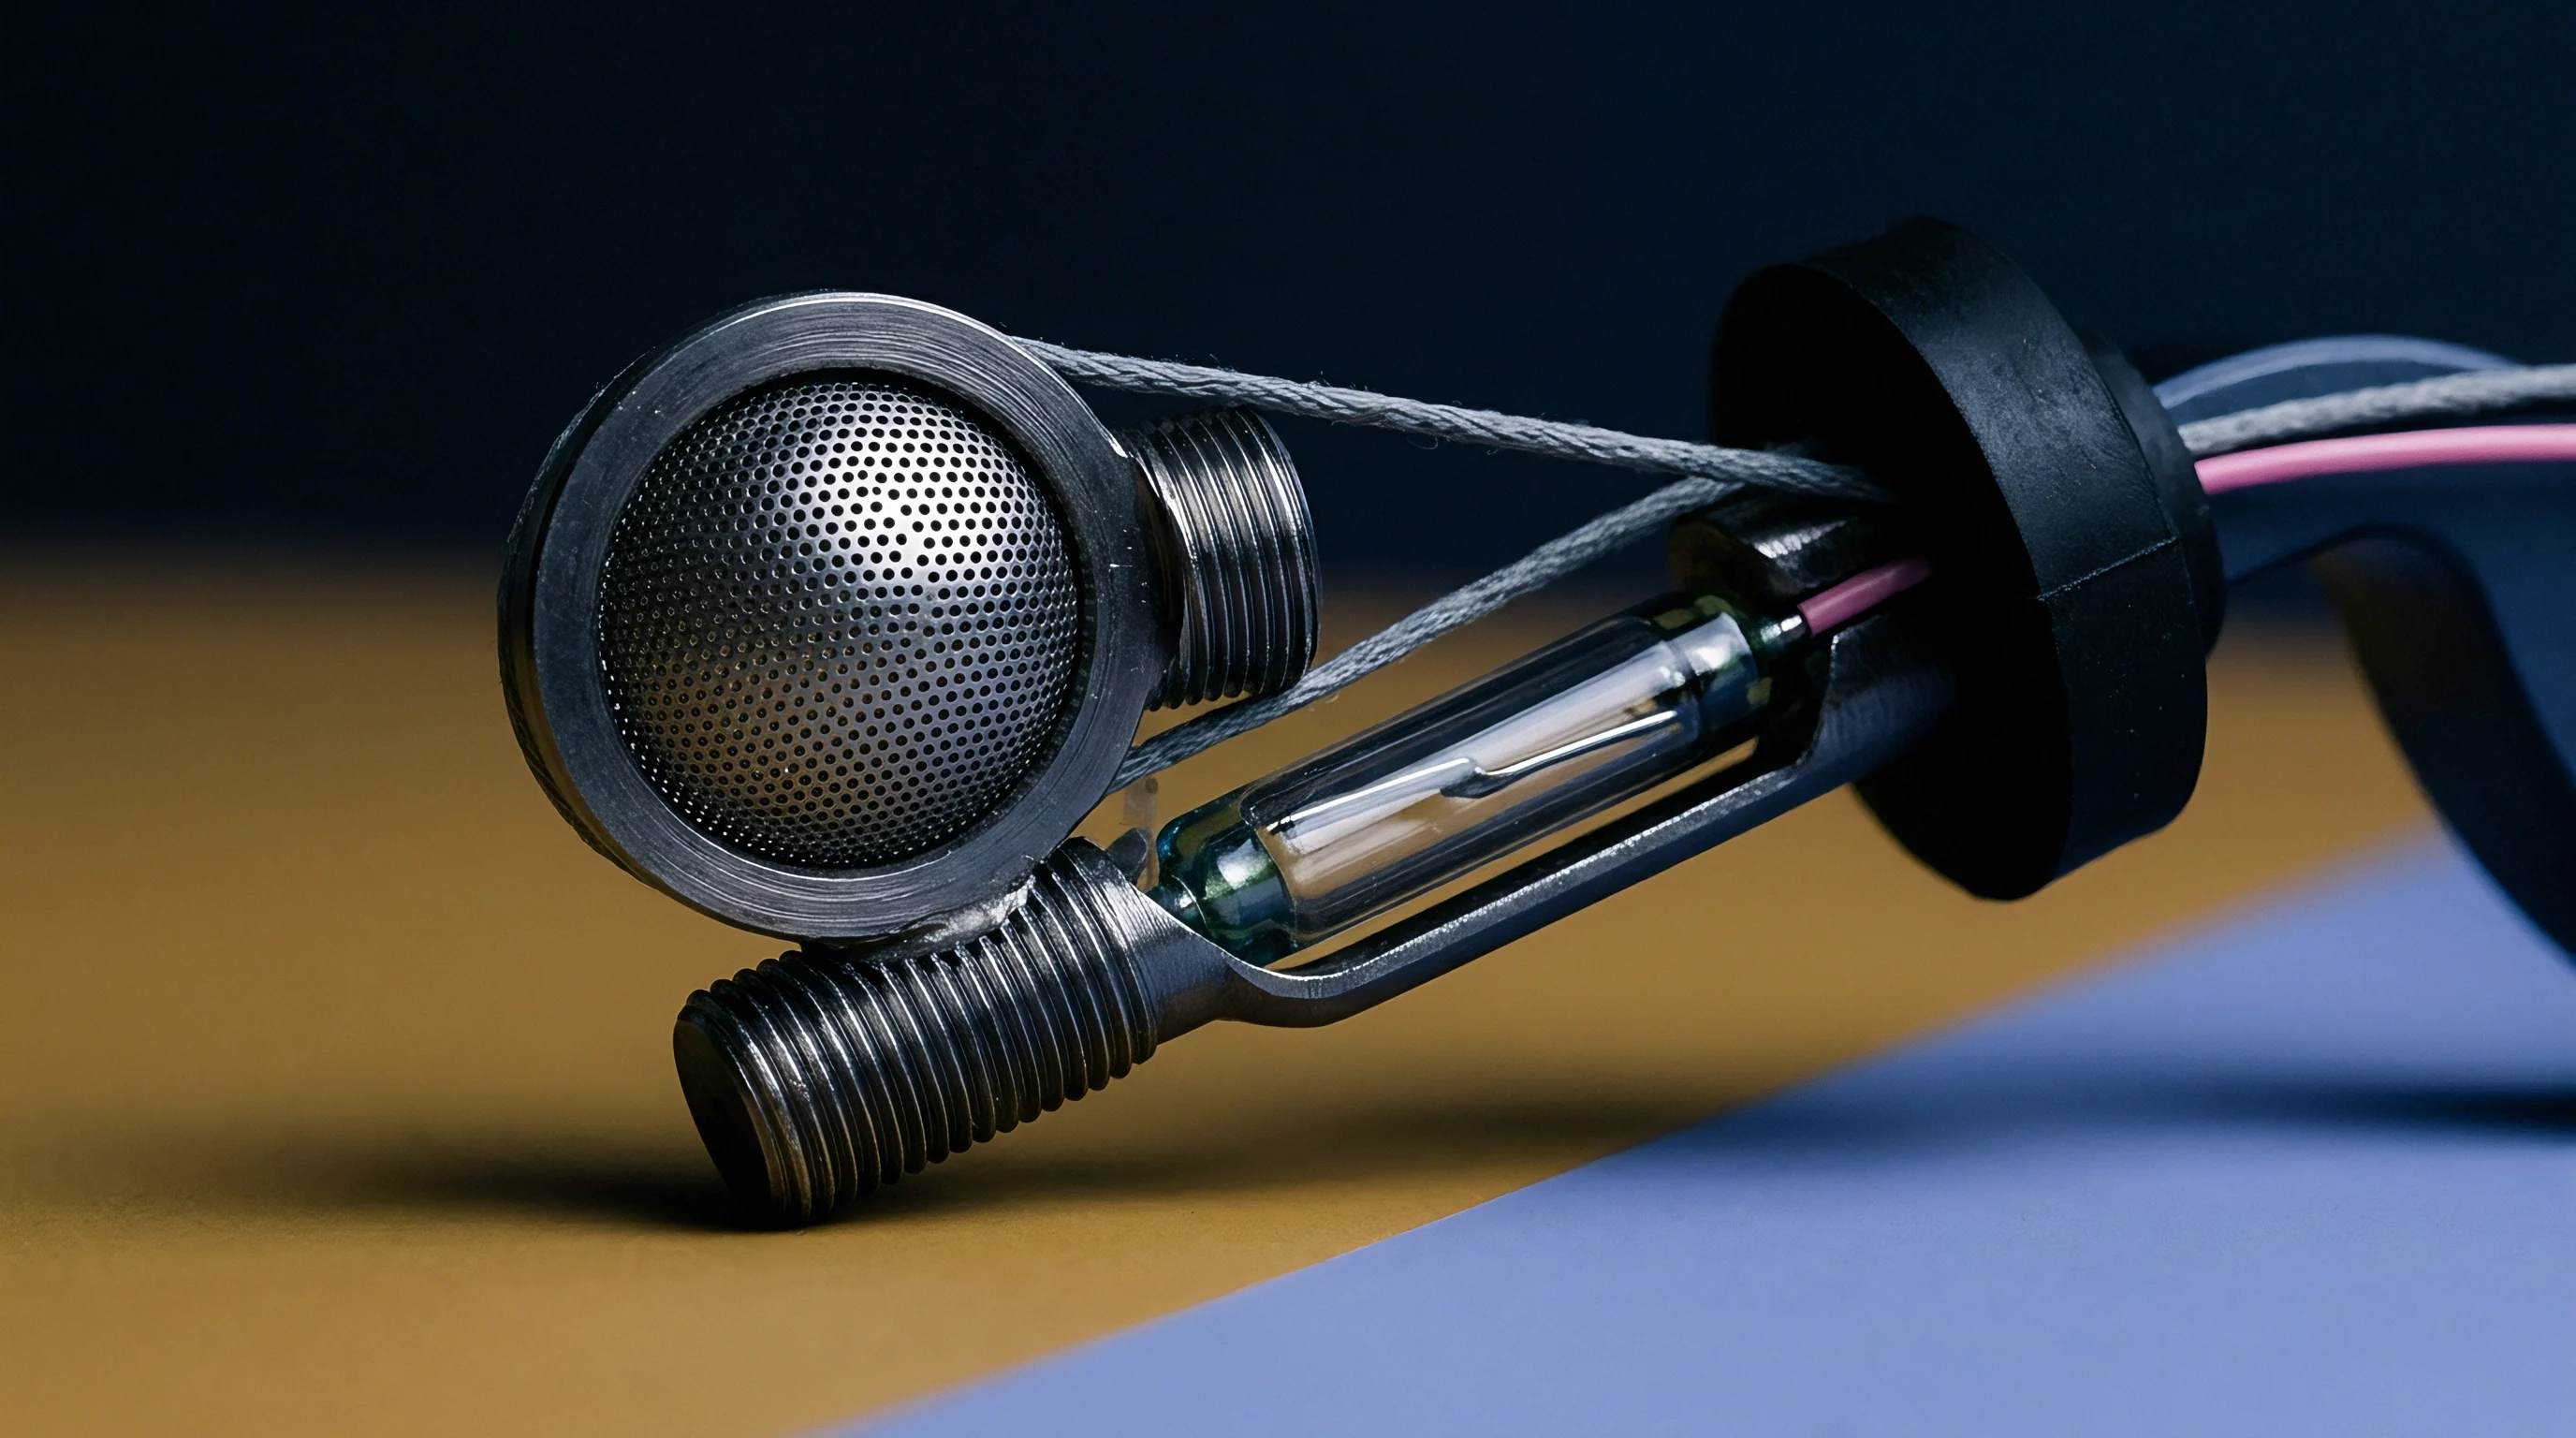
- Fluid Transient Strain appears in oil-filled isolated transducers when thermal expansion of internal silicone oil creates temporary hydraulic pressures against thin metal diaphragms before internal volume expansion completes.
- Moisture Condensation Condenser Effects develop when cold test steps allow atmospheric moisture to condense across exposed pin headers, forming micro-leakage resistance paths across Wheatstone bridge terminals.
- Terminal Housing Creep manifests when elastomeric seals or potting compounds relax under elevated temperature steps, altering mechanical loads transferred to the internal sensor cell.
Hysteresis Loop Separation and Cycle Conditioning
Thermal zero hysteresis describes the residual difference in zero-pressure output measured at a specific temperature when approached from a higher temperature versus a lower temperature. Piezoresistive transducers exhibit hysteresis due to viscoelastic stress relaxation within polymer packaging adhesives, metallic housing creep, and crystal defect movement inside the silicon lattice. Distinguishing pure thermal zero drift from thermal hysteresis requires multi-cycle testing sequences.
The initial thermal cycle on a freshly manufactured transducer typically exhibits large, unrepeatable zero shifts as residual manufacturing stresses relax. Pre-conditioning transducers through three complete burn-in thermal cycles prior to recording calibration data eliminates this initial stress-relief artifact.
Data collection protocols schedule measurement points along both ascending and descending thermal branches. Evaluating hysteresis magnitude across the operating band identifies whether a transducer qualifies for simple polynomial compensation. When thermal hysteresis exceeds twenty percent of total allowable zero drift, deterministic single-variable temperature compensation models fail to maintain output accuracy specifications across reverse thermal sweeps.
High-reliability applications demand selecting packaging architectures with low thermal hysteresis before investing in high-order digital calibration compensation routines.
Uncompensated low-temperature zero shifts often stem from external harness stresses rather than internal silicon-to-glass bond degradation.

Matrix

Mathematical Drift Modeling and Surface Fitting
Correcting thermal zero drift requires generating a precise mathematical model that maps raw bridge output voltages and internal junction temperature measurements to corrected zero-pressure values. Bivariate polynomial models represent the standard approach for digital compensation networks. Baseline offset voltage V0(T) at zero applied pressure is expressed as a power series expansion of temperature T relative to a reference room temperature Tref:
V0(T) = a0 + a1(T – Tref) + a2(T – Tref)2 + a3(T – Tref)3 + dots + an(T – Tref)n
Polynomial coefficients a0, a1, a2, dots, an are solved using ordinary least-squares regression applied to calibration matrix data. A second-order polynomial handles standard silicon transducers across moderate thermal spans from minus ten to seventy degrees Celsius. Extreme environment sensors operating from minus fifty-five to one hundred fifty degrees Celsius demand third-order or fourth-order polynomials to model non-linear carrier concentration shifts and mechanical expansion mismatches accurately.
| Compensation Algorithm | Calibration Points | Residual Offset (%FSO) | Computational Load | Memory Footprint | Hysteresis Handling |
|---|---|---|---|---|---|
| Linear TCR Coefficient | 2 Temperature Points | ±0.50 % | Extremely Low | 8 Bytes | Uncorrected |
| 2nd Order Polynomial | 3 Temperature Points | ±0.10 % | Low | 16 Bytes | Uncorrected |
| 3rd Order Surface Fit | 5 Temperature Points | ±0.02 % | Moderate | 32 Bytes | Uncorrected |
| 2D Bivariate Spline | 9 Temperature Points | ±0.01 % | High | 128 Bytes | Averaged |
| Interpolated Direct LUT | 16 Temperature Points | ±0.005 % | Low (Hardware Read) | 256-1024 Bytes | Uncorrected |
Surface fitting algorithms expand zero correction by simultaneously modeling thermal zero drift and thermal span sensitivity drift within a single matrix system. Pressure calculation output P(V, T) converts raw bridge voltage V and junction temperature sensor reading T into standardized pressure values through a two-dimensional matrix equation:
P(V, T) = sumi=0N sumj=0M Cij · Vi · Tj
Matrix coefficients Cij are calculated by inversion of the design matrix generated from calibration testing across combined pressure and temperature test grids. Matrix calibration routines use multi-variable singular value decomposition to prevent ill-conditioned coefficient matrices when processing non-linearly spaced test points. Singular value decomposition isolates linear dependencies between higher-order polynomial terms, ensuring numeric stability when executing math routines on embedded microcontrollers with floating-point limits.
Look-up tables with linear interpolation present a direct alternative to continuous polynomial evaluation. Direct look-up tables store discrete baseline zero correction values at fixed temperature intervals within non-volatile transducer memory. During operation, the signal processor reads current silicon temperature, identifies adjacent lookup table temperature nodes, and performs linear interpolation to determine the instantaneous offset correction value.
Look-up tables eliminate processing overhead associated with computing cubic or quartic power series on low-power sensor microcontrollers. Table spacing must be set tight enough across non-linear regions to prevent interpolation step errors from exceeding the target residual accuracy threshold.
Higher-order polynomial surfaces fit sensor thermal zero data tightly across calibration points while oscillating unpredictable errors between measured temperatures.

Where Does Over-Fitting Introduce Residual Calibration Errors?
Increasing polynomial order to minimize residual errors at discrete calibration points frequently degrades overall compensation accuracy across intervening unmeasured temperatures. High-order polynomials suffer from Runge phenomenon, producing wild oscillations between target temperature test steps. A fifth-order polynomial forced through six calibration points yields zero residual error at those exact six temperatures, yet creates severe offset errors at intermediate points.
Calibration protocol design requires validating residual fit error across intermediate evaluation temperatures not utilized during coefficient matrix calculation.
Piecewise cubic spline interpolation avoids Runge oscillation by fitting low-order cubic equations between adjacent temperature nodes while enforcing continuous first and second derivatives across node boundaries. Piecewise splines require increased memory storage for individual sub-domain coefficients, but maintain tight residual error bands across wide temperature ranges. Spline compensation proves essential for isolated piezoresistive transducers exhibiting abrupt material phase changes or internal mechanical stress transitions near fluid freeze points.
Fitting calibration math models to unconditioned zero drift data that includes uncorrected hysteresis results in significant residual offset errors during thermal cycling.
Trim
Passive Circuit Network Compensation
Hardware trimming adjusts piezoresistive bridge performance directly by integrating precision thin-film resistor networks onto the sensor ceramic substrate or carrier board. Passive zero-drift compensation places nickel-chromium or tantalum-nitride thin-film resistors in series or parallel with specific arms of the Wheatstone bridge. Because p-type silicon piezoresistors possess a positive temperature coefficient of resistance, adding a thin-film resistor with a lower or near-zero temperature coefficient alters the effective combined temperature coefficient of the modified bridge arm.
Selecting laser trim resistor values requires measuring raw bridge zero offset Vzero and bridge input resistance Rin at room temperature T1 and elevated operating temperature T2. The required series compensation resistance Rs added to a targeted bridge arm balances baseline offset changes across temperature sweeps according to established network equations:
Rs ≈ fracVzero(T2) – Vzero(T1)Iex · αbridge · (T2 – T1)
Parameter Iex represents bridge excitation current, and αbridge represents the temperature coefficient of bridge resistance. Automated production laser systems trim thin-film resistors by cutting kerf paths into resistive film blocks while monitoring real-time bridge output inside temperature-controlled calibration chambers. Laser trimming corrects primary linear zero drift directly at the analog sensor level, delivering compensated analog voltage outputs without requiring onboard digital microcontrollers.
Passive hardware compensation maintains absolute signal bandwidth limits, introducing zero digital sampling latency or quantization noise into the measurement path. Passive networks remain limited to correcting linear zero drift components. Non-linear zero shifts, higher-order silicon thermal effects, and thermal packaging hysteresis cannot be neutralized using passive resistor networks alone, leaving residual offset errors around 0.25 to 0.50 percent of full-scale output across broad operating bands.

Active ASIC Compensation and Digital Trim Arrays
Modern high-precision piezoresistive transducers incorporate custom Application-Specific Integrated Circuits mounted adjacent to the silicon sensor element. Signal conditioning ASICs combine low-noise instrumentation amplifiers, temperature-sensing diodes or digital sensors, digital-to-analog converters, and non-volatile EEPROM arrays within a single package. Active thermal zero calibration applies offset correction voltage directly into the analog amplifier gain stage via a digital-to-analog converter driven by calibrated compensation registers.
ASIC calibration sequences cycle transducers through automated thermal chambers while communicating via single-wire or I2C serial buses. The external calibration system monitors raw uncompensated sensor outputs and internal junction temperatures across the target temperature profile. Automated software computes optimal digital trim parameters, writing correction coefficients directly into non-volatile ASIC memory cells.
During field operation, internal ASIC logic measures silicon temperature continuously, computes the required zero-offset correction term, and adjusts internal DAC registers in real time to cancel thermal zero drift before final signal output stage amplification.
Selecting hardware-level passive trimming versus active ASIC digital compensation depends on application-specific operating constraints:
- Bandwidth Requirements dictate selecting passive thin-film trimming when signal response speeds above one hundred kilohertz are needed without digital sampling delays.
- Residual Drift Limits require choosing active digital ASIC compensation when broad thermal ranges demand residual zero offset figures below 0.05 percent of full-scale output.
- Operating Temperature Ceiling favors passive ceramic substrate trimming when operating environments exceed one hundred fifty degrees Celsius, past the reliable functional limits of integrated silicon ASICs.
- Physical Form Factor drives integration of digital ASIC architectures when multi-component passive trim boards exceed small sensor housing space boundaries.
Passive thin-film trim networks perform reliably when zero drift mechanisms follow pure linear paths across constrained operating bands.

Error
Uncertainty Budgets for Thermal Zero Drift Calibration
Quantifying calibration capability requires evaluating every error contribution introduced during thermal zero drift test execution. Uncertainty evaluation follows ISO/IEC Guide 98-3 guidelines, combining individual standard uncertainties into an expanded calibration uncertainty budget. Reference pressure measurement uncertainty during zero calibration must remain negligibly small compared to target sensor drift limits.
For absolute pressure zero calibration, vacuum reference gauges must hold calibration traceability to national metrology institutes with combined uncertainties below 0.001 percent of full-scale target ranges.
Chamber thermal non-uniformity represents the dominant environmental uncertainty component. Spatial temperature gradients inside forced-air calibration chambers routinely reach 0.5 degrees Celsius across typical test fixture working volumes. A spatial gradient of 0.5 degrees Celsius introduces significant unmeasured offset uncertainties when target transducers sit at varying distances from reference chamber control thermometers.
Calibrating working chamber volumes with multi-point thermocouple arrays establishes spatial gradient bounds, which enter the calibration uncertainty budget as Type B rectangular distributions.
Data acquisition measurement noise and analog-to-digital converter quantization limits set the electrical uncertainty floor. Measuring bridge outputs with microvolt-level resolution demands precision digital voltmeters featuring high common-mode rejection ratios and integrated auto-zero offset cancellation. Thermal electromotive forces generated across dissimilar metal junctions in test cabling contribute parasitic offset voltages that vary with ambient room temperature.
Reversing excitation voltage polarity or utilizing low-thermal offset switching matrices isolates galvanic thermal electromotive forces from true transducer bridge output signals.
Determining expanded uncertainty Uexp requires combining standard uncertainties through root-sum-of-squares addition and applying a coverage factor k=2 to achieve a coverage probability of approximately 95 percent:
Uexp = k · sqrturefpress2 + uchambergrad2 + usoakstab2 + udacnoise2 + ufitresidual2
Evaluating residual mathematical fit error ufitresidual requires calculating root-mean-square deviations between measured zero outputs and compensation model predicted values across all calibration points. Maintaining a minimum four-to-one test uncertainty ratio between sensor zero drift target specifications and overall calibration laboratory expanded uncertainty prevents falsely passing out-of-tolerance units.
Calibration facilities accredited under ISO/IEC 17025 verify environmental chamber spatial gradients before calculating reported expanded uncertainties.

Reference Calibration Run Execution
Executing a traceable zero-drift calibration sequence requires strict adherence to standardized measurement steps to maintain traceability chains:
- Mount target piezoresistive pressure transducers onto the calibration manifold inside the environmental test chamber, connecting pressure lines to the vacuum reference system.
- Connect sensor electrical leads to auto-zeroing data acquisition channels using shielded, low-thermal EMF extension cabling.
- Evacuate the pressure manifold to below 0.1 Pascal, verifying vacuum stability via a calibrated capacitance diaphragm gauge for absolute pressure reference.
- Stabilize chamber temperature at the reference baseline of 20.0 degrees Celsius, holding condition for 60 minutes until thermal equilibrium criteria are satisfied.
- Record baseline zero-pressure bridge output voltage and internal input bridge resistance across 100 sequential measurement samples.
- Step chamber temperature across target calibration plateaus, enforcing a minimum dwell time of 45 minutes at each step before recording stabilized voltage and resistance data.
- Cycle chamber back through decreasing temperature steps to measure descending thermal zero outputs for thermal hysteresis calculations.
- Calculate polynomial compensation matrix coefficients using least-squares regression applied to recorded voltage, temperature, and resistance data arrays.
- Program calculated compensation coefficients into transducer ASIC memory or calculate passive trim resistor values for substrate laser trimming.
- Perform a verification thermal run across the complete temperature range, recording corrected zero drift outputs to confirm compliance with target tolerance bands.
Contracts governing accredited sensor calibration require specifying the exact expanded measurement uncertainty alongside the complete environmental test conditions under which zero drift figures were collected.

Ledger

Commercial Economics of Thermal Calibration Profiles
Thermal zero drift calibration constitutes a major fraction of total manufacturing cost for precision piezoresistive pressure transducers. Processing sensors through thermal calibration chambers requires substantial capital equipment investment, high electrical power consumption, and multi-hour processing cycles that constrain production throughput. A basic room-temperature single-point calibration requires minutes of processing time, whereas an 11-point thermal calibration cycle spanning minus forty to one hundred twenty-five degrees Celsius requires twelve to eighteen hours inside environmental test chambers.
Factory calibration pricing scales directly with the complexity of the executed thermal profile. Sourcing practice decisions balance required field measurement accuracy against unit procurement costs. Tiered calibration structures reflect these physical testing realities directly in market pricing schedules.
| Calibration Tier | Thermal Test Nodes | Chamber Cycle Time | Yield Impact | Relative Unit Cost | Achievable Thermal Zero Spec |
|---|---|---|---|---|---|
| Standard Room Temp | 1 Point (20 °C) | 0 Hours | Baseline (>99%) | 1.0x Base | Uncompensated (±2.0 %FSO) |
| Dual-Point Thermal | 2 Points (20, 70 °C) | 3.5 Hours | Low Fallout (97%) | 1.35x Base | Linear Trim (±0.50 %FSO) |
| Industrial Thermal | 5 Points (-10 to 85 °C) | 7.5 Hours | Moderate (93%) | 1.80x Base | 2nd Order Fit (±0.10 %FSO) |
| Extended Environment | 9 Points (-40 to 125 °C) | 14.0 Hours | High Fallout (86%) | 2.60x Base | 3rd Order Fit (±0.03 %FSO) |
| High-Precision Grid | 11 Temp × 5 Press Grid | 22.0 Hours | Severe (78%) | 4.10x Base | Custom Matrix (±0.01 %FSO) |
Procurement specifications demanding tight thermal zero drift performance across wide operating bands frequently trigger unexpected production yield losses. Individual silicon wafer runs display variable thermal drift distributions. When purchasing contracts specify an aggressively low maximum thermal zero drift requirement, a significant percentage of production die may fail to meet specifications even after receiving digital polynomial compensation.
Suppliers pass the financial cost of this rejected yield onto buyers through higher per-unit prices.
Factory zero-drift trim specs reflect unmounted silicon die behavior rather than fully packaged transducer performance.
Re-Calibration Intervals and Service-Life Drift Budgets
Thermal zero drift characteristics change over long operational lifetimes due to subtle physical aging mechanisms. Long-term baseline wander occurs as internal stresses inside packaging adhesives, metallic headers, and glass isolation joints slowly relax over years of thermal cycling. Silicon piezoresistors experience microscopic dopant migration and surface passivation charge trapping when exposed to continuous elevated operating temperatures under applied excitation voltage.
Consequently, initial factory thermal zero drift calibration parameters decay gradually over field deployment duration.
Specifying re-calibration intervals demands evaluating both thermal zero drift decay rates and critical application risk thresholds. High-reliability aerospace and industrial process safety systems require annual verification of sensor thermal zero offset. Field calibration of thermal zero drift presents major operational challenges, as recreating multi-point thermal chamber sweeps in field environments is impractical.
Maintenance teams usually replace aging transducers with freshly factory-calibrated units, returning removed sensors to accredited calibration laboratories for bench verification and re-coefficient generation.
Analyzing field-returned sensor drift records establishes real-world thermal zero stability decay rates, allowing an optimized balance in procurement specifications between initial calibration accuracy targets and long-term re-calibration expenses. Defining clear acceptance criteria in procurement contracts protects buyers against paying premium pricing for high-order digital calibration trims that degrade rapidly after initial thermal cycling. Quality acceptance clauses should mandate that supplier zero drift performance guarantees remain valid after a minimum of fifty thermal shock cycles across the full specified storage temperature range.
Procurement teams control overall lifecycle costs by matching thermal calibration rigor precisely to true operating environment limits rather than default catalog options.