Quantification of Long Term Vacuum Cavity Outgassing and Zero Offset Instability in Sealed MEMS Absolute Pressure Sensors
Vacuum cavity outgassing drives long term zero offset instability in MEMS absolute pressure sensors by increasing internal cavity pressure over time.

Void

Kinetic Pressure Trajectory in Microscopic Cavities
Micro-machined absolute pressure sensors rely on an internal reference cavity evacuated during die fabrication and sealed at wafer level. The baseline output signal registers zero absolute pressure when no net differential force acts on the thin silicon sensing diaphragm. No micro-cavity holds a perfect vacuum over years in the field; molecules trapped inside the enclosure, desorbed from interior walls, or diffusing through bond lines steadily elevate internal pressure.
The interior geometry of a typical piezoresistive or capacitive absolute pressure cell features an active volume between 10-13 m3 and 10-11 m3. Because this volume is so small, even minute gas influx causes a sharp rise in pressure. Molecular flow governs gas behavior inside these micro-structures: at micro-torr vacuum levels, the mean free path of gas molecules exceeds cavity dimensions by several orders of magnitude, establishing a Knudsen number well above 10.
Molecular collisions occur almost entirely with cavity surfaces rather than between gas particles. Each uncaptured molecule adds directly to the hydrostatic force on the back of the flexible sensing membrane. Accumulating just 10-11 moles of residual gas raises cavity pressure by roughly 2.5 mbar inside a 10-11 m3 enclosure at room temperature.
This internal pressure opposes external atmospheric load, shifting the piezoresistive bridge output or capacitive bridge balance in a negative direction.
A residual cavity pressure increase of 1.3 mbar inside a 0.01 cubic millimeter volume alters zero-point calibration by 0.13 percent full scale on a 1000 mbar absolute sensor.
Diaphragm Deflection Mechanics under Internal Load
Mechanical stress across a micro-machined silicon membrane follows classical thin-plate deflection equations as long as displacement stays below thirty percent of diaphragm thickness. Internal pressure acts as a uniform surface force opposed to measured ambient pressure, reducing the net differential displacement across piezoresistive strain elements or capacitive gaps.
Quantifying this relationship demands exact modeling of diaphragm stiffness and cavity volume. For a square silicon diaphragm with side length a, thickness h, Poisson ratio v, and Young modulus E, central deflection under differential pressure load P obeys the linear relationship:
w0 = (0.0138 · P · a4) / (D)
where flexural rigidity D is defined as:
D = (E · h3) / (12 · (1 – v2))
Inside an evacuated cavity where baseline design pressure equals 0.01 mbar, an outgassing rate of 10-14 mbar·l/s produces a predictable pressure slope over time. Assuming a cavity volume of 10-5 cm3 (10-8 liters), the rate of internal pressure rise dP/dt equals outgassing rate divided by volume:
dP/dt = (10-14 mbar·l/s) / (10-8 l) = 10-6 mbar/s
Extrapolating this rate over operational lifespans highlights how severe outgassing instability can be. Over one calendar year (3.1536 · 107 seconds), cavity pressure increases by 31.5 mbar. For an absolute barometric sensor calibrated across a 600 mbar to 1100 mbar operating range, a 31.5 mbar cavity pressure accumulation degrades measurement accuracy by more than 6.3 percent of span.
Initial device accuracy reflects factory test conditions, while subsequent zero-point wander is frequently attributed to ambient thermal stress rather than active cavity vacuum degradation.


Desorption
Surface Outgassing Species and Activation Kinetics
Internal surfaces of sealed micro-cavities release adsorbed gas species through thermally driven physical and chemical desorption. The gas composition inside the cavity evolves over time based on surface composition, cleanroom processing history, and wafer bonding chemistry. Monolayers of water vapor, hydrocarbons, hydrogen, carbon monoxide, and atmospheric gases adhere to structural silicon, silicon dioxide, and metallic traces during assembly.
Physisorbed water vapor desorbs first, releasing rapidly at ambient operating temperatures between 20 °C and 80 °C due to low binding energies between 0.2 eV and 0.4 eV. Chemisorbed species, such as hydroxyl groups bound to silanol surfaces or hydrogen trapped within electroplated metallization, require significantly higher thermal energy to break chemical bonds. Chemisorption binding energies range from 1.0 eV to 2.5 eV, causing continuous outgassing over multi-year service periods.
Outgassing flux J(t) from interior cavity walls follows a modified power law decay during early deployment, transitioning into exponential diffusion-limited release at extended durations:
J(t) = J0 · t-α · exp(-Ea / (k · T))
where J0 represents initial outgassing rate density, α is a decay exponent typically between 0.5 and 1.0, Ea is activation energy, k is the Boltzmann constant, and T is absolute temperature in Kelvin.

Thermal Acceleration and Long Term Decay Curves
Operating temperatures accelerate surface outgassing rates in accordance with Arrhenius kinetics. Raising ambient temperature by 30 °C increases hydrogen diffusion rates through single-crystal silicon by more than an order of magnitude. Deploying sensors in high-temperature industrial processes or automotive powertrain monitoring accelerates cavity vacuum degradation, shifting zero-point offsets far faster than room-temperature laboratory models predict.
Anodic bonding exacerbates internal gas generation. Applying electric fields between 400 V and 1000 V at temperatures near 400 °C to join silicon to Pyrex glass releases molecular oxygen as a byproduct. Oxygen partial pressure inside glass-bonded micro-cavities reaches elevated baseline levels immediately after sealing unless active chemical sinks absorb the gas.
| Material Interface | Dominant Species | Outgassing Rate (mbar·l/s·cm²) | Activation Energy (eV) |
|---|---|---|---|
| Unpassivated Single Crystal Silicon | H₂, H₂O | 1.2 · 10⁻¹² | 0.45 |
| Thermally Grown Silicon Dioxide | H₂O, CO₂ | 4.5 · 10⁻¹⁴ | 0.82 |
| Pyrex Glass (Anodically Bonded) | O₂, Na+ traces | 8.0 · 10⁻¹¹ | 1.15 |
| Au-Sn Eutectic Solder Interconnect | H₂, Organic Volatiles | 3.1 · 10⁻¹³ | 0.68 |
| PECVD Silicon Nitride Passivation | H₂, NH₃ | 6.7 · 10⁻¹³ | 0.94 |
High-temperature exposure accelerates initial outgassing decay while raising peak cavity equilibrium pressure. Thermal baking during manufacturing removes physisorbed surface layers, yet bulk hydrogen diffusion from inner metallization layers persists over extended operational lifespans.
Materials exhibiting activation energies below 0.6 electron-volts dominate early zero drift, whereas high activation energy species dictate multi-year calibration stability.
Unresolved interactions between bulk diffusion pathways and surface passivation density make long-term outgassing equilibrium difficult to model deterministically over a twenty-year operational window.

Getter

Sorption Dynamics of Thin Film Reactive Alloys
Non-Evaporable Getters (NEG) provide the primary internal mechanism for maintaining high vacuum within sealed micro-cavities. Thin-film getter materials, typically zirconium, vanadium, titanium, and iron alloys, are sputtered onto non-active cavity surfaces before wafer bonding. Upon thermal activation under vacuum, surface oxides dissolve into the bulk getter matrix, exposing metallic binding sites that chemisorb active gas molecules.
Chemisorption is irreversible for active species like oxygen, nitrogen, carbon monoxide, and carbon dioxide. Getter materials absorb hydrogen reversibly, forming solid solutions where equilibrium hydrogen pressure depends on local temperature and concentration. Overall getter capacity dictates how much gas can be absorbed before surface saturation impairs pumping speed.
Pumping speed S for a specific gas species varies across operational life according to fractional surface coverage θ:
S = S0 · (1 – θ)
where S0 represents initial pumping speed per unit surface area. As gas molecules bind to reactive sites, fractional coverage approaches unity, reducing active pumping capability toward zero and letting vacuum levels decay.
Noble Gas Accumulation and Getter Saturation
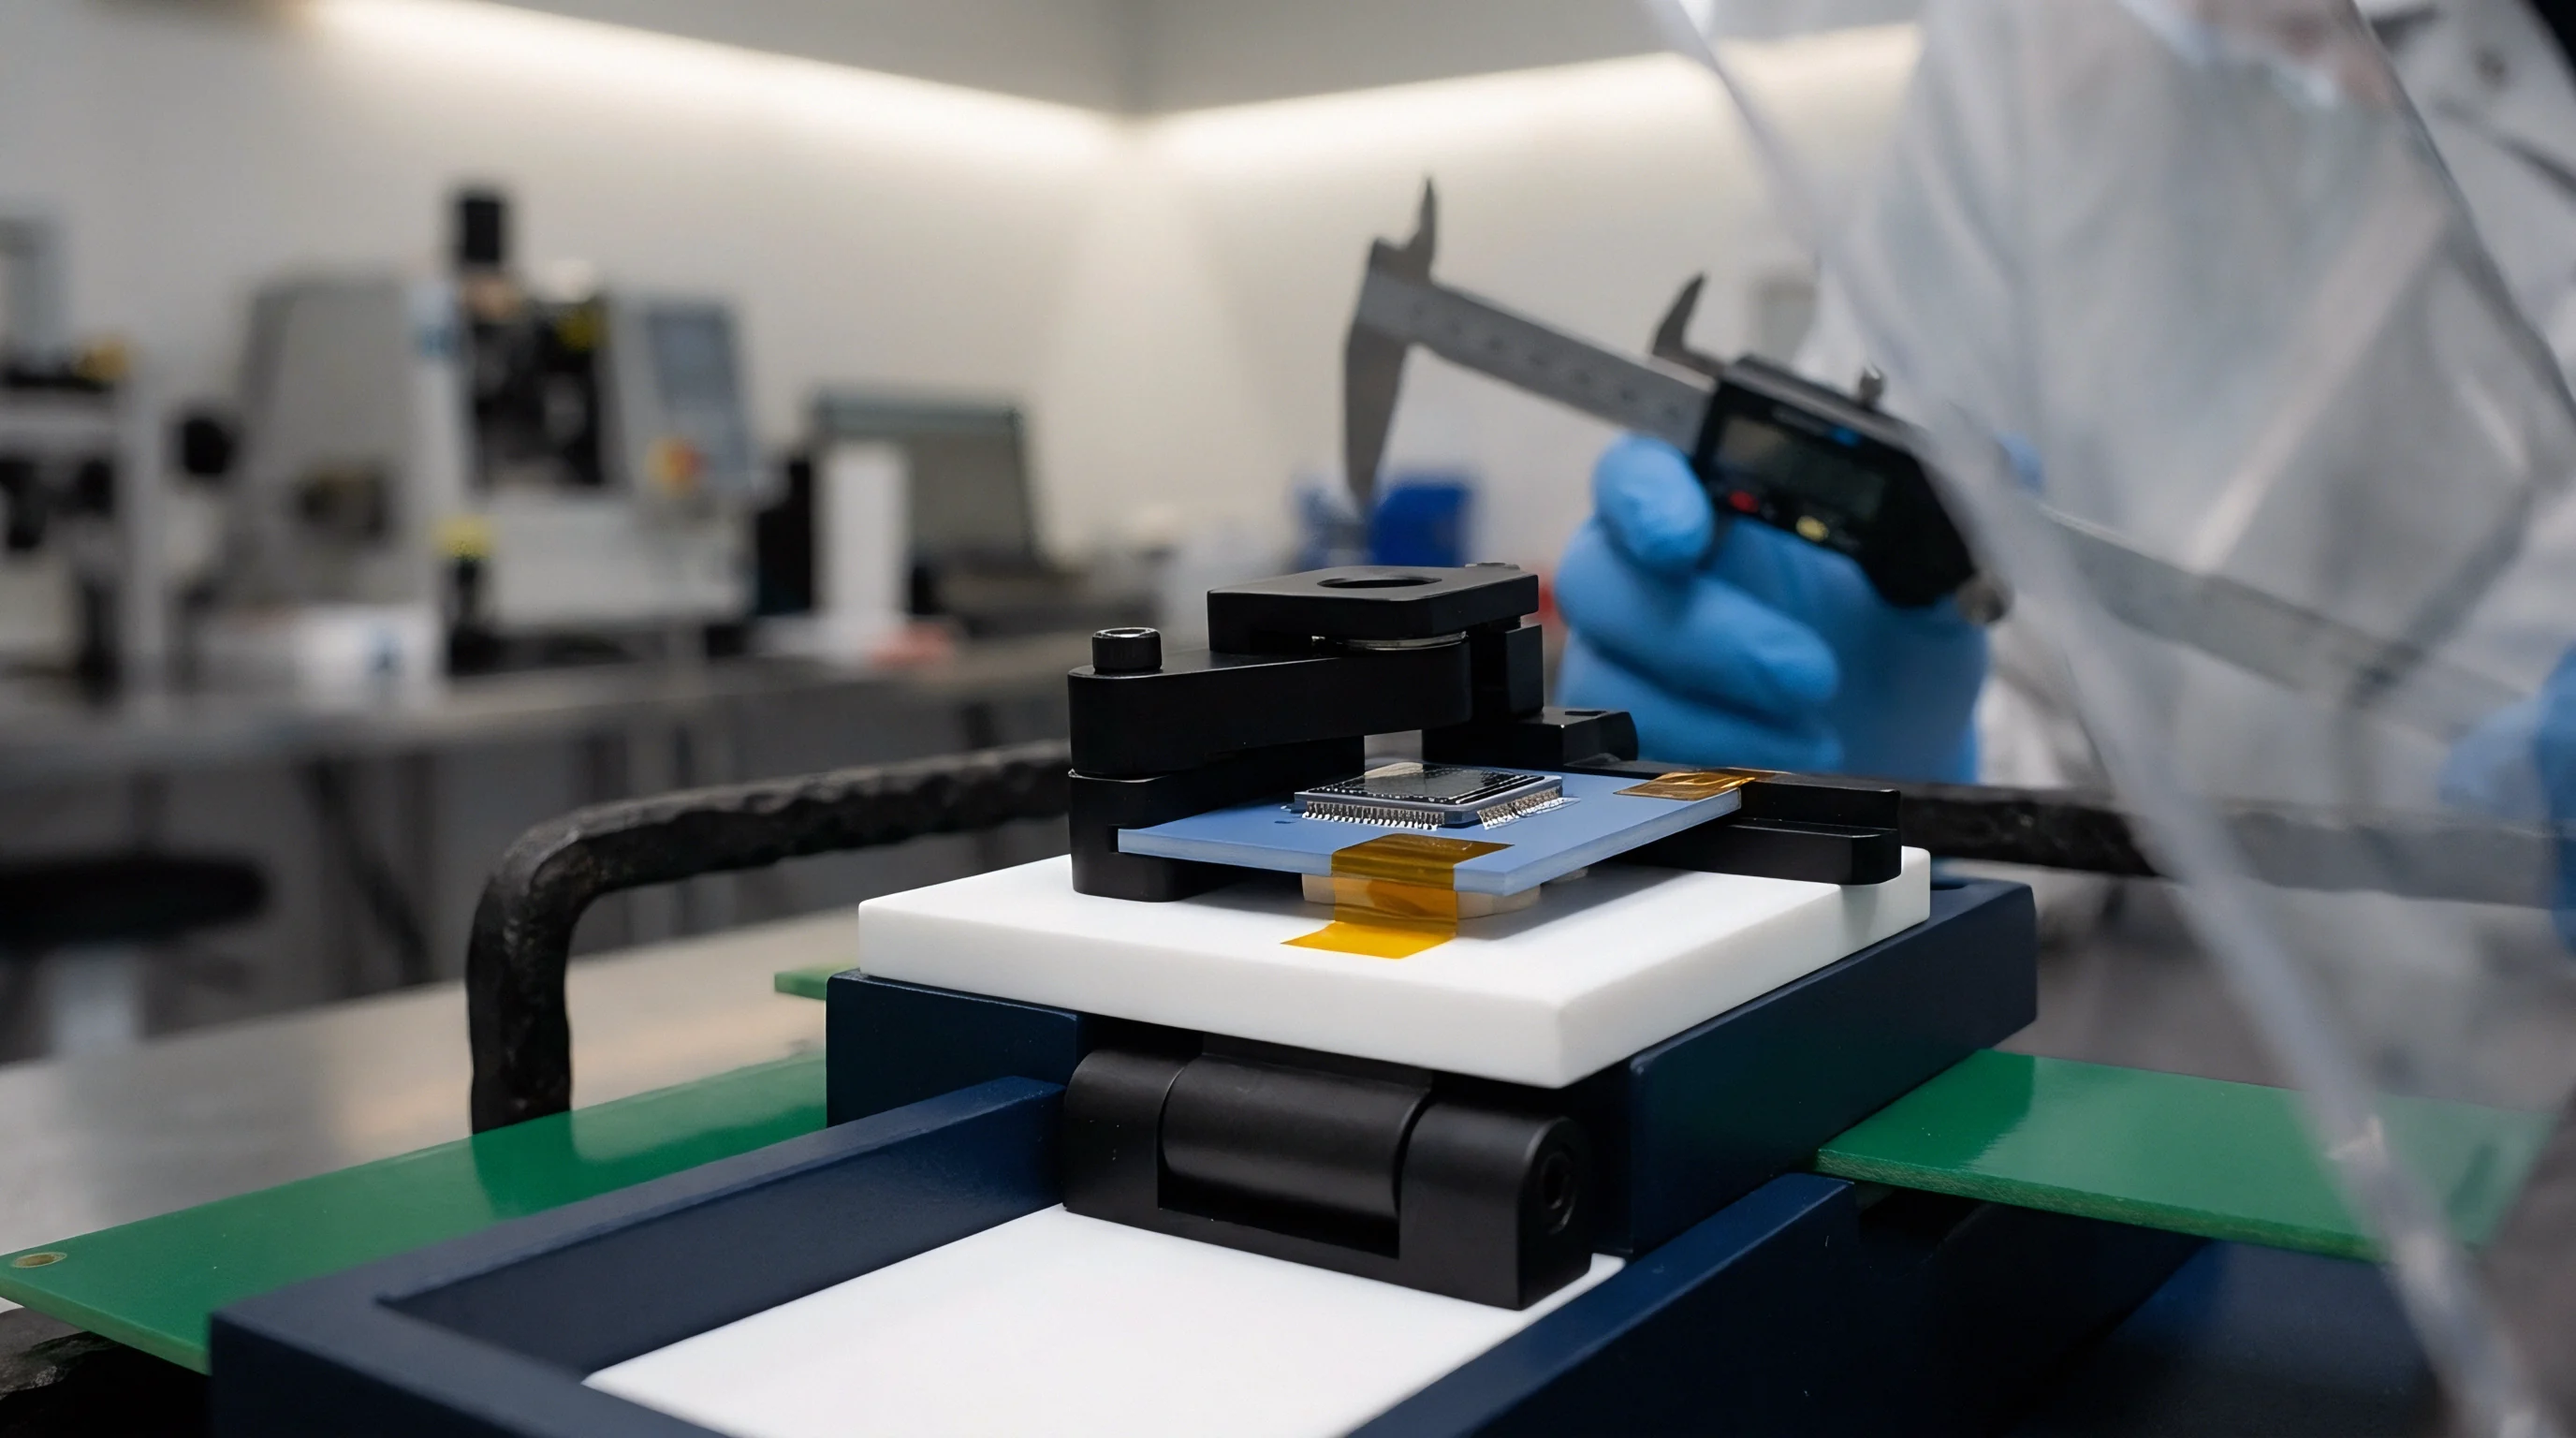
Getter alloys show no chemical reactivity toward noble gases like helium, argon, neon, and krypton. Argon trapped inside cavities during plasma etching or reactive ion processing remains in the enclosure permanently, while environmental helium diffusing through structural glass accumulates continuously, unimpeded by thin-film getter coatings.
This inability to pump noble species sets a firm floor on cavity vacuum. If processing leaves a residual argon partial pressure of 10-3 mbar inside the micro-structure, internal vacuum will never improve beyond 10-3 mbar regardless of getter film thickness or thermal activation efficiency.
Selecting and qualifying non-evaporable getter implementations requires analyzing distinct operational failure modes:
- Incomplete Thermal Activation yields insufficient oxide dissolution during wafer bonding, reducing initial pumping speed below design thresholds.
- Thermal Capacity Saturation occurs when continuous high-temperature exposure drives absorbed hydrogen out of the getter bulk and back into the micro-cavity.
- Passivation Layer Poisoning happens when trace hydrocarbons deposited during wafer cleaning form permanent surface carbides that block active metallic binding sites.
- Noble Gas Infiltration results from atmospheric helium diffusion through structural glass substrates, elevating cavity pressure despite active getter sorption of atmospheric nitrogen and oxygen.
- Particle Exfoliation develops when mechanical stress mismatches between sputtered getter films and underlying substrates cause film peeling, creating conductive debris inside capacitive sensing gaps.
Sorption capacity limits must exceed total expected outgassing volume by a factor of ten to ensure baseline stability over extended deployment cycles.


Hermeticity
Molecular Leakage Dynamics across Wafer Bonds
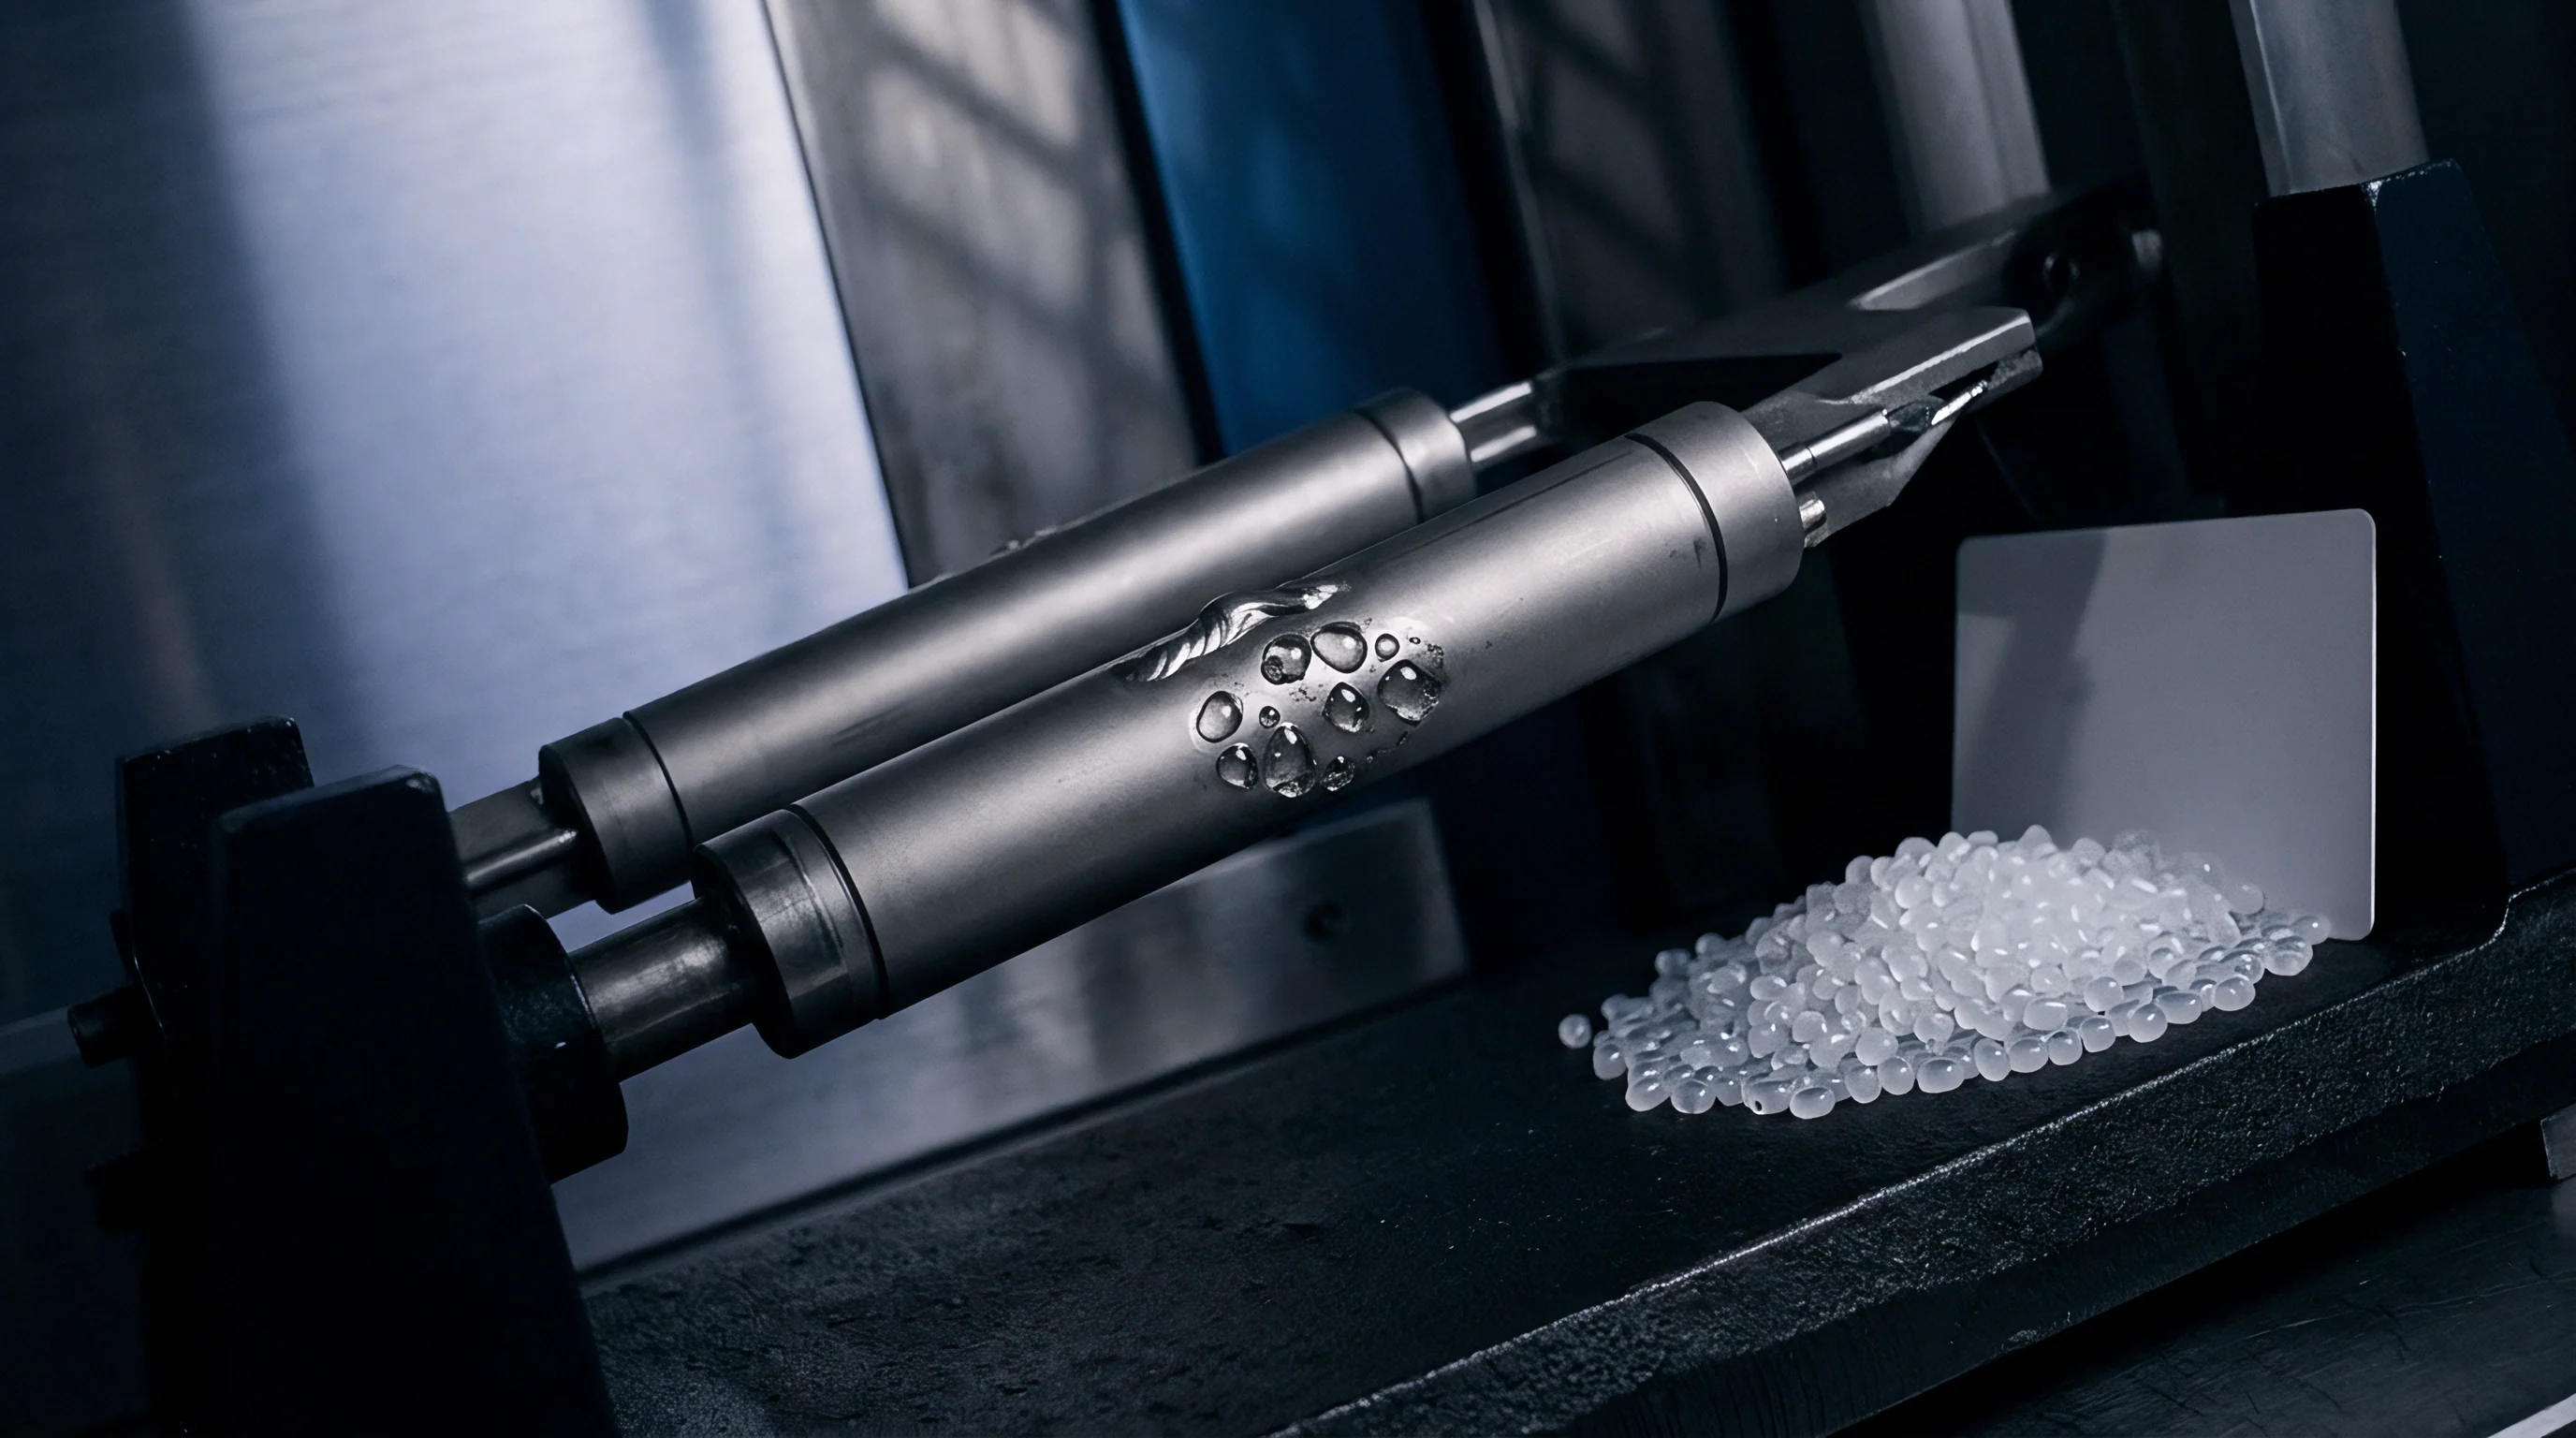
Hermetic encapsulation of MEMS absolute pressure sensors relies on wafer-scale bonding. Direct silicon-to-silicon fusion bonding, glass frit, anodic bonding, and gold-tin (Au-Sn) eutectic solder bonding are the primary industrial sealing methods. Microscopic voids, micro-cracks, and boundary diffusion pathways across these interfaces allow atmospheric gases to enter the reference cavity through micro-leakage.
Gas transport through sub-nanometer boundary channels operates strictly within the Knudsen molecular flow regime. Flow rate Q through a leak channel of length L and hydraulic radius r under molecular conditions obeys the relation:
Q = (8 / 3) · √(2 · π · R · T / M) · (r3 / L) · ΔP
where M represents molar mass of the leaking gas species, R is the universal gas constant, and ΔP is the differential pressure across the hermetic boundary. Light gases with small molecular weights, such as helium and hydrogen, leak through interfacial boundaries substantially faster than atmospheric nitrogen or oxygen.

Why Conventional Helium Leak Detection Fails Small Cavities?
Standard industrial hermeticity testing relies on helium mass spectrometer methods documented in standards such as MIL-STD-883 Method 1014. Commercial helium leak detectors reach practical sensitivity limits near 10-10 mbar·l/s. MEMS pressure sensor micro-cavities typically have internal volumes around 10-8 liters, rendering standard fine leak testing ineffective.
A leak rate of 10-11 mbar·l/s ~ below the detection floor of commercial helium detectors ~ pressurizes a 10-8 liter reference cavity to 1.0 mbar in roughly 1,000 seconds. A device passing standard helium leak testing can thus suffer major zero-point baseline drift within hours of manufacture. Alternative non-destructive methods measure actual diaphragm deflection to track internal pressure accumulation over time.
Standard military and industrial fine leak test limits fail to catch micro-cavity leak rates that corrupt absolute pressure sensor accuracy within weeks of field deployment.
Quantifying micro-cavity vacuum decay demands precision optical or electrical characterization sequences executed across controlled thermal storage periods:
- Record baseline diaphragm topography using white-light optical interferometry at ambient room temperature and standard barometric pressure.
- Place the unpowered sensor die inside a calibrated pressure chamber charged with pure helium gas at 5.0 bar absolute pressure for 72 hours.
- Transfer the sensor die immediately to an ambient testing stage and re-measure central diaphragm deflection profile within 15 minutes of removal.
- Store the device inside an evacuated vacuum oven maintained at 125 °C for 500 consecutive thermal aging hours.
- Measure final diaphragm deflection profile using the same optical interferometer to calculate net cavity pressure change across the test interval.
Uncaught interfacial micro-leakage leads to field failures that manifest as gradual zero offset creep, driving premature recalibrations, unrecoverable warranty expenses, and batch recalls.

Screening

Burn in Protocols and Thermal Stabilization Arrays
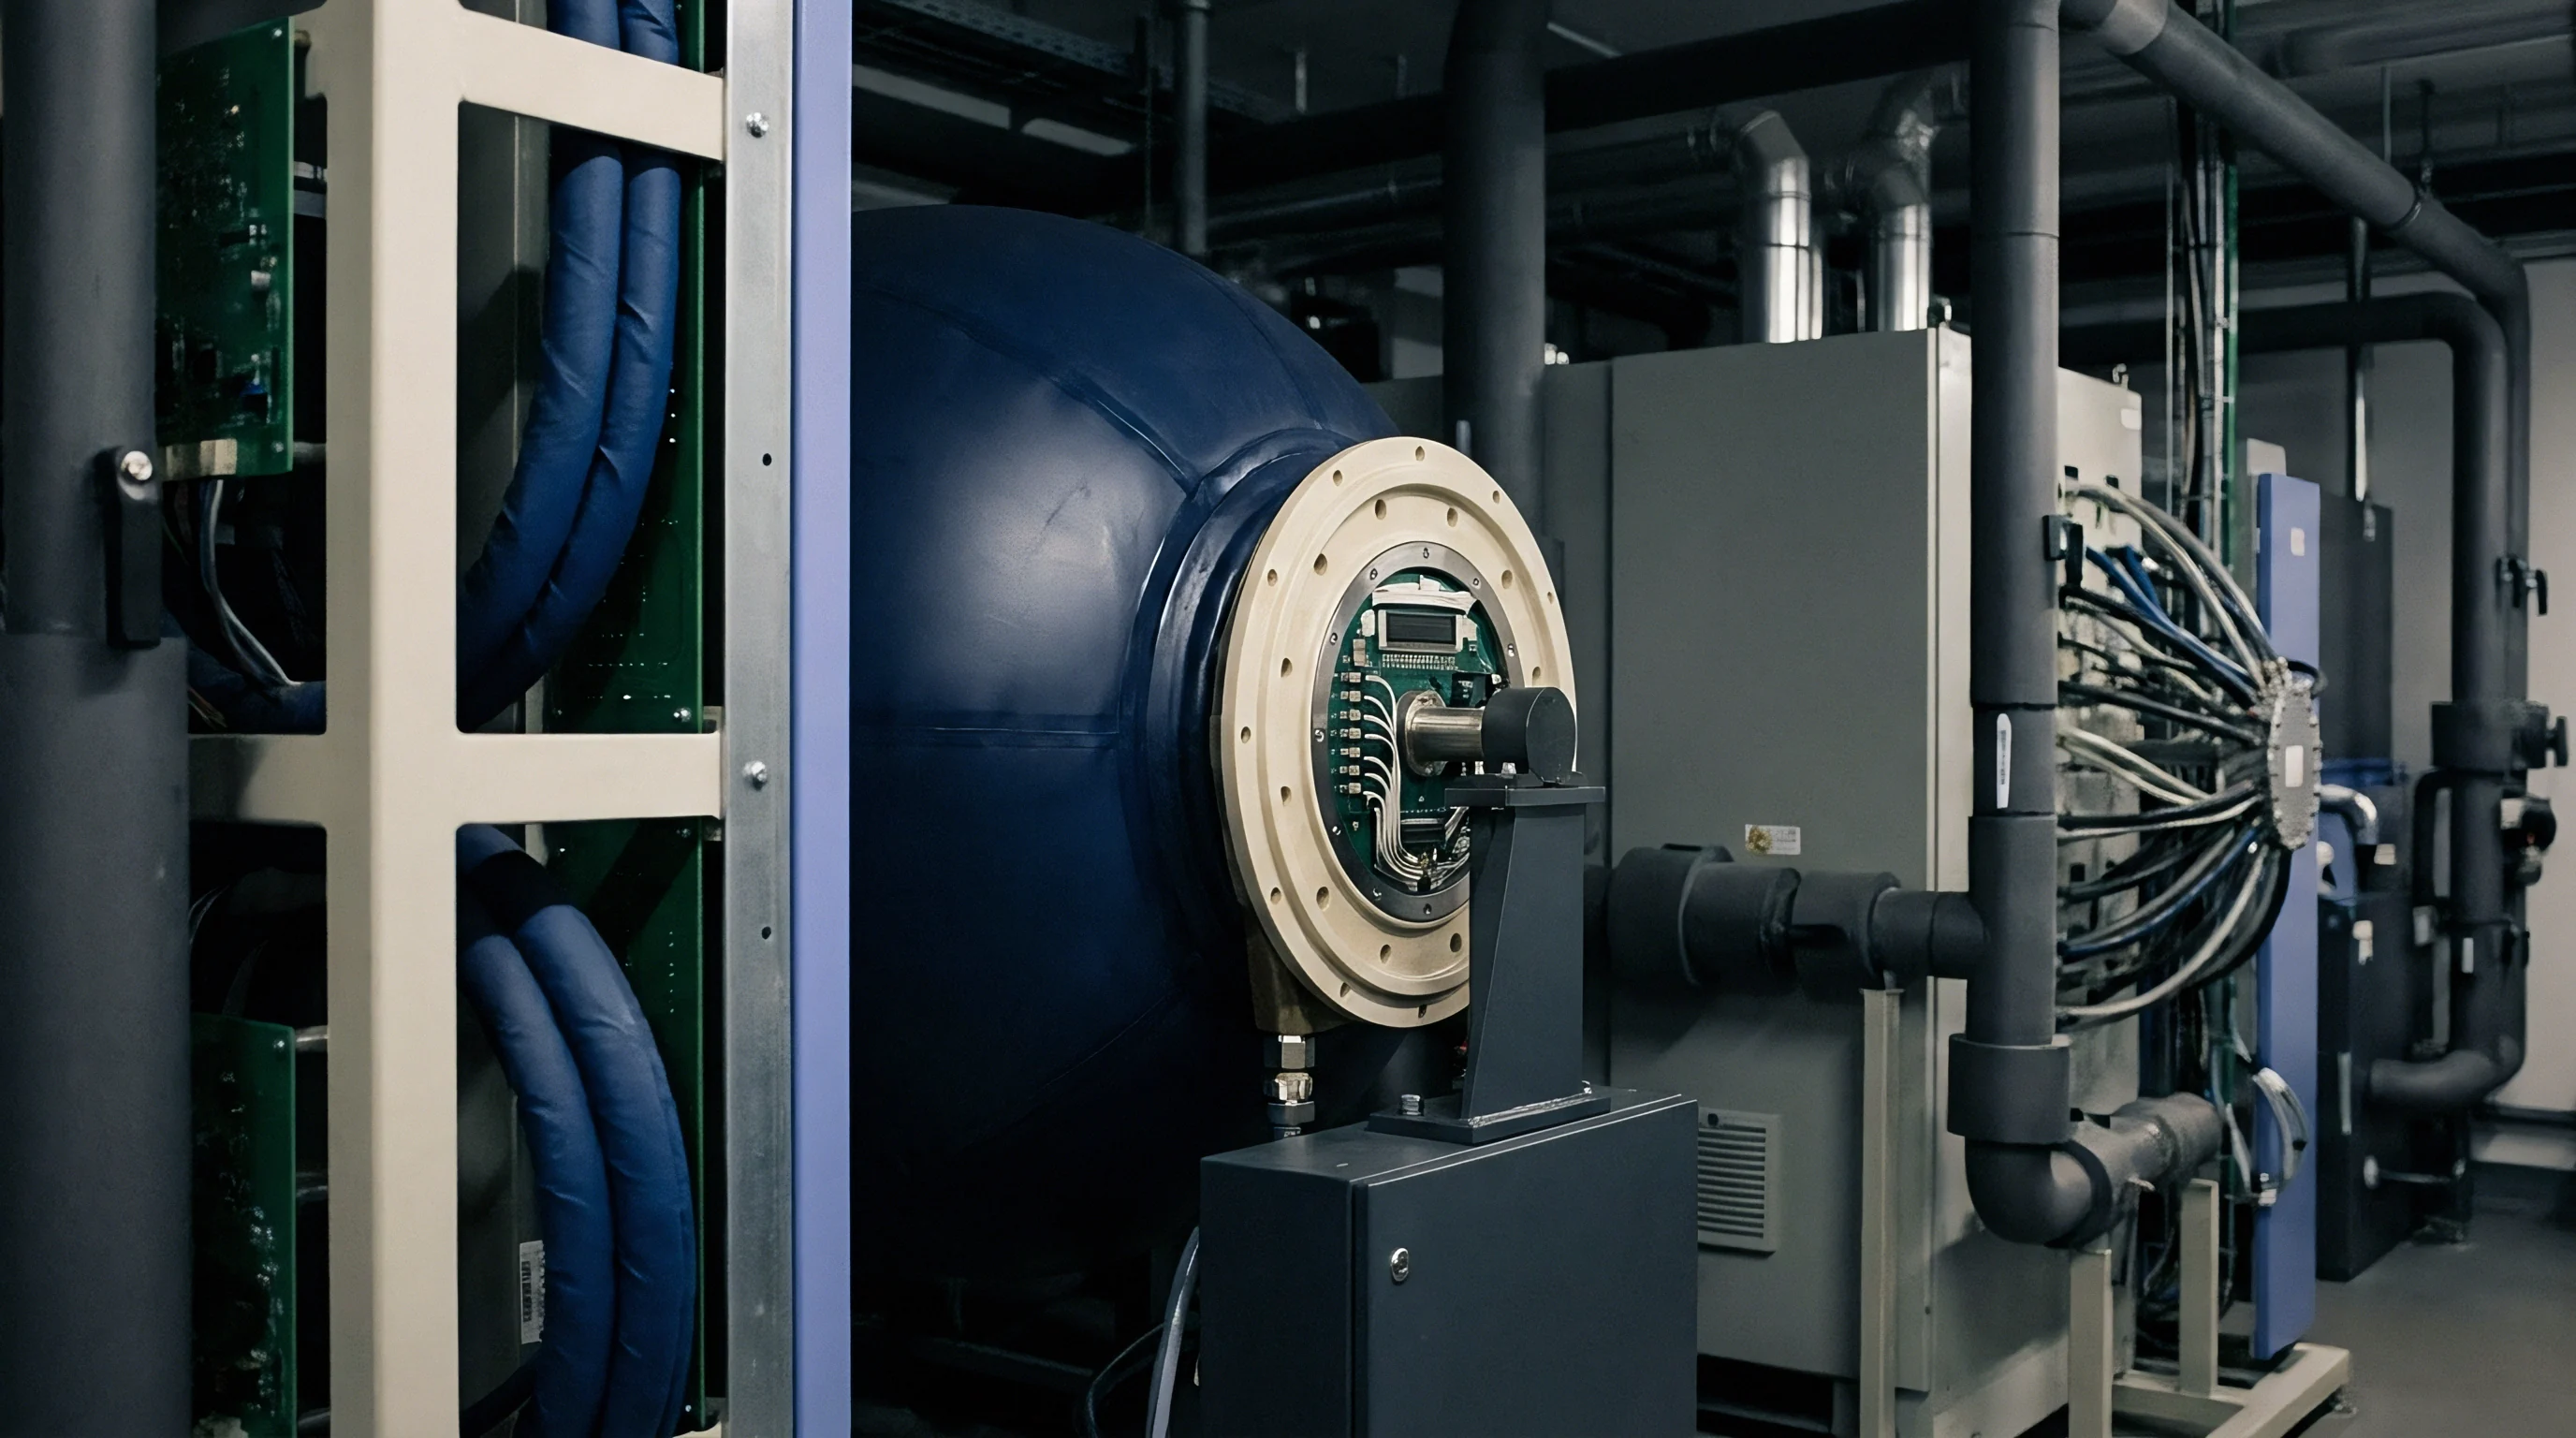
Distinguishing transient outgassing from permanent interface leakage requires specialized Environmental Stress Screening (ESS) protocols. Elevated thermal exposure accelerates surface desorption kinetics, driving early outgassing near completion before final factory calibration. Heating uncalibrated sensor chips under zero-differential pressure conditions shortens these initial exponential decay phases.
Burn-in protocols typically apply temperatures between 125 °C and 150 °C for durations ranging from 48 to 168 hours. Thermal acceleration factor AT governed by Arrhenius modeling dictates necessary exposure duration:
AT = exp((Ea / k) · ((1 / Tuse) – (1 / Tstress)))
Assuming an activation energy Ea of 0.8 eV for chemisorbed species, aging a sensor at 125 °C for 100 hours simulates roughly 8,700 hours (1 year) of ambient storage at 25 °C. Screening schedules must balance thermal acceleration against structural degradation limits of packaging materials.
| Screening Stage | Thermal Profile | Duration | Monitored Parameter | Acceptance Limit |
|---|---|---|---|---|
| Stabilization Bake | 150 °C in Air | 96 Hours | Zero Pressure Span Delta | < 0.05% FS Shift |
| Thermal Shock Cycling | -40 °C to +125 °C | 250 Cycles | Bridge Resistance Offset | < 0.02% Span Delta |
| High Temp Operating Life | 125 °C Powered | 500 Hours | Continuous Baseline Drift Rate | < 0.001 mbar/hour |
| Helium Bombing Exposure | 5 bar Helium | 72 Hours | Deflection Shift Post-Exposition | < 0.1 µm Central Delta |

Distinguishing Outgassing Stabilization from Boundary Leaks
Separating internal surface outgassing from boundary micro-leakage comes down to analyzing zero-offset drift curvature over thermal aging time. Outgassing kinetics exhibit a declining drift rate d(ΔV)/dt that decreases inversely with the square root of time, flattening toward an asymptote as surface sites deplete.
Interfacial micro-leakage, by contrast, produces a steady linear drift rate over extended aging windows. If zero-point wander remains linear after 200 hours of thermal stress at 125 °C, seal boundary infiltration is the dominant factor. Automated screening arrays run curve-fitting algorithms on sensor logs to identify and reject linear drift trajectories before packaging.
Linear baseline drift during late-stage thermal aging confirms seal integrity loss, whereas logarithmic decay indicates benign surface outgassing depletion.
Quality assurance criteria applied to high-reliability production lots specify lot acceptance based on rigorous drift evaluation statistics:
- Logarithmic Convergence Threshold requires the calculated second derivative of zero drift over time to remain consistently negative throughout the final 48 hours of thermal screening.
- Maximum Allowable Absolute Offset rejects any sensor exhibiting a net zero-point shift exceeding 0.08 percent of full-scale span during thermal stress exposure.
- Activation Energy Uniformity flags production lots where sample subset activation energies deviate by more than 15 percent from qualified process baselines.
- Post Screen Temperature Hysteresis demands that sensor output return to within 0.02 percent of initial room-temperature baseline following cyclic exposure to thermal extremes.
Individual sensor lot compliance documentation specifies that zero-point drift parameters evaluated according to ISO 2859-1 sampling plans must meet an Acceptance Quality Limit (AQL) of 0.25 Level II normal inspection before final sensor calibration.


Provisioning
Lifetime Accuracy Budgeting and Calibration Intervals
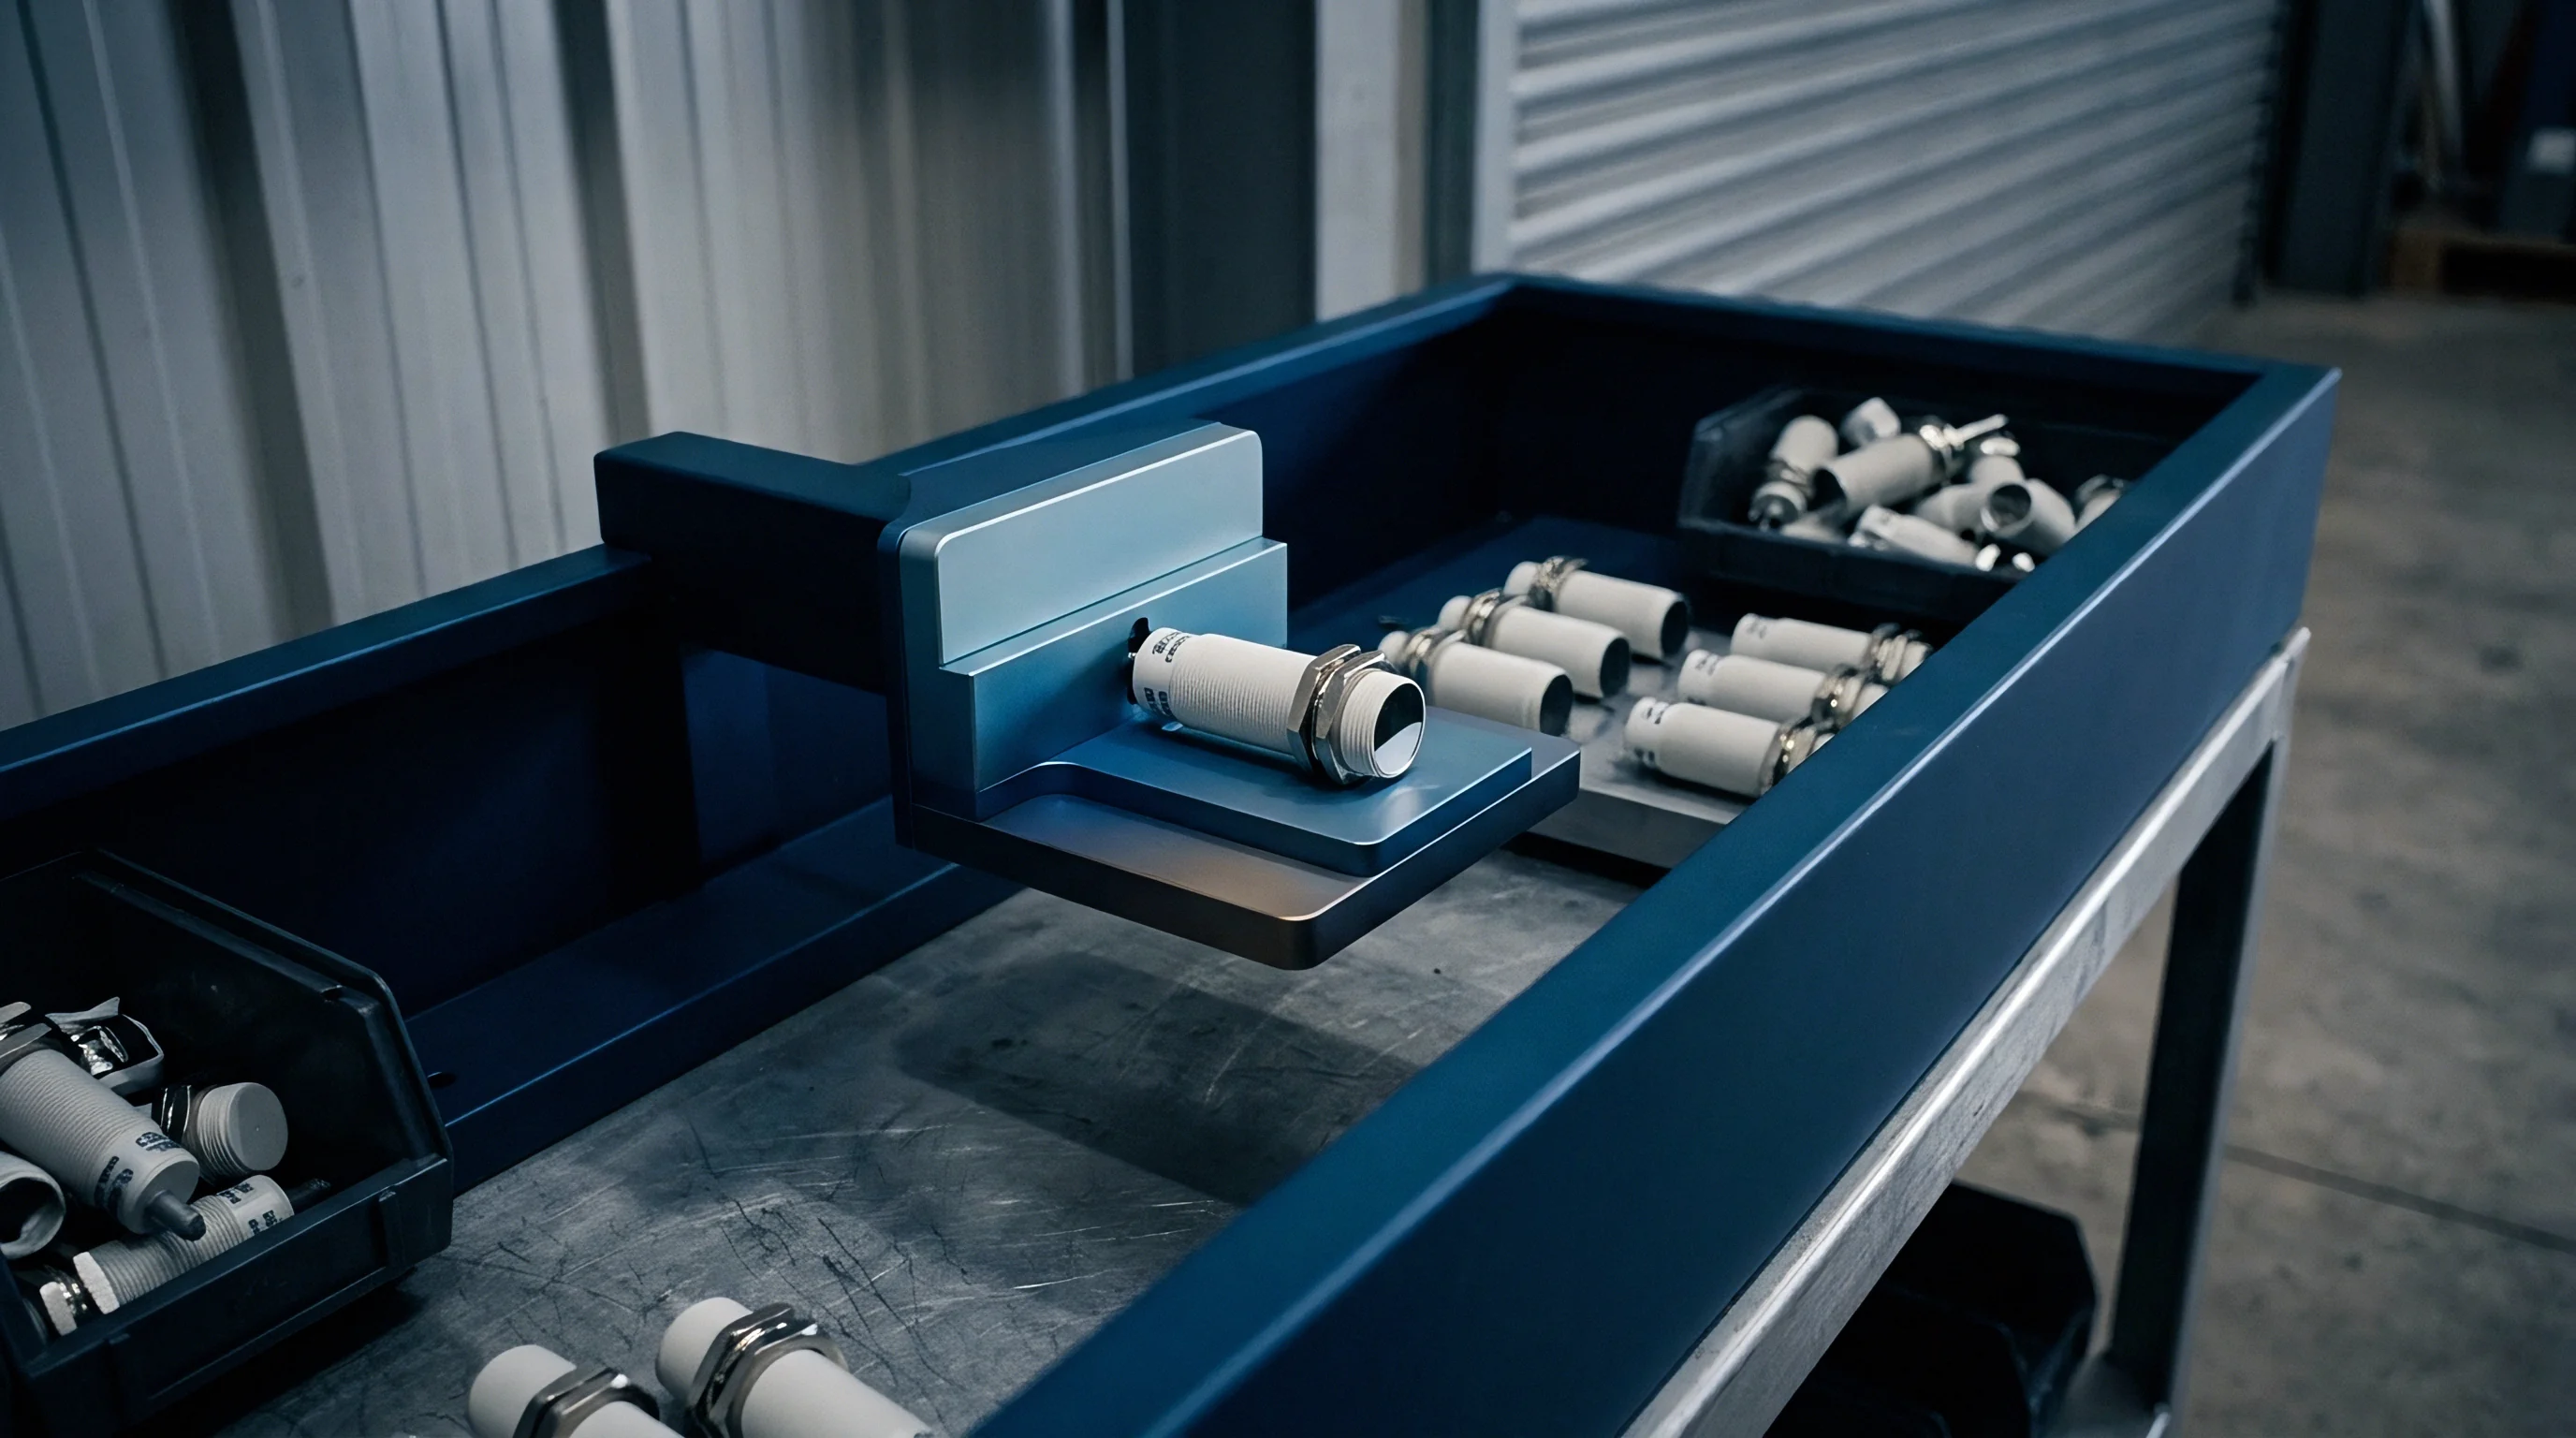
Designing system-level architectures around MEMS absolute pressure sensors requires allocating an explicit error allowance for long-term zero offset drift from cavity degradation. A specification claiming 0.05 percent full-scale accuracy at manufacture becomes invalid if cavity pressure drift consumes 0.2 percent of span over two years in the field. Accuracy models must combine initial calibration uncertainty, thermal hysteresis, piezoresistive aging, and residual vacuum outgassing into a unified root-sum-square (RSS) budget.
Quantifying total measurement uncertainty Usys over service lifespan t employs the combined variance expression:
Usys(t) = √(ucal2 + utemp2 + uhyst2 + (Kdrift · t)2)
where ucal represents factory calibration uncertainty, utemp accounts for uncompensated thermal coefficient errors, uhyst covers mechanical strain hysteresis, and Kdrift defines the verified long-term zero drift rate per year derived from accelerated screening data.
Field recalibration intervals shrink as Kdrift grows. If a process loop permits a maximum total error of 0.5 mbar and combined non-drift errors account for 0.2 mbar, the allowance for cavity pressure growth is 0.3 mbar. For sensors with a verified outgassing drift rate of 0.1 mbar/year, recalibration is required every 36 months.
Raising that drift rate to 0.3 mbar/year reduces the interval to 12 months, tripling routine maintenance overhead across plant operations.
Commercial sourcing strategies balance low-outgassing structural designs featuring high-temperature getter activation against lower-cost standard commercial grades. Sensors manufactured with high-temperature Au-Sn eutectic seals and integrated non-evaporable getters carry unit price premiums of 40 to 80 percent over glass-frit sealed alternatives lacking active getters. That initial cost premium must be weighed against long-term ownership, where unpredicted zero drift forces unscheduled field recalibration, premature sensor replacement, and potential loss of process control compliance across industrial deployments.