Supply Allocation Exposure across Dual Sourced Low Tier Commercial Sensor Topologies
Dual sourcing low tier commercial sensors demands matching ASIC DSP group delays and thermal offset drift profiles to prevent host control loop instability.

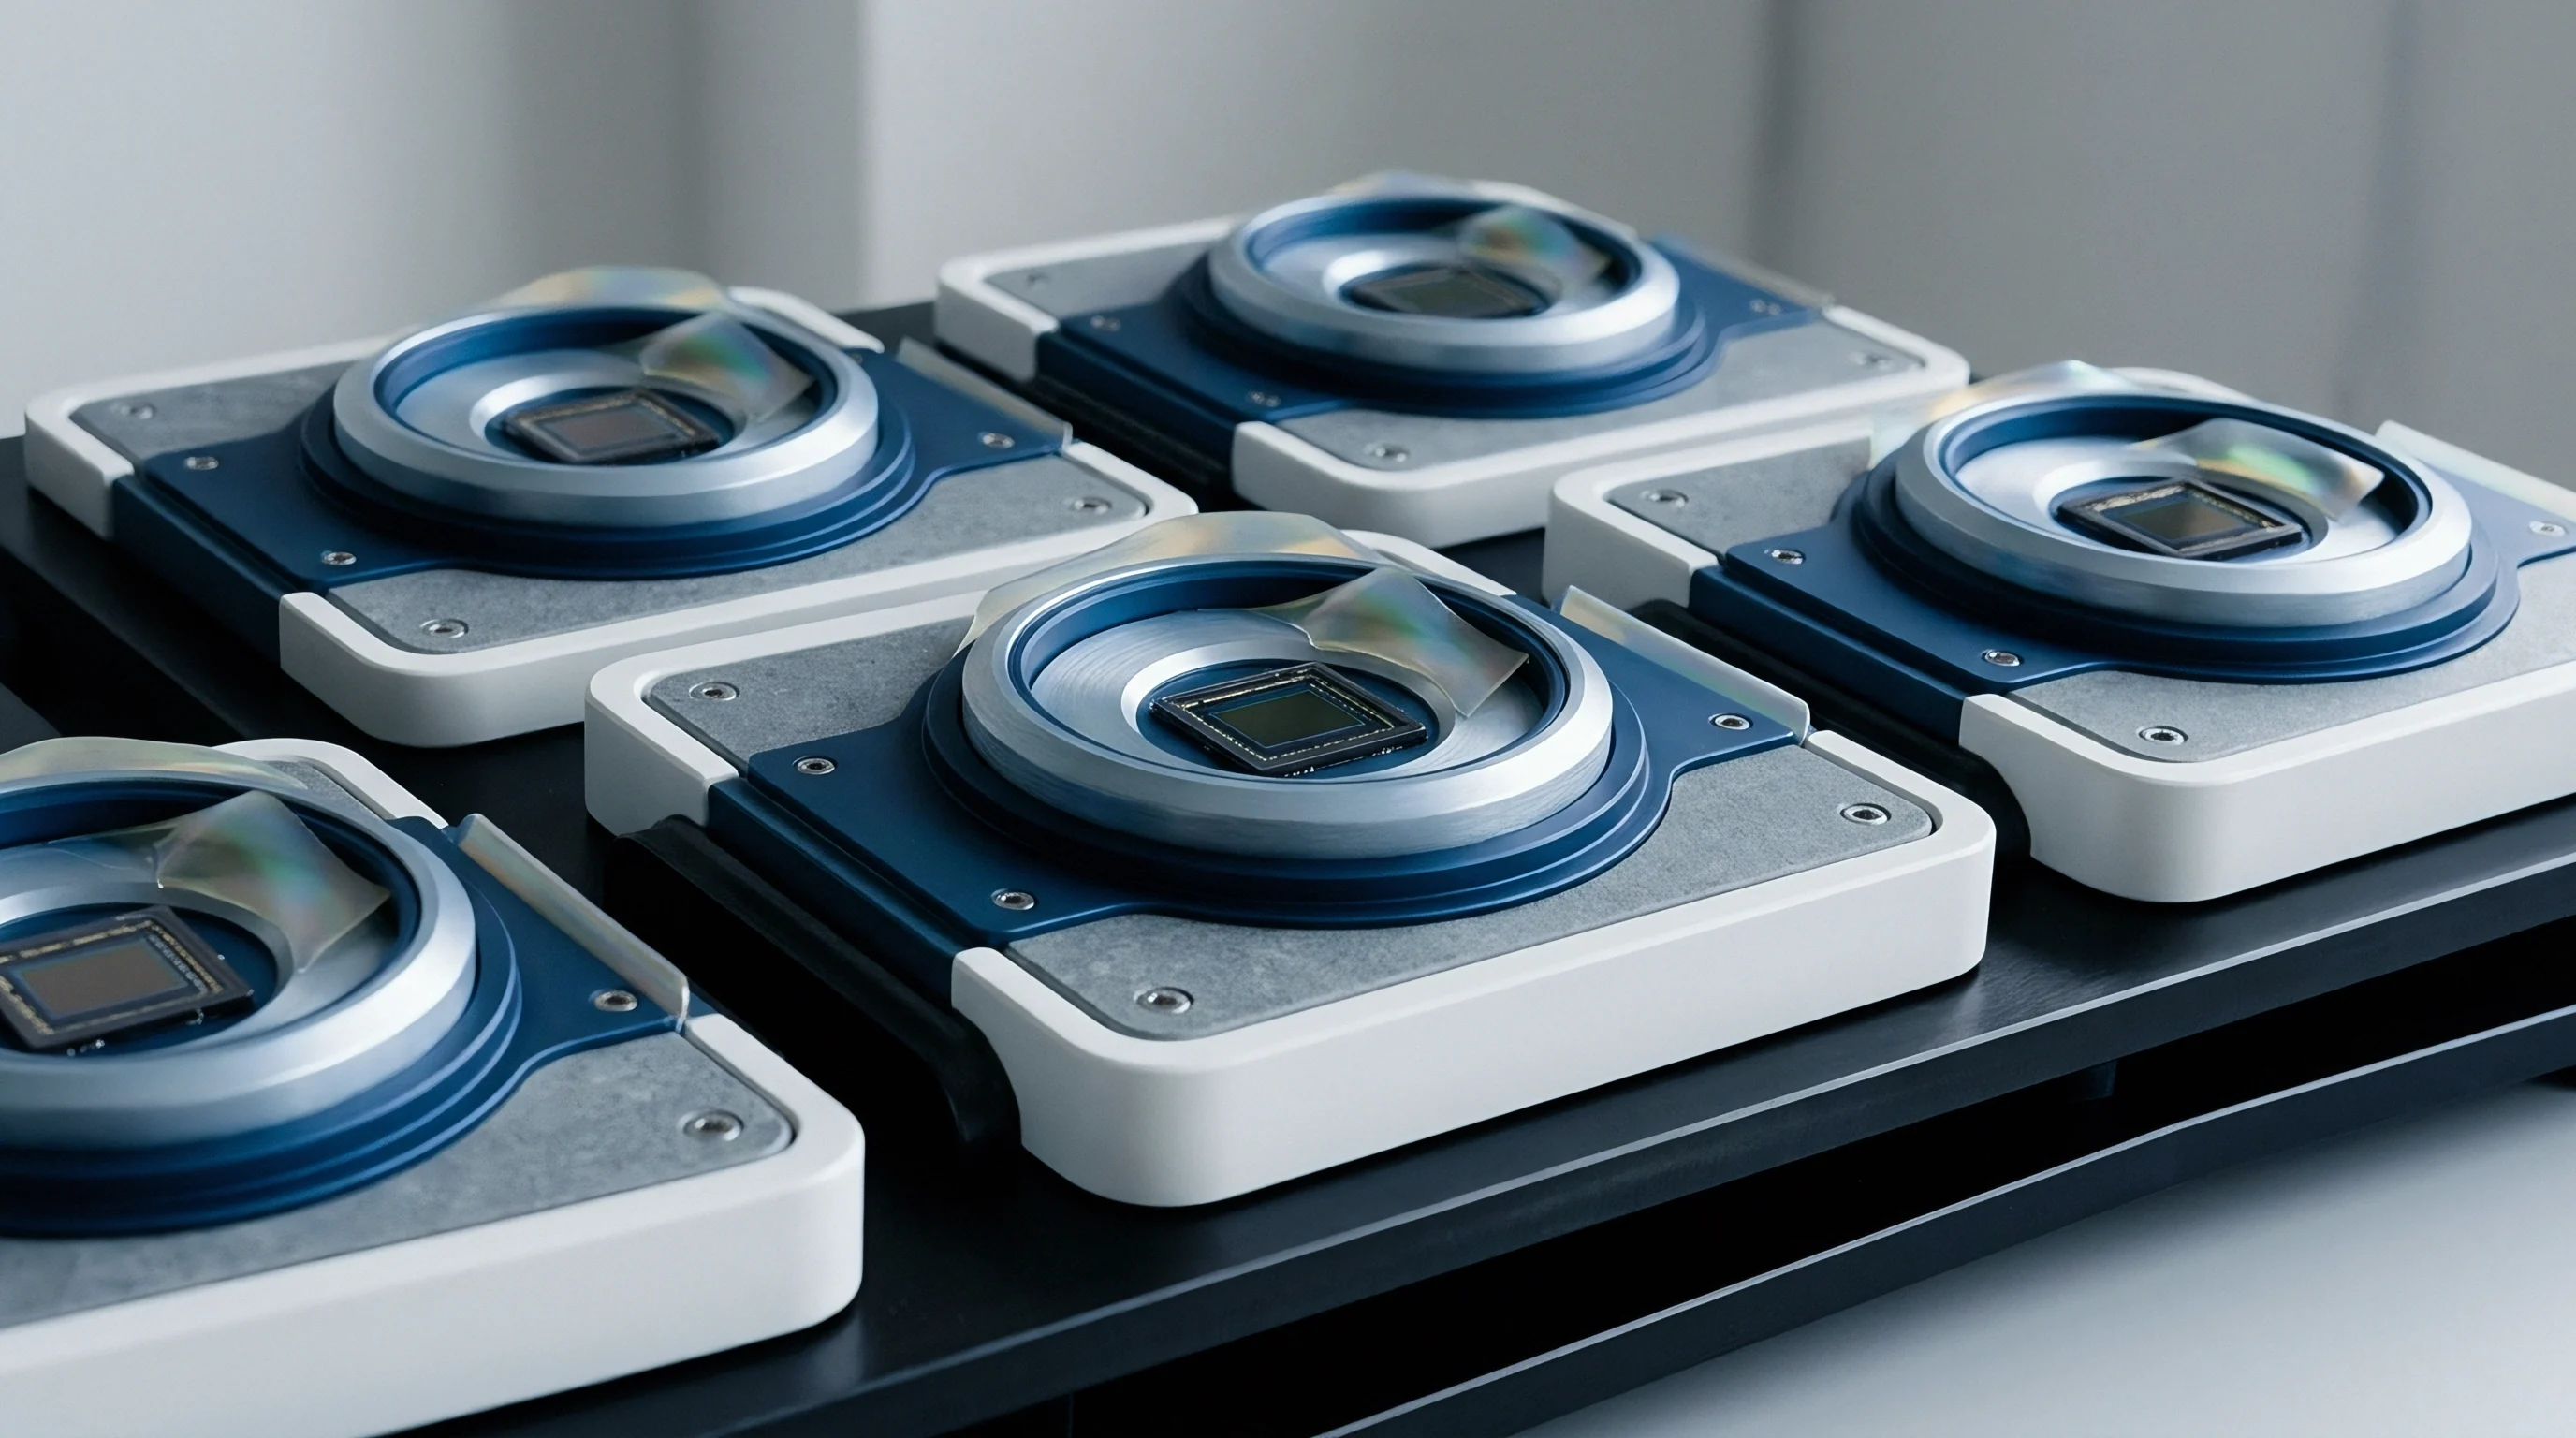
Wafer
Low-cost commercial sensors fill a distinct economic niche in high-volume hardware manufacturing. Consumer products routinely require motion tracking, barometric pressure monitoring, ambient light perception, and current sensing at unit prices beneath fifty cents. Meeting these target costs forces component manufacturers to rely on mature silicon manufacturing processes executed on 150 mm or 200 mm production lines.
When supply chain disruptions occur, device makers frequently attempt dual sourcing by selecting a secondary supplier that offers an equivalent package footprint and matching pin configuration. Beneath identical molded plastic enclosures, the micro-electromechanical systems die and integrated conditioning circuits often originate from completely different silicon manufacturing lines.
Subtle physical differences in micromachining alter fundamental transducer mechanics. In a piezoresistive pressure element, baseline full-scale voltage output scales with diaphragm thickness, piezoresistor doping depth, and residual mechanical stress introduced during chemical vapor deposition. A primary supplier might utilize an anisotropic wet etch process to construct a 12-micrometer silicon diaphragm, while a secondary supplier uses deep reactive-ion etching to achieve a 10-micrometer diaphragm with vertical sidewalls.
The thinner diaphragm increases mechanical compliance, shifting the native mechanical sensitivity of the secondary part 25 percent above the primary design specification. To match the datasheet nominal output span, the secondary supplier adjusts the gain setting inside their custom conditioning circuit. Because higher gain increases overall noise, the secondary part delivers a signal-to-noise penalty, elevating the voltage noise density from 40 nV/√Hz to 110 nV/√Hz under identical operating conditions.

Silicon Micromachining Variations in Secondary Foundries
Wafer fabrication foundries operating mature process nodes exhibit substantial variance in etch profiles, oxide layer thickness, and dopant distribution. Capacitive MEMS accelerometers show how physical dimensions govern electrical behavior: the rest capacitance of a differential comb-finger structure depends directly on overlap area, finger gap spacing, and cavity medium permittivity. Primary foundries maintain capacitive air gaps of 1.5 micrometers within a tolerance of plus or minus 0.05 micrometers.
Secondary foundries, running older stepper tools, achieve gap tolerances of only plus or minus 0.18 micrometers. A 0.1-micrometer reduction in air gap increases rest capacitance while shifting zero-g mechanical proof-mass stiffness.
Evaluating dual-sourced MEMS structures requires analyzing thermal expansion coefficients across substrate materials, as thermal stress gradients induce parasitic bending moments in asymmetric silicon structures. Secondary foundries using alternative glass frit bonding techniques to seal the cap wafer introduce distinct thermal expansion mismatches relative to primary vendors using eutectic gold-silicon bonding. During thermal transitions between minus 20 degrees Celsius and 70 degrees Celsius, mechanical package stress translates directly into a zero-g offset shift that the host application reads as physical motion.
The primary part may exhibit a zero-g temperature coefficient of 0.5 mg/°C, whereas the secondary part exhibits 2.2 mg/°C under identical mounting conditions.

Physical Transduction Discrepancies across Dual Sourced Dies
Transduction variations extend across optical, magnetic, and environmental sensing modalities. Hall-effect current sensors, widely deployed in low-tier power monitoring circuits, rely on thin-film compound semiconductor or silicon Hall elements to convert magnetic flux density into millivolt-level differential signals. Primary foundries utilize buried n-well active regions with active spinning-current offset cancellation circuitry.
Secondary suppliers, attempting to cut die area and design complexity, implement static planar Hall plates with basic resistor bridge balancing. The static architecture suffers from planar Hall effect cross-sensitivity, causing the output voltage to drift when perpendicular stray magnetic fields interact with mechanical packaging stress.
In surface-acoustic-wave and piezoresistive humidity elements, secondary wafer foundries frequently substitute polymer dielectric coatings to lower processing costs. The secondary polymer layer alters the sorption kinetic rate, extending the 63-percent response time from 4.2 seconds up to 14.8 seconds. The primary part settles quickly enough for real-time environmental control, while the secondary part introduces severe phase lag into host firmware loops.
The physical transducer is not a drop-in replacement, despite sharing an identical physical footprint, pinout arrangement, and nominal supply voltage requirement.
| Transduction Principle | Primary Foundry Process Metric | Secondary Foundry Process Metric | Physical Consequence | Delivered Signal-Chain Parameter |
|---|---|---|---|---|
| Piezoresistive Pressure | 12 µm DRIE Diaphragm, Boron Doped | 10 µm Wet Etch Diaphragm, Ion Implanted | Increased compliance, altered strain profile | Noise density shifts from 40 nV/√Hz to 110 nV/√Hz |
| Capacitive Acceleration | 1.5 µm Gap, Eutectic Au-Si Seal | 1.8 µm Gap, Glass Frit Seal | Shifted proof-mass stiffness, package stress | Offset tempco shifts from 0.5 mg/°C to 2.2 mg/°C |
| Planar Hall Current | Buried N-Well, Spinning Current AFE | Surface N-Well, Static Bridge Balancing | Planar Hall effect cross-sensitivity | Stray field offset error increases by 3.8 mT |
| Piezoresistive Relative Humidity | Thin Polyimide Film, High Porosity | Standard Polymer Deposition | Slower water vapor absorption kinetics | Response time (t63) extends from 4.2 s to 14.8 s |
Optical proximity sensors exhibit similar divergences when dual sourced across different foundry ecosystems. A primary vendor integrates a vertical-cavity surface-emitting laser with a synchronized single-photon avalanche diode array, maintaining narrow bandpass optical filtering centered at 940 nanometers. A secondary vendor, seeking lower production costs, pairs a standard 850-nanometer light-emitting diode with a generic PIN photodiode.
The broader spectral emission of the 850-nanometer LED increases cross-sensitivity to ambient sunlight by 18 decibels. Under outdoor illumination conditions exceeding 30,000 lux, the secondary optical assembly saturates completely, forcing the analog front end into clipping while the primary module continues reporting distance measurements. Offset drift variations can remain within broad datasheet catalog limits even while output shifts stem from altered silicon doping profiles rather than host assembly thermomechanical stress.


Discrepancy
The electronic architecture governing signal extraction introduces operational variances that rival physical silicon differences. Low-tier commercial sensors combine raw physical sensing elements with basic mixed-signal conditioning integrated circuits. These conditioning circuits convert small analog voltage changes into digital words transmitted over serial interfaces such as I2C or SPI.
Primary and secondary component suppliers rarely utilize identical conditioning die layouts. Vendor A may pair a proprietary low-noise continuous-time sigma-delta converter with a fourth-order digital decimation filter, while Vendor B uses a discrete switched-capacitor successive-approximation register converter coupled to a basic moving-average filter block.
Conversion mechanics alter the effective resolution delivered to host processors. Datasheets for both vendors may claim a 16-bit digital output format, but actual effective resolution depends entirely on low-frequency thermal noise, quantization distortion, and reference voltage stability. Secondary parts exhibit a 14 percent higher thermal offset drift.
The primary vendor achieves 13.8 effective bits at a 100 Hz sampling rate, whereas the secondary part achieves only 10.4 effective bits under identical bandwidth settings. The remaining 5.6 bits of the secondary part represent pure thermal and quantization noise, rendering low-amplitude physical signals undetectable without extensive external software filtering.

Readout Circuitry and Analog Front End Divergence
Internal reference voltage stability represents a hidden point of failure when dual sourcing low-cost sensing hardware. Low-tier sensors rely on internal bandgap reference circuits to establish absolute conversion scales. Primary vendors implement curvature-compensated bandgap references with factory trim options, maintaining output stability within 20 ppm/°C over ambient operating ranges.
Secondary suppliers eliminate trim cycles to accelerate test time and reduce landed wafer cost, resulting in bandgap drifts exceeding 110 ppm/°C. When ambient operating temperatures rise inside an industrial enclosure, the reference voltage inside the secondary sensor drops, causing artificial gain scaling errors across all reported physical values.
Matching sensor part numbers on a bill of materials guarantees mechanical footprint compatibility while leaving host control algorithms vulnerable to unannounced digital filter group delay shifts.
Power-supply rejection ratio characteristics diverge sharply between conditioning ASIC implementations. Primary sensor modules integrate internal low-dropout linear regulators to isolate internal high-gain amplifiers from external power rail ripple. Secondary modules frequently omit internal regulation, routing VDD directly to internal switched-capacitor networks.
When high-frequency ripple from a low-cost buck converter appears on the 3.3-volt power rail, the secondary sensor demodulates this switching noise directly into the baseband measurement spectrum. A 50-millivolt switching spike on the power supply rail can generate a 1.2 percent full-scale measurement anomaly in the secondary part, while the primary part suppresses the disturbance entirely due to its 65-decibel power-supply rejection ratio.

Internal DSP Group Delay and Filter Mismatches
Digital signal processing paths embedded inside low-tier sensors impose distinct temporal signatures on sensor data streams. When a host system requests sensor readings at a fixed sample rate, the returned data reflects internal filtering completed milliseconds prior. Primary suppliers often implement finite impulse response filters engineered for linear phase response and deterministic group delay.
Secondary suppliers frequently deploy infinite impulse response or cascaded integrator-comb filters to save digital gate count on low-cost silicon nodes. These non-linear phase filters introduce frequency-dependent delays across the measurement spectrum.
Compliance with moisture sensitivity standards governs reflow survival without mitigating zero-g thermal offset drift differences between silicon vendors.
Group delay discrepancies destabilize feedback control loops. Consider a low-cost IMU operating inside a robotic stabilization system. The primary sensor delivers 6-axis motion data with a fixed internal group delay of 2.1 milliseconds at a 200 Hz output data rate, and firmware control loops are tuned around this latency boundary.
The secondary sensor, operating under identical I2C register configuration commands, implements a low-pass decimation filter yielding an 11.4-millisecond group delay. This 9.3-millisecond phase delay erosion consumes the control loop phase margin, driving motor drives into mechanical oscillation under high-bandwidth stabilization maneuvers. The host processor receives valid I2C register packets without reporting hardware faults, but system control dynamics collapse.

Does Supply Voltage Ripple Induce Ratiometric Offset Drift?
Ratiometric output sensors scale their analog signal span directly against the applied supply voltage. In low-tier commercial current and pressure sensors, ratiometric operation eliminates the need for an internal reference voltage, shifting reference tracking duties to the host analog-to-digital converter. Dual sourcing exposes systems to mismatched ratiometric tracking limits.
Primary sensors achieve ratiometric tracking within plus or minus 0.1 percent of supply variation across a 2.7 to 3.6-volt operating range. Secondary sensors, utilizing simplified resistive divider networks, exhibit non-linear ratiometric tracking errors reaching plus or minus 1.4 percent when the supply voltage sags below 3.0 volts.
Register map alignment presents another trap for dual-source integration. While secondary suppliers market their parts as drop-in compatible replacements, register map implementation details often diverge under unexpected operating states. Register 0x1E might control the accelerometer full-scale measurement range on both parts.
Writing 0x02 to this register sets the primary part to a plus or minus 4g scale. On the secondary part, 0x02 configures a plus or minus 8g scale due to different internal bit-field mapping choices. Unannounced firmware register bit-shifts invalidate host device drivers, corrupting physical scaling factors without triggering communication bus error flags.
Unintended scale amplification forces control software to operate on miscalibrated sensor inputs, which ultimately leads to catastrophic control loop divergence during full-scale transient events.


Allocation
Semiconductor capacity allocation distorts component availability and often forces hardware manufacturers into emergency dual-sourcing transitions. Low-tier commercial sensors are exceptionally vulnerable to supply allocation shifts. Pure-play foundries assign wafer fabrication priority based on wafer ASPs, volume commitments, and long-term contract margins.
Low-cost sensors, yielding thousands of dies per wafer at low margins, are the first products deprioritized when high-margin automotive or smartphone IC demand surges. When primary suppliers declare lead-time extensions stretching from 12 weeks to 52 weeks, procurement organizations turn rapidly to secondary suppliers to preserve manufacturing line continuity.
Emergency sourcing during allocation exposes projects to severe technical risk. Primary suppliers maintain tight statistical process control over wafer runs, operating under established zero-defect quality systems. Secondary suppliers, brought in to fill volume shortfalls, often run older fabrication lines operating under relaxed parametric control boundaries.
When purchasing teams issue split orders to secure volume, production lines receive mixed lots of primary and secondary parts within the same manufacturing week. Surface-mount assembly lines attempt to place these parts using single software configuration profiles, unaware that the physical and electrical characteristics of the sensors on tape-and-reel feeders are shifting continuously.

Capacity Prioritization Mechanics in Low Tier Sensor Packaging
Packaging operations present a secondary supply allocation bottleneck. Sensors require specialized packaging to interact with the environment, including open-cavity plastic packages for optical and pressure sensors, or non-magnetic leadframes for Hall-effect elements. During allocation events, primary suppliers outsource assembly and testing to outsourced semiconductor assembly and test (OSAT) facilities operating in different geographical regions.
OSAT facilities vary in wire-bonding equipment precision, mold compound formulation, and final test thermal calibration capability.
Package stress shifts during OSAT transfers alter piezoresistive and capacitive sensor offsets. A primary supplier utilizing an epoxy mold compound with a thermal expansion coefficient of 11 ppm/°C produces consistent package stress on the enclosed die. If allocation forces production to a secondary OSAT facility using an alternative mold compound with a 17 ppm/°C thermal expansion coefficient, post-reflow package stress shifts baseline sensor offsets by up to 8 percent of full-scale output.
The sensor die itself remains unchanged, but the altered mechanical package mechanics corrupt factory calibration tables established for the primary product line.

Yield Exposure and Wafer Allocation Shifts
Foundry capacity reallocation frequently forces low-tier sensor vendors to migrate designs from 200 mm wafer lines to older 150 mm lines. Smaller wafer diameters suffer from higher edge-exclusion percentages, increasing thermal and mechanical stress variations across the wafer surface. Dies harvested from wafer edges exhibit higher parameter spread than dies harvested from central regions.
During allocation spikes, secondary vendors ship low-tier sensors containing higher proportions of edge-die silicon to meet volume targets, broadening the statistical distribution of zero-scale offsets and temperature coefficients across delivered reels.
- Thermal Coefficient Broadening occurs when secondary foundries ship edge-die silicon with uncontrolled doping gradients, widening the distribution of zero-scale drift from 50 ppm/°C up to 280 ppm/°C across single tape-and-reel shipments.
- Package Moisture Sensitivity Escalation develops when secondary OSAT facilities utilize non-qualified epoxy compounds, degrading moisture sensitivity levels from MSL-1 to MSL-3 and causing package delamination during standard lead-free reflow profiles.
- Register Logic State Inversion emerges during brownout events when secondary conditioning ASICs lack power-on reset supervisory circuits, leaving internal configuration registers in undefined states.
- Startup Latency Disparities corrupt power-managed battery systems when secondary sensors require 45 milliseconds to stabilize internal bias currents compared to 4 milliseconds for primary components.
Allocation management requires evaluating total landed supply risk against technical qualification depth. Purchasing low-cost sensors on spot markets without completing rigorous cross-qualification creates hidden liability. When secondary parts fail under field conditions due to unverified cross-sensitivity or thermal drift, line shutdown costs and field recall expenses quickly obliterate any savings achieved by maintaining production volume during a primary supplier allocation crisis.
| Integration Topology | Silicon Source Structure | Allocation Exposure Index | Qualification Burden | Primary Failure Mode Under Allocation |
|---|---|---|---|---|
| Discrete Bare Die + External AFE | Dual Foundries, Separate ASICs | High | Extensive (Signal chain re-characterization) | AFE noise mismatch, gain trim drift |
| Monolithic Integrated SoC | Dual Foundries, Single Die Process | Moderate | High (Firmware & register map verification) | Filter group delay shift, startup latency |
| Multi-Die System-in-Package | Primary MEMS, Secondary ASIC | Severe | Severe (Thermomechanical stress drift) | Mold compound stress shift, zero-g offset drift |
| Hybrid Module Assembly | Subcontracted OSAT Assembly | Low | Moderate (Connector & housing tolerance) | Substrate expansion, optical lens alignment shift |
| Methods Note: Allocation Exposure Index rates supply disruption probability against foundry node migration flexibility; ratings derived from high-volume commercial sensor supply chain audits. | ||||
Contractual agreements with secondary sensor suppliers must explicitly bound silicon process modifications. Standard commercial supply agreements allow vendors to modify fabrication processes or assembly locations provided the component meets basic datasheet limits. Broad datasheet parameters offer zero protection against group delay shifts, PSRR degradation, or thermal offset drift expansion.
Incorporating AEC-Q100 change notification thresholds into purchasing terms obligates suppliers to disclose wafer foundry transfers forty-five days prior to shipping production volume.


Screening
Bench validation of secondary sensors demands physical testing strategies engineered to surface hidden parameter discrepancies. Standard incoming inspection procedures verify pin continuity, I2C bus acknowledgement, and basic ambient functional output. These minimal checks fail to detect low-frequency noise elevation, thermal drift expansion, or filter latency shifts.
Evaluating secondary sensor candidates requires subjecting components to controlled environmental profiles, dynamic signal analysis, and power supply noise injection protocols designed to isolate transduction mechanics from surface-level register outputs.
Thermal chamber characterization represents the baseline requirement for secondary part screening. Sensors must be mounted on standard evaluation substrates matching host printed circuit board layer stackups and copper thermal dissipation areas. Grounding and decoupling networks must strictly replicate host circuit layouts to avoid introducing external electromagnetic bias.
The environmental chamber must ramp ambient temperatures across the full operating range at rates not exceeding 1 degree Celsius per minute. Fast thermal ramps induce internal thermal gradients that mask steady-state temperature coefficients while generating artificial thermomechanical stress hysteresis curves.

Thermal Chamber Characterization and Drift Extraction
Continuous data logging during slow thermal cycling enables the extraction of zero-input offset drift and sensitivity temperature coefficients. Accelerometers and gyroscopes must be mounted inside a static six-position tumble fixture within the chamber, isolating gravitational acceleration components across each orthogonal axis. Optical sensors require precision-calibrated gray-card targets positioned at fixed distances inside black-out chambers to prevent stray reflection interference.
Pressure sensors must interface to external deadweight testers or digital pressure calibrators via manifold pass-through ports, holding static pressure points while temperature ramps complete.
A thermal ramp rate of 1 °C per minute between -20 °C and +70 °C reveals zero-g offset drift disparities exceeding 12 mg across secondary sensor lots.
Evaluating Allan deviation allows test engineers to separate underlying white noise processes from low-frequency flicker noise and long-term bias instability. Operating secondary sensors inside zero-input isolation chambers for eight-hour test runs provides the raw time-series data required for Allan variance computations. Plotting Allan deviation against cluster integration time identifies the precise boundary where velocity random walk transitions into bias instability.
Secondary parts utilizing low-cost silicon processes routinely exhibit bias instability floors an order of magnitude higher than primary components, surfacing as baseline output drift over extended operational windows.

Incoming Lot Acceptance Protocol Design
Incoming lot acceptance screening requires a structured, repeatable laboratory procedure. The following process isolates performance variations before secondary sensor reels enter high-volume SMT production lines.
- Mount twenty sample units from each incoming lot onto dedicated characterization test fixtures using standard SAC305 lead-free reflow profiles.
- Bake assembled test fixtures at 85 degrees Celsius for four hours to relieve residual mechanical package stress introduced during SMT reflow.
- Install fixtures inside an environmental chamber and establish stable ambient conditions at 25 degrees Celsius for thirty minutes.
- Execute baseline bus communications verification, reading device identification registers and verifying internal self-test execution responses.
- Log zero-input sensor output data at maximum output data rate for sixty minutes to construct baseline Allan deviation plots and extract RMS noise floors.
- Ramp chamber ambient temperature down to minus 20 degrees Celsius at 1 degree Celsius per minute, logging sensor output registers continuously.
- Hold temperature at minus 20 degrees Celsius for two hours, recording steady-state offset and gain values across all channels.
- Ramp chamber temperature up to 70 degrees Celsius at 1 degree Celsius per minute, recording dynamic thermal drift profiles and hysteresis loop width.
- Inject a 100 mV peak-to-peak 10 kHz sinusoidal ripple onto the VDD power supply line and measure output spectrum degradation to evaluate real-world PSRR.
- Compare extracted parameters against the primary sensor reference baseline dossier and issue pass-fail lot disposition certificates.
Screening criteria must enforce strict parametric statistical process limits. Relying on broad catalog minimum and maximum specifications allows defective or sub-standard secondary lots to pass inspection, shifting the failure point into customer applications. Sampling plans must calculate process capability indices (Cpk) for zero-g offset, temperature drift, and noise spectral density.
A secondary sensor lot demonstrating a Cpk below 1.33 for thermal offset drift must be rejected, even if every individual sample unit technically falls within the loose absolute boundaries of the published datasheet catalog.
- Allan Variance Analysis extracts velocity random walk, bias instability, and rate random walk parameters to surface low-frequency flicker noise elevation in secondary silicon.
- Power Supply Ripple Injection quantifies analog front end power rejection across frequency bands, exposing missing on-chip LDO regulators.
- Six-Position Tumble Testing isolates orthogonal axis alignment errors and cross-axis sensitivity variations resulting from inaccurate die bonding.
- Dynamic Step-Response Measurement determines internal DSP filter group delay, preventing phase margin degradation in host motion control loops.
| Test Parameter | Test Condition & Standard | Primary Baseline Limit | Secondary Acceptance Limit | Failure Consequence |
|---|---|---|---|---|
| Zero-Input Noise Floor | 25 °C, BW = 100 Hz, Allan Variance | 45 µg/√Hz RMS | 65 µg/√Hz RMS | Elevated signal jitter, false threshold triggering |
| Thermal Offset Drift | -20 °C to 70 °C, 1 °C/min Ramp | ±0.8 mg/°C Max | ±1.5 mg/°C Max | Uncompensated thermal bias in host calculations |
| Power Supply Rejection | 100 mVpp Ripple @ 10 kHz | -58 dB Minimum | -42 dB Minimum | Power rail switching noise coupling into readings |
| Filter Group Delay | ODR = 200 Hz, Step Input Response | 2.1 ms ± 0.2 ms | 3.0 ms ± 0.5 ms | Control loop phase lag and mechanical oscillation |
| Thermal Stress Hysteresis | 3 Cycles -20 °C to 70 °C to 25 °C | 0.3% Full Scale | 0.8% Full Scale | Permanent zero-point offset shift after thermal cycles |
Establishing automated bench test stations inside incoming inspection laboratories ensures that parameter drift is caught before components reach placement machines. Manual spot-checking of sensor registers fails to catch low-frequency performance anomalies. Automated fixtures, equipped with precision power supplies, low-noise signal generators, and climate-controlled chambers, provide the quantitative data required to reject sub-standard sensor lots at the factory door.
Bench testing must precede line release because retrofitting software fixes for broken hardware physics adds permanent overhead to engineering teams.


Ledger
The financial ledger provides the final accounting of dual-sourcing decisions for low-tier commercial sensors. Purchase managers often focus exclusively on piece-part unit cost differences. Securing a secondary sensor for twenty-eight cents when the primary component costs thirty-four cents appears to yield a six-cent unit savings.
Across a production run of one million units, this purchase decision promises sixty thousand dollars in direct material cost reductions. This superficial calculation ignores the substantial hidden operational, engineering, and quality costs associated with integrating an imperfect second-source component.
Saving four cents on a secondary sensor die increases assembly line test time by six seconds when dual calibration tables are required.
Engineering overhead represents the first major cost center. Cross-qualifying a secondary sensor requires hundreds of hours of laboratory bench testing, environmental chamber characterization, and firmware adaptation. If host software must maintain dual driver stacks, branching logic, and custom calibration tables to accommodate register map differences and group delay variations, software development and regression testing costs escalate rapidly.
An engineering team spending two hundred hours at an fully burdened rate of one hundred twenty-five dollars per hour consumes twenty-five thousand dollars of the projected purchase savings before a single production unit rolls off the line.

Total Cost Modeling of Secondary Sensor Qualification
Manufacturing line impact adds further financial drag. When secondary sensors display wider zero-point offset distributions, factory calibration steps must be modified. If the primary sensor permitted single-point room-temperature offset trimming, but the secondary sensor’s thermal coefficient variability demands multi-point thermal calibration during end-of-line testing, assembly cycle times increase.
Adding six seconds of test time to a high-volume manufacturing line operating at fifty dollars per hour of station time adds over eight thousand dollars in direct labor and capital utilization costs per hundred thousand units produced.
Field failure liability represents the largest financial risk exposure. When secondary sensors suffer from unverified thermal hysteresis, poor power supply rejection, or accelerated bias instability, product return rates increase. A low-tier commercial sensor controlling battery management, environmental monitoring, or motor safety shut-off can trigger false system shutdowns or fail to detect out-of-spec operating states.
The cost of processing a single field return, including customer support, warranty logistics, root-cause failure analysis, and board replacement, averages seventy-five dollars per returned unit. A modest 0.5 percent increase in field failure rates across a one-million-unit product run generates thirty-seven thousand five hundred dollars in direct warranty losses, completely wiping out the remaining piece-part savings achieved during initial procurement.

Firmware Branching Costs and Maintenance Burden
Long-term software maintenance burden persists for the entire lifecycle of the product. Operating dual hardware revisions forces engineering teams to maintain split firmware repositories, run parallel automated continuous integration builds, and execute dual compliance test suites for every subsequent software release. This ongoing maintenance overhead diverts engineering resources away from new feature development, introducing continuous friction into product update cycles.
Qualification dossiers structure evaluation around physical transduction boundaries rather than high-level catalog summaries. Comprehensive cost modeling requires adding direct unit savings to secondary engineering overhead, manufacturing calibration penalties, firmware maintenance costs, and field warranty exposure. In many cases, dual sourcing low-tier sensors to save pennies creates negative net economic value, exposing the organization to significant operational risk for negligible financial gain.
How can procurement practices quantify hidden signal chain mismatches before supply allocation crises force emergency secondary part deployments?