Acceptance Sampling Methods for Microelectromechanical Inertial Measurement Units
Variable acceptance sampling under ISO 3951-1 verifies continuous MEMS IMU drift profiles while protecting production lines from latent silicon wafer defects.
Lot
Screening incoming shipments of microelectromechanical inertial measurement units requires rigorous statistical controls to keep out-of-spec accelerometers and gyroscopes off automated surface-mount lines. Verification is difficult because a unit can pass electrical continuity while carrying mechanical or bias flaws that surface only under dynamic load. Setting up lot acceptance sampling for six-degree-of-freedom inertial measurement units means separating gross structural failures from subtle parameter drift, balancing test overhead against the expense of soldering bad sensors into high-value navigation hardware.
Sampling divides into attribute and variable techniques. Attribute plans evaluate parts on a pass/fail basis against defined dimensional, mechanical, or functional limits. Governed by ISO 2859-1, these plans rely on standard acceptance quality limit tables that scale sample sizes with lot volume.
That structure suits checks on package integrity, solder sphere coplanarity, pin alignment, and basic power-on self-tests, alongside automated optical inspection of component trays to confirm markings and pin-one orientation against the bill of materials.
Sampling keeps inspection overhead manageable without waiving defect coverage.
Variable sampling tracks continuous distributions, measuring lot means and standard deviations against upper and lower specification limits. Governed by ISO 3951-1, these plans derive quality statistics from sample standard deviations or ranges. They yield substantially more statistical discrimination per part than attribute testing: running 35 units through a variable inspection plan gives the confidence of screening hundreds on a go/no-go basis.
That efficiency makes variable methods essential for analog drift parameters, including zero-g offset voltage, scale factor sensitivity, axis non-orthogonality, and thermal bias drift coefficients.
| Parameter Category | Primary Standard | Sample Size (Lot = 5,000) | Evaluation Metric | Consumer Risk (Beta = 0.10) |
|---|---|---|---|---|
| Package Dimensions and Marking | ISO 2859-1 Level II | 200 units | Non-conforming count (c = 0) | High for low lot defect rates |
| Power-On ASIC Response | ISO 2859-1 Level II | 200 units | Functional pass/fail count | Moderate for intermittent faults |
| Accelerometer Zero-G Offset | ISO 3951-1 Level II (s-method) | 35 units | Sample mean and standard deviation | Low for continuous distributions |
| Gyroscope In-Run Bias Stability | ISO 3951-1 Special Level S-4 | 15 units | Allan variance quality statistic (k-factor) | Low for calibrated sensor arrays |
| Methods Note: Acceptance Quality Limit set to 1.0 percent for variable parameters and 0.40 percent for attribute packaging defects under normal single sampling. | ||||
Inspection severity shifts based on supplier history, lot size, and dominant failure modes. General inspection level II provides the default baseline. If two out of five consecutive incoming lots fail initial acceptance criteria, testing shifts to tightened inspection ~ expanding the sample size or lowering the acceptable quality limit threshold to shield downstream lines from foundry excursions.
Conversely, moving to reduced inspection requires ten consecutive lots to clear normal screening without a single parameter deviation, trimming bench hours while preserving statistical control.
Mechanical stress directly distorts micromachined capacitive gaps.
Packaging and assembly introduce physical failure modes that variable sampling must catch. MEMS architectures rely on suspended single-crystal or polycrystalline silicon proof masses anchored by micro-machined flexures. Wafer dicing, die attach, pick-and-place handling, and transfer molding all impart mechanical stresses that shift flexure resonance.
Furthermore, cavity seal integrity remains vulnerable: micro-fractures in glass-frit or metallic wafer bonds during reflow allow dampening gas to vent. Losing internal cavity vacuum collapses the mechanical quality factor in vibrating ring gyroscopes, producing sharp phase shifts and noise spikes across the operating band.
- Comb drive stiction occurs when capillary moisture or residual electrostatic charge binds interdigitated comb fingers, freezing the capacitive proof mass.
- ASIC wire bond fatigue manifests as intermittent signal loss or shifted reference voltages during dynamic movement.
- Substrate thermal warping exerts localized strain across the encapsulated silicon die, distorting offset calibration curves over temperature.
- Cavity vacuum degradation alters the mechanical damping ratio, elevating gyro velocity random walk parameters beyond acceptable operational limits.
- Cross-axis structural misalignment arises from die attach tilt inside the ceramic package, introducing off-axis cross-sensitivity.
Under ISO 3951-1 Level II normal inspection, a lot of 5,000 MEMS IMUs requires a variable sample size of 35 units to confirm accelerometer scale factor linearity within 150 parts per million.
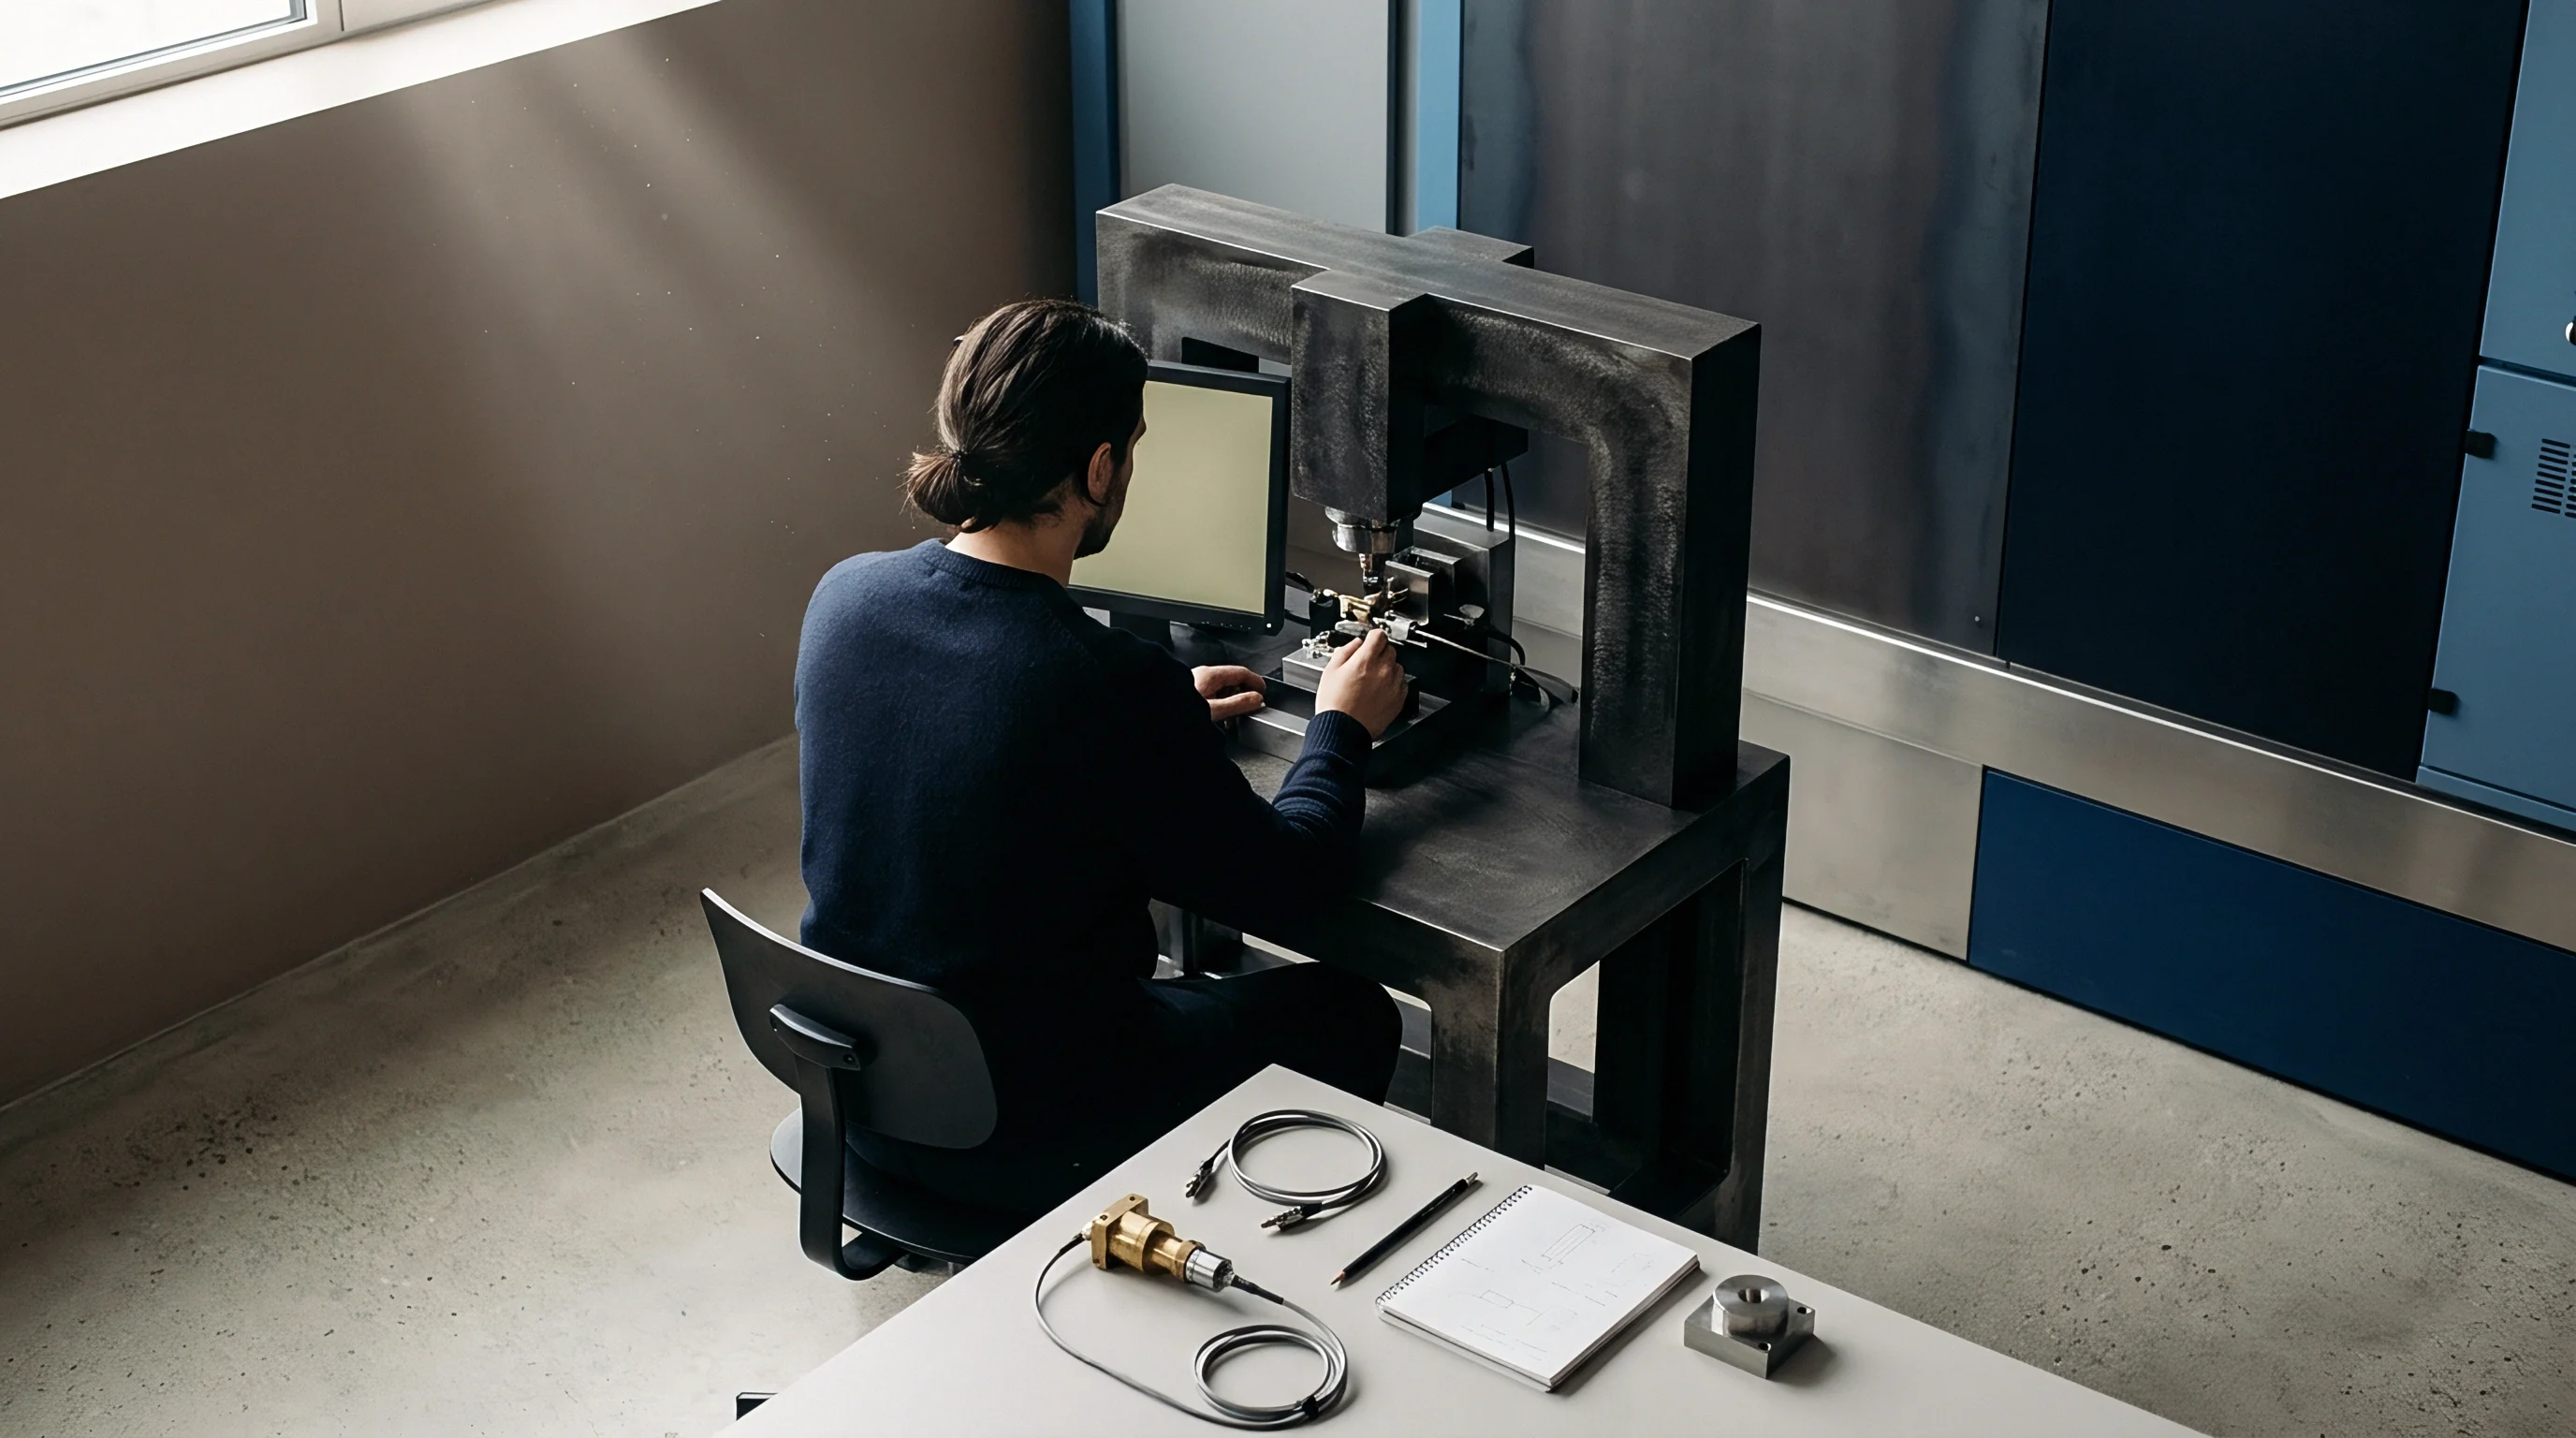
Running variable lot sampling requires dedicated test hardware built for rapid automated socketing. Fluctuations in socket contact resistance easily cause false rejections during zero-g bias measurements, so handlers must maintain Kelvin contacts and stable thermal conditions throughout screening runs. Incoming inspection screens sensor arrays on high-speed automated sorters before modules are mounted into client enclosures, since unstable power rails during socketing inject artificial low-frequency noise that skews sample standard deviation calculations.
Screening routines have to separate silicon defects from contact artifacts. Handlers enforce a thermal soak window of at least thirty seconds to clear package temperature gradients before data acquisition begins. Sockets undergo cleaning verification every five hundred insertions to hold pin contact resistance stable.
Meanwhile, statistical process tracking monitors sample standard deviation across incoming lots; creeping variance in nominally passing material warns of upstream wafer fab drift well before parts cross out-of-spec thresholds.
Out-of-spec zero-g offset drift typically stems from wafer-level stress relaxation rather than assembly-line solder reflow profiles.

Chamber
Environmental stress screening subjects micro-machined inertial sensors to controlled thermal and mechanical stress profiles, exposing latent wafer-level and packaging defects. Thermal profile testing forms the core of qualification for high-performance units. As silicon proof masses expand and contract across thermal swings, their geometry and flexure stiffness shift accordingly; single-crystal silicon carries a temperature coefficient of Young’s modulus around minus sixty parts per million per degree Celsius.
Without thermal screening, temperature-induced spring softening alters scale factors and pulls resonant frequencies away from nominal baselines.
Valid calibration requires complete thermal stabilization across the sensor core.
Screening protocols run sample devices through thermal sweeps from minus forty degrees Celsius to plus eighty-five degrees Celsius. Automated chambers control ramp rates between two degrees Celsius per minute and five degrees Celsius per minute to avoid thermal shock while exciting latent packaging stresses. Dynamic measurements taken throughout these sweeps quantify thermal bias hysteresis, where zero-g offset values deviate at identical temperatures depending on thermal direction.
Elevated hysteresis typically points to incomplete die-attach epoxy cure or coefficient of thermal expansion mismatches between the silicon die and ceramic package base.
| Environmental Test Parameter | Automotive Grade (AEC-Q103) | Industrial Grade (Standard) | Acceptance Criteria Limit |
|---|---|---|---|
| Thermal Cycling (-40°C to +125°C) | 500 cycles (5°C/min ramp) | 100 cycles (2°C/min ramp) | Zero-g bias shift < 5 mg |
| Random Vibration Soak | 10 Hz to 2,000 Hz, 5.35 g RMS | 20 Hz to 2,000 Hz, 3.10 g RMS | Scale factor shift < 200 ppm |
| Mechanical Acceleration Shock | 500 g, 0.5 ms half-sine (18 shocks) | 200 g, 1.0 ms half-sine (6 shocks) | No output structural axis inversion |
| High-Temperature Operating Life | 1,000 hours at +125°C | 168 hours at +85°C | In-run bias stability drift < 15% |
Vibration soak testing assesses structural integrity under dynamic operating loads. Electrodynamic shakers subject the packaged sensors to broadband random vibration from ten Hertz to two thousand Hertz. Mechanical energy transfers through the package into internal comb fingers and suspension flexures; whenever structural modes match the drive frequency of vibrating-structure gyroscopes, energy cross-couples into the sense axis to create phantom angular rate signals.
Broadband vibration profiles readily expose resonant modal overlap, die-attach micro-cracking, and wire bond displacement.
Readout ASIC noise sets the baseline resolution floor for the sensing package.
Mechanical shock testing evaluates survivability against severe transient impact. During high-g shock events, accelerometer proof masses endure significant dynamic deflection. Test routines apply half-sine shock pulses along positive and negative directions across each orthogonal axis.
Post-shock inspection confirms that integrated mechanical stops prevented capacitive finger interpenetration and that flexures settled back to equilibrium. Finger contact during shock pulses risks electrical shorting or permanent stiction, which immediate post-test zero-g offset checks must flag.
Thermal stabilization of silicon MEMS die inside ceramic packages takes longer than the electrical power-on transient of the readout ASIC.
High-temperature operating life screening accelerates latent silicon and interconnect failures through continuous electrical and thermal stress. Test groups run in burn-in ovens at maximum rated supply voltages and elevated temperatures. Differential laser interferometry tracks cross-axis thermal expansion across multi-layer substrate packages during these runs.
The burn-in environment accelerates ionic migration in ASIC gate oxides, charge trapping, and intermetallic growth at wire bond ball joints; comparing noise figures before and after exposure uncovers degradation long before functional failure.
Rate-table evaluations characterize scale factor linearity and axis alignment against precise angular velocity vectors. Single- and dual-axis motion tables rotate sample sensors at commanded rates up to one thousand degrees per second. Sweeps measure scale factor non-linearity ~ the divergence between sensor output and a true linear fit ~ while cross-axis checks measure unintended output on orthogonal axes during pure single-axis rotation.
High cross-axis sensitivity indicates physical die tilt during placement or asymmetric comb finger profiles left by deep reactive-ion etching.
External vibrational energy readily couples into internal structural resonances.
Pairing thermal sweeps with rate-table motion yields comprehensive dynamic acceptance screening. Multiaxis rate tables integrated inside environmental chambers evaluate IMU output across the full operating temperature range, isolating thermal scale factor drift coefficients and transient errors that static bench testing overlooks. Lots displaying non-linear thermal drift or irreproducible hysteresis fail variable acceptance criteria, preventing field calibration failures in downstream navigation hardware.
Silicon substrates exhibit known, measurable expansion curves under thermal stress.


Tolerance
Deriving acceptance thresholds for dynamic noise requires converting raw sensor output into time-series variance metrics across operational windows. Static testing fails to capture low-frequency random walk and in-run bias instability, the two dominant drivers of navigation drift. Variable sampling plans must therefore evaluate stochastic noise parameters extracted via Allan variance analysis, which demands collecting un-averaged high-rate stationary data over long runs in vibration-isolated, thermally stabilized enclosures.

How Does Allan Variance Impact Acceptance Limits?
Allan variance analysis separates distinct stochastic noise mechanisms by plotting Allan deviation against cluster integration times on logarithmic scales. The characteristic curve reveals noise regimes identified by their slopes: angle random walk appears at a slope of minus one-half (white noise generated by mechanical Brownian motion and readout preamplifiers), in-run bias stability settles into the flat local minimum at slope zero (flicker noise originating in active electronics and packaging stress), and rate random walk climbs at a slope of plus one-half (reflecting long-term environmental drift and structural aging).
In-run bias stability for the triaxial gyroscope array measured 0.42 degrees per hour over a 3600-second Allan variance window at 25 degrees Celsius after a 15-minute power thermal warm-up.
Acceptance limits define numerical boundaries for angle random walk and in-run bias stability extracted from Allan deviation curves. Screening these parameters via variable sampling follows the s-method outlined in ISO 3951-1: the upper quality statistic equals the upper specification limit minus the sample mean, divided by the sample standard deviation. This value must match or exceed the tabulated acceptance constant k for the designated sample size and acceptable quality limit; falling short of k triggers lot rejection even if no single unit exceeded catalog limits.
Calculating variable sampling acceptance bounds follows an eight-step numerical sequence:
- Mount sample units onto a vibration-isolated optical table within a temperature-controlled chamber stabilized at twenty-five degrees Celsius.
- Supply clean, regulated direct-current power to all test units and allow a fifteen-minute electrical and thermal warm-up period.
- Log stationary raw angular rate and acceleration data simultaneously from all sample channels at a minimum sample rate of one hundred Hertz for two continuous hours.
- Compute the overlapping Allan variance array for each sensor axis across cluster integration times ranging from ten milliseconds to one thousand seconds.
- Extract the in-run bias stability value from the minimum point of each computed Allan deviation curve.
- Calculate the sample mean value and sample standard deviation of the extracted in-run bias stability figures across all sample test units.
- Compute the upper quality statistic using the target maximum specification limit, sample mean, and sample standard deviation.
- Compare the resulting upper quality statistic against the required ISO 3951-1 k-factor constant to declare lot acceptance or rejection.
A practical calculation illustrates the procedure. Consider an incoming shipment of two thousand five hundred tactical-grade MEMS IMUs with an upper specification limit for gyroscope in-run bias stability set at zero point five zero degrees per hour. Under ISO 3951-1 General Inspection Level II normal single sampling, an acceptable quality limit of one point zero percent dictates a sample size of thirty-five units.
The test protocol captures stationary bias stability data across all thirty-five units under isolated baseline conditions.
Data reduction yields a sample mean of zero point three eight degrees per hour with a sample standard deviation of zero point zero four five degrees per hour. Subtracting zero point three eight from zero point five zero and dividing by zero point zero four five gives an upper quality statistic of two point six seven. For a sample size of thirty-five at an acceptable quality limit of one point zero percent, ISO 3951-1 tables require an acceptance constant k of one point nine eight.
Because two point six seven exceeds one point nine eight, the lot clears acceptance for production release. Thermal ramp rates of two degrees per minute induce an empirical shift of 0.12 degrees per hour in gyroscope bias instability.
Unfiltered stochastic noise compounds rapidly into position tracking error.
Operating characteristic curves map out the statistical discrimination of a sampling plan by plotting acceptance probability against incoming defect rates. Producer risk (alpha), the probability of rejecting a conforming lot at the acceptable quality limit, is typically capped at five percent. Consumer risk (beta), the probability of passing a non-conforming lot at the rejectable quality level, is held at ten percent for safety-critical parameters.
Constructing operating characteristic curves for variable plans confirms that a thirty-five-unit sample yields steep discrimination, intercepting borderline sensor lots before surface mounting.
Static room-temperature testing consistently conceals dynamic thermal drift.
Whether 100-hour HTOL sample data can reliably predict low-frequency flicker noise degradation in sub-micron ASIC CMOS processes remains an open challenge in high-reliability qualification.

Quarantine
Physical and logical isolation protocols safeguard automated assembly lines against unverified sensor lots during screening. Receiving procedures transfer incoming shipments into secure quarantine before technical sign-off, while enterprise inventory software flags reel barcodes as restricted stock to prevent pick-and-place loaders from scanning unreleased serial numbers. Enclosed quarantine cages keep these lots physically segregated from active inventory, eliminating floor mix-ups during kit staging.
| Defect Classification | Root Cause Mechanism | Lot Disposition Action | Financial Cost Absorbed | Line Impact Delay |
|---|---|---|---|---|
| Out-of-Spec Zero-G Offset | Wafer-level residual stress shift | Full lot quarantine and return | Supplier absorbs freight and test cost | 3 to 5 business days |
| Excessive Bias Thermal Hysteresis | Die-attach epoxy micro-voids | 100% screening of lot volume | Buyer charges re-test fees to vendor | 1 to 2 business days |
| Packaging Solder Sphere Oxidization | Storage humidity control failure | Rework or reel replacement | Supplier replaces damaged reels | 5 to 10 business days |
| Gyroscope Allan Variance Spike | ASIC phase-locked loop jitter | Lot rejection and foundry escalation | Supplier covers assembly line downtime | 15 to 30 business days |
Whenever variable sampling exposes out-of-spec drift, quality control issues a formal non-conformance report. The material review board reviews the statistical distribution to isolate root causes; if non-conformance stems from upstream wafer fab shifts or packaging flaws, the lot faces outright rejection. Standard return material authorization terms require suppliers to provide disposition instructions within forty-eight hours, while quarantine rules dictate that rejected inventory remain boxed, labeled, and segregated to preclude inadvertent release.
Quarantine protocols isolate unverified sensor lots before automated surface-mount assembly spreads component defects across printed circuit board subassemblies.
Master quality agreements establish financial liabilities and corrective action paths for non-conforming shipments. Contracts define acceptable quality limit thresholds, test protocols, and escalation timelines, holding vendors financially responsible for freight, destructive test expenses, and screening labor incurred by failed lots. These frameworks also mandate formal Eight-Discipline (8D) root-cause reports within fourteen business days of initial notification.
- Verification of serial range locks ensures software systems block unreleased component reels from production job scheduling.
- Physical cage access control limits component access to authorized quality assurance personnel during sampling workflows.
- Environmental tag logging verifies that ambient temperature and humidity levels stayed within specification during transit storage.
- Re-inspection trigger thresholds mandate re-evaluating lots if quarantine storage duration exceeds six months prior to assembly.
- Supplier corrective action verification requires confirming root-cause fixes before lifting quarantine flags on replacement shipments.
Releasing unverified inventory onto automated lines risks severe finished-board yield losses.
Second-sourcing reduces supply chain exposure when incoming lots fail inspection. Qualifying alternate MEMS vendors requires matching electrical pinouts, communication protocols, and package footprints, allowing production lines to drop alternate parts onto standard board layouts without redesigns. Master supply agreements specify zero-acceptance sampling for critical zero-g offset parameters; alternate suppliers must maintain equivalent variable sampling profiles to guarantee drop-in performance.
Quarantine protocols isolate suspect lots until statistical clearance is formally signed off.
Supplier audits verify that fabrication and packaging facilities maintain rigorous statistical process controls. Audit teams review photolithography cleanrooms, die-attach tolerances, ceramic lid sealing, and factory calibration stations. Routine supplier verification ensures certificates of analysis reflect dependable factory data, requiring vendor process capability to meet a minimum Cpk of one point six seven on critical zero-g offset and scale factor metrics to guarantee stable lot-to-lot distributions.
Sample sizes scale dynamically with historical vendor risk.
Under Section 8.4 of the Master Quality Agreement, any lot failing variable sampling criteria triggers immediate, supplier-funded third-party failure analysis and revokes dock-to-stock privileges for subsequent shipments.
Variable Sampling Verification Protocols For High Rate MEMS Gyroscope Lots
Long Term Wafer Level Stress Relaxation Effects On Tactical Grade Gyroscope Drift Thresholds