Variable Sampling Verification Protocols for High Rate MEMS Gyroscope Lots
Variable sampling verification for high-rate MEMS gyroscopes optimizes lot acceptance by deriving continuous quality indices from dynamic rate table test samples.


Motion
When angular velocity exceeds 2,000 degrees per second, MEMS comb structures hit physical limits where linear velocity assumptions break down. In capacitive vibratory ring or tuning-fork gyroscopes, Coriolis forces drive the secondary proof mass mode perpendicular to primary excitation, producing acceleration equal to twice the cross product of drive velocity and applied rate. As input rates climb toward 10,000 or 20,000 degrees per second, sense-mass displacement turns into a significant fraction of the capacitive sense gap itself.
This geometric distortion shifts baseline sense capacitance, introducing non-linear scale-factor errors that low-rate calibration models fail to catch. Verifying incoming lots for these operating ranges requires test strategies capable of separating mechanical distortion at the micro-scale from downstream ASIC saturation.
At high rates, drive-mode vibrational amplitude must be strictly controlled to prevent cross-axis deflection from coupling into sense channels. Larger deflection amplitudes expose quad comb fingers to varying electrostatic forces. When high bias voltages coincide with reduced finger spacing, electrostatic spring softening pulls down the sense mode’s resonant frequency under heavy rotation.
If that frequency shifts toward the drive resonance, the mechanical amplification factor changes dynamically during sharp maneuvers, altering both open-loop response and transducer phase delay. Static or low-rate testing completely misses these dynamic resonance shifts.
Extreme input rates also magnify quadrature errors originating from minor etch asymmetries in the silicon substrate. Quadrature forces act in phase with proof-mass displacement rather than velocity. Demodulation circuits handle this distinction easily under moderate loads, but extreme rotation rates demand wider dynamic range from the front-end transimpedance amplifier.
Large quadrature signals consume amplifier headroom, driving the input stage toward saturation long before the Coriolis signal reaches full scale. This headroom loss degrades effective gain, resulting in scale-factor non-linearities that vary from lot to lot depending on etch wall verticality.
Combining mechanical shock with rapid rotation introduces additional failure mechanisms in high-rate MEMS structures. Comb fingers undergo pull-in instability whenever combined inertial and electrostatic forces overpower the restoring force of silicon suspension beams. Modern sensors use mechanical stops coated with dielectric or anti-stiction layers to prevent permanent electrical shorts.
Under repeated high-rate cycling, however, impacts wear away this surface passivation, causing random bias shifts or total latch-up. Screening protocols need to isolate lot-level stiction and beam yield risks before parts go to assembly.

Transduction Physical Boundaries under Extreme Velocity
Capacitive micro-gyroscopes measure rate through differential capacitance changes between fixed fingers and a movable mass. As long as deflection remains small relative to nominal air gap, capacitance tracks displacement linearly. Under severe angular rates, non-linear gap changes require higher-order terms in the displacement model.
A Taylor series expansion of differential capacitance demonstrates how higher-order displacement terms introduce second- and third-order rate components to output current, triggering scale-factor errors that climb rapidly past 5,000 degrees per second.
Piezoresistive and piezoelectric MEMS gyroscopes avoid gap-closure non-linearities entirely. Piezoresistive elements directly measure suspension stress, providing broad dynamic range and immunity to comb pull-in. They do, however, bring higher thermal noise floors and significant temperature-driven bias drift, requiring specialized thermal compensation on the ASIC.
Piezoelectric thin films, such as lead zirconate titanate or aluminum nitride, generate charge without high electrostatic bias voltages. Their primary drawback is stress-induced polarization fatigue during sustained high-g rotation, appearing as lot-to-lot scale-factor instability over time.
Drive-mode stability sets the baseline noise floor across all vibratory gyroscopes. Closed-loop automatic gain control (AGC) circuits maintain constant drive amplitude by sensing proof-mass motion and adjusting excitation voltage. When rotation rates approach the drive loop frequency, cross-axis coupling distorts feedback signals.
An AGC loop that responds too slowly allows drive amplitude to wander during fast acceleration transients, modulating Coriolis sensitivity. Conversely, an overly aggressive loop elevates phase noise and bleeds parasitic energy into the sense spectrum. Verification must evaluate closed-loop drive behavior during sharp rate ramps to catch hidden control instabilities.
The scale factor non-linearity of capacitive high-rate MEMS gyroscopes expands from 0.05 percent at 1,000 degrees per second to 1.82 percent at 15,000 degrees per second under continuous high-g sweep conditions.
Heat generated inside the MEMS cavity creates localized temperature gradients that shift mechanical resonance. Operating continuously at high angular rates requires elevated drive voltages, increasing ohmic losses across silicon suspension springs and traces. Because silicon’s Young’s modulus changes by roughly minus 30 parts per million per degree Celsius, local heating shifts both drive and sense resonant frequencies.
In hermetic vacuum packages, heat dissipates primarily through package leads rather than gas conduction. Consequently, voiding variations in die-attach epoxy across a production lot alter thermal paths, causing die-to-die scatter in thermal settling times and scale-factor drift.
Gas damping within the cavity establishes quality factors for drive and sense resonances. Sub-Pascal pressures keep mechanical damping minimal, pushing up Q values to boost signal amplitude. However, high quality factors narrow mechanical bandwidth, leaving sensors vulnerable to drive frequency mismatches.
If adhesive outgassing increases internal cavity pressure over time, Q drops and shifts the transfer function. Verification protocols should check vacuum integrity to flag lots showing elevated mechanical damping prior to environmental testing.

Comb Architecture Deflections under Centripetal Load
Rotation induces centripetal force along the radial axis connecting the center of rotation to the MEMS proof mass. Sitting off-axis exposes suspension flexures to radial acceleration that stretches or compresses beams along that vector. Radial deformation shifts baseline sense comb positions, changing effective gap spacing independent of Coriolis forces.
This displacement introduces a rate-squared error term that skews calibration matrices if mounting radii are not precisely centered on the rate table during lot acceptance.
Angular acceleration along the sense axis generates direct rotational inertial forces on the proof-mass frame. Vibratory gyroscopes typically reject angular acceleration by using balanced, anti-phase dual proof masses. In a balanced design, angular acceleration moves both masses in unison ~ canceling out in differential processing ~ while Coriolis forces move them in opposition.
Etch variations across a wafer create mass imbalances that break this symmetry, leaving individual sensors susceptible to angular acceleration during harsh maneuvers.
Multi-axis motion introduces cross-axis rate sensitivity. High angular rates on an unmeasured perpendicular axis produce secondary Coriolis forces that couple into the primary sense channel through suspension flexures. The magnitude of this crosstalk depends heavily on off-axis beam stiffness.
Wafer etch undercuts can distort flexure cross-sections from rectangles into trapezoids, weakening vertical stiffness. Inspection routines should evaluate off-axis sensitivity across sample lots to ensure crosstalk remains within error budgets.
Under combined loads, structural compliance in comb fingers can cause dynamic comb tilt. As fingers tilt out of plane relative to the substrate, overlap area shrinks while fringing fields expand unpredictably. This distortion generates non-linear capacitance responses that standard polynomial calibration models cannot correct.
Advanced testing uses stepped rate profiles and dynamic frequency response mapping to isolate comb tilt from basic gain errors.
Mechanical Interlocking and Suspension Stress Degradation Modes
Silicon suspension flexures undergo severe cyclic stress at high rotation rates. While single-crystal silicon exhibits minimal fatigue under low loads, micro-cracks along etched crystal planes can propagate under high stress amplitudes. Rapid rotation produces peak bending moments at beam roots where stress concentration is highest.
Sidewall etch roughness creates local stress risers that lower fracture thresholds. Mapping tensile stress concentrations helps flag structural weaknesses at the lot level before components enter critical assemblies.
An unordered set of physical failure modes observed in high-rate MEMS gyroscopes under combined angular velocity and shock includes:
- Structural Beam Micro-Fracture initiating at etched sidewall notches under peak bending moments during sharp maneuvers.
- Comb Finger Electrostatic Pull-In caused by gap reduction from transient shock paired with high bias voltages.
- Die Attach Delamination driven by thermal expansion mismatches and centripetal shear across package interfaces.
- Dielectric Surface Charge Trapping on mechanical stop coatings, leading to persistent bias shifts after physical contact.
- Hermeticity Loss via Package Seal Fatigue under cyclic thermal expansion combined with high-frequency vibration.
- Wire Bond Resonance Displacement causing shorts or tail fractures under multi-axis rotational acceleration.
Package-induced stress alters internal strain within the silicon die, shifting resonant frequencies after packaging. Epoxy die-attach materials absorb moisture and shift with temperature, imparting uneven shear stress to the die. Ceramic leadless chip carriers provide superior dimensional stability compared to plastic overmolded options, but thermal expansion mismatches between ceramic substrates and circuit boards still transmit strain.
Inspection protocols should track package stress effects by comparing baseline bias distributions before and after stress exposure across sample lots.
Wafer-level packaging seals silicon cavities with eutectic or glass-frit rings to maintain vacuum levels over time. Defects in this seal permit gradual atmospheric ingress, degrading mechanical Q. Because increased damping requires higher drive energy to maintain oscillation amplitude, cavity pressure can be monitored indirectly through drive voltage demands. Checking drive voltage distributions across sample lots offers a reliable view of seal integrity without destructive gas analysis.
The table below summarizes performance boundary differences across primary MEMS transduction structures when operated under high rate conditions exceeding 5,000 degrees per second.
| Transduction Principle | Maximum Dynamic Range (deg/s) | Scale Factor Non-Linearity (%) | Quadrature Sensitivity | Dominant Failure Mode |
|---|---|---|---|---|
| Capacitive Surface Micromachined | 10,000 | 0.50 to 2.00 | High | Comb Finger Electrostatic Pull-In |
| Capacitive Bulk Micromachined | 25,000 | 0.10 to 0.45 | Moderate | Suspension Beam Root Fracture |
| Piezoresistive Single-Crystal Silicon | 50,000 | 0.05 to 0.20 | Very Low | Thermal Bias Drift and Noise Floor Injection |
| Piezoelectric Thin-Film AlN | 40,000 | 0.08 to 0.30 | Low | Polarization Degradation under Cyclic Stress |
Structural isolation frames decouple internal vibratory elements from package flexure, shielding sensor cores from external vibration. Dual-stage designs use secondary spring-mass networks to filter high-frequency acoustic and structural noise. If an isolation frame’s natural frequency coincides with platform vibration harmonics, amplified resonance can saturate sense channels.
Testing protocols should include broad-spectrum random vibration to verify isolation frames do not couple cross-axis motion into primary signals.
Evaluating these mechanical interactions requires test hardware that provides smooth rotation without motor ripple. High-precision rate tables driven by direct-drive brushless motors and optical encoders supply the motion stability needed to distinguish sensor non-linearity from bench artifacts. Speed fluctuations on a rate table appear as false bias instability, masking actual component performance.
Calibration logs must accompany every verification dataset to confirm measured errors originate from the device rather than the motor drive.
Elevated non-linearity at 12,000 degrees per second can stem from test fixture compliance rather than internal comb deformation.
Sampling
Continuous analog signals from MEMS sense-mass deflections require low-noise processing to preserve angular velocity accuracy. Modern high-rate gyroscopes integrate transimpedance amplifiers, anti-aliasing filters, high-resolution sigma-delta ADCs, and digital signal processors onto a single ASIC. Architectural choices in the conversion stage establish strict boundaries on bandwidth, phase delay, and transient response speed.
Verification programs must evaluate the complete signal chain rather than relying on static register reads or slow serial logs.
Sigma-delta converters rely on oversampling and noise shaping to push quantization noise out of the passband into higher frequencies. Because high-rate applications span wide dynamic ranges, converters require 16- to 24-bit resolution to capture sub-degree-per-second motion alongside full-scale rotation. Oversampling ratios must balance clock speeds against power constraints; if set too low, high-frequency quantization noise folds back into the signal band, elevating the noise floor and degrading angle random walk.
Digital decimation filters follow the sigma-delta modulator, removing out-of-band noise and downsampling data to match host interface rates. Cascaded Integrator-Comb (CIC) filters are widely used because they operate efficiently without hardware multipliers. However, CIC filters exhibit a sinc-shaped frequency response that causes passband droop and non-linear phase distortion near cutoff.
While compensation FIR filters flatten passband gain, these added stages introduce group lag ~ a significant issue for high-speed flight control loops operating under tight timing margins.
Demodulating sense signals requires precise phase alignment with the drive oscillator. Phase-locked loops (PLLs) generate the synchronous clock directly from the drive sense channel. Jitter in this clock transforms quadrature error into baseband bias shifts.
During sharp acceleration, tracking loops can lag, shifting demodulation phase by fractions of a degree. At extreme rotation rates where quadrature signals are large, even a 0.1-degree phase error produces measurable zero-rate offset. Verification routines must evaluate PLL tracking performance during rapid rate steps.
Analog-to-Digital Conversion and Oversampling Trade-Offs
Front-end transimpedance amplifiers convert picoampere-level comb currents into usable voltages. The feedback resistor establishes gain while adding Johnson noise to the signal chain. Accommodating dynamic ranges up to 20,000 degrees per second requires smaller feedback resistor values to prevent clipping, which increases input-referred current noise.
This tradeoff forces high-rate gyroscopes to operate with higher angle random walk than lower-rate counterparts.
Switched-capacitor front ends provide tight capacitor ratio matching, keeping thermal gain drift low. They do, however, inject charge and clock feedthrough artifacts at the switching frequency. When this switching clock interacts with drive resonances or harmonics, intermodulation distortion creates phantom rate signals in the baseband.
Verification routines need to sweep input frequencies across operational bandwidths to identify localized intermodulation spikes missed by static tests.
Truncation occurs when DSP blocks truncate values during fixed-point arithmetic. Rapid rate transients can overflow internal accumulator registers before scale factors are applied. Fixed-point rounding schemes need to minimize bit truncation to prevent artificial bias shifts.
Qualification reviews should confirm that internal bit widths preserve adequate headroom across the entire operating temperature range.
Digital decimation filters with steep out-of-band attenuation characteristics introduce up to 4.2 milliseconds of deterministic group lag at a 1 kHz output sample rate.
Clock stability across temperature determines sample timing and filter cutoff accuracy. On-chip relaxation or RC oscillators can drift several percent over temperature unless actively compensated in software. A shift in master clock frequency alters anti-aliasing corner frequencies and scales output gains.
Acceptance protocols should monitor serial clocks or frame sync pulses during thermal sweeps to verify timing stays within tolerance.
Output registers update at rates defined by internal decimation, while host controllers pull data over SPI or I2C buses. Asynchronous register reads introduce sample jitter by varying inter-sample interval timing. SPI clock rates up to 20 MHz minimize transfer latency, but unoptimized interrupt handling on host microcontrollers can cause frame drops or duplicate reads.
Verification should exercise interfaces at full bus utilization to confirm register locking remains stable during high-speed burst transfers.

Filter Group Lag and Frequency Domain Distortion
Analog anti-aliasing filters attenuate high-frequency mechanical vibration before signals reach the ADC, preventing baseband aliasing. Second- or fourth-order active Butterworth filters provide flat passband response but introduce frequency-dependent group lag. Bessel filters offer linear phase and constant group lag ~ preserving transient pulse shapes ~ at the cost of a shallower stopband roll-off.
Choosing an architecture requires balancing anti-aliasing rejection against control-loop latency.
DSP-based Butterworth low-pass filters allow configurable bandwidth via software registers. Lowering the cutoff frequency reduces output noise and yields exceptionally clean baseline data on static test benches. However, heavy digital filtering masks mechanical resonance problems and adds phase lag that compromises dynamic stability.
Testing protocols should evaluate components at maximum bandwidth settings to reveal underlying performance without digital smoothing.
The table below provides a performance mapping of common internal digital filter configurations, detailing output sample rates, group lag values, and noise floors for high-rate MEMS gyroscopes.
| Filter Topology | Cutoff Frequency (Hz) | Output Rate (Hz) | Group Lag (ms) | Noise Density (deg/s/rt-Hz) |
|---|---|---|---|---|
| Raw Unfiltered (CIC Only) | 2,000 | 10,000 | 0.12 | 0.085 |
| 1st Order IIR Low-Pass | 500 | 2,000 | 0.45 | 0.042 |
| 4th Order FIR Linear Phase | 200 | 1,000 | 2.85 | 0.018 |
| Comb Compensation FIR | 1,000 | 4,000 | 0.68 | 0.035 |
Primary drive resonances typically fall between 15 kHz and 45 kHz. If external vibration enters the package near these frequencies, physical aliasing occurs within the mechanical structure itself. This mechanical intermodulation produces baseband error signals that bypass electronic filters completely.
Screening lots for mechanical aliasing immunity requires high-frequency vibration sweeps to confirm drive structures remain isolated from external excitation.
Phase delay mismatches between axes distort orientation estimates in multi-axis IMUs. A group lag mismatch as small as 0.5 milliseconds between roll and pitch channels generates false yaw outputs during rapid rotation. Multi-channel ASICs require tightly matched filter chains across all paths, and qualification protocols should verify cross-channel phase alignment on rate tables to confirm timing synchronization.

Digital Verification Testing Sequence
Verifying signal conversion fidelity across a lot requires a structured sequence of electrical and dynamic tests. Protocols must measure static baseline noise along with dynamic tracking performance across full rate ranges. Power supply rails must remain clean, keeping ripple below 2 millivolts peak-to-peak to prevent supply noise from corrupting front-end transimpedance stages.
Executing digital signal verification on high-rate gyroscope lots follows a standardized sequence:
- Initialize device communication registers over high-speed SPI at maximum supported clock rate and verify internal memory checksum bytes.
- Configure internal processing registers to maximum bandwidth and raw output mode, bypassing optional secondary smoothing filters.
- Record static zero-rate output data for 300 seconds at ambient room temperature to construct baseline Allan variance curves.
- Apply positive and negative full-scale angular velocity steps using a direct-drive rate table, measuring step response time to 99 percent final value.
- Sweep angular rate excitation frequencies from 1 Hz to 500 Hz while monitoring output phase lag relative to rate table encoder reference signals.
- Execute high-frequency vibration injection at drive mode resonant frequencies to evaluate mechanical aliasing suppression ratios.
- Extract noise spectral density profiles across the continuous bandwidth to confirm absence of discrete spurs or power line harmonics.
Signal evaluation uses Allan variance analysis to isolate individual noise mechanisms. Angle random walk (the minus one-half slope on an Allan deviation plot) measures broadband white noise from front-end electronics. Bias instability (the zero-slope region) isolates low-frequency flicker noise in amplifiers and reference voltages.
Rate random walk (the positive one-half slope) reflects long-term thermal drift and structural degradation. Calculating these parameters across sample lots establishes quantitative thresholds for lot acceptance.
Frame corruption during high-g transients usually stems from power distribution weaknesses inside the ASIC die. High acceleration currents can drop local supply voltages below low-dropout regulator thresholds, triggering momentary resets or bit flips in configuration registers. Monitoring register readbacks during rate sweeps helps detect micro-reset events that cause single-frame drops or zero-value spikes.
High-bandwidth signal chains depend on stable master clock synchronization across thermal gradients.
Clamp
Test fixtures for high-rate gyroscopes must transmit rotational motion from the spindle to the sensor package without introducing flexure, play, or structural damping. At speeds up to 20,000 degrees per second, centripetal forces generate substantial radial stress on brackets, clamps, and sockets. Interface compliance or micro-slippage introduces non-linear rate errors, hysteresis, and parasitic vibration into test data.
Rigid, low-mass fixtures are essential for clean acceptance testing.
Socket contacts in automated test stations are a frequent source of test errors. Pogo pins and conductive elastomer sockets develop variable contact resistance under vibration and acceleration. Resistance fluctuations modulate supply currents and disrupt high-speed digital signals, leading to false lot rejections driven by fixture wear rather than component defects.
Test sockets should use gold-plated spring contacts with calibrated force profiles and continuous contact resistance monitoring.
Adapter damping properties change with temperature, altering mechanical transfer functions during environmental sweeps. Aluminum fixtures provide lightweight stiffness, but their thermal expansion coefficient significantly exceeds that of steel or Invar. Running thermal sweeps during rate testing creates differential expansion across the sensor package, circuit board, and fixture, generating mechanical strain that shifts zero-rate bias.
Fixtures require strain-relief mounting features to isolate packages from thermal expansion stress.
Dynamic balancing becomes critical at rotation speeds above 30 revolutions per second (10,800 degrees per second). Mass imbalance generates vibration that scales with the square of angular velocity, driving the device under test toward saturation and causing artificial bias shifts. Test fixtures must undergo precision dynamic balancing before running lot acceptance routines.
Mounting Mechanics and Fixture Dynamics
Structural natural frequencies of the complete fixture assembly must sit well above operational frequencies of interest. If a fixture exhibits resonance near 1.2 kHz, platform vibration or motor ripple at that frequency is amplified by the fixture’s quality factor. This parasitic motion can saturate the sensor, corrupting scale factor and alignment measurements.
Modal testing via impact testing or laser Doppler vibrometry should confirm that fixture modes remain above 3 kHz to ensure flat frequency transmission.
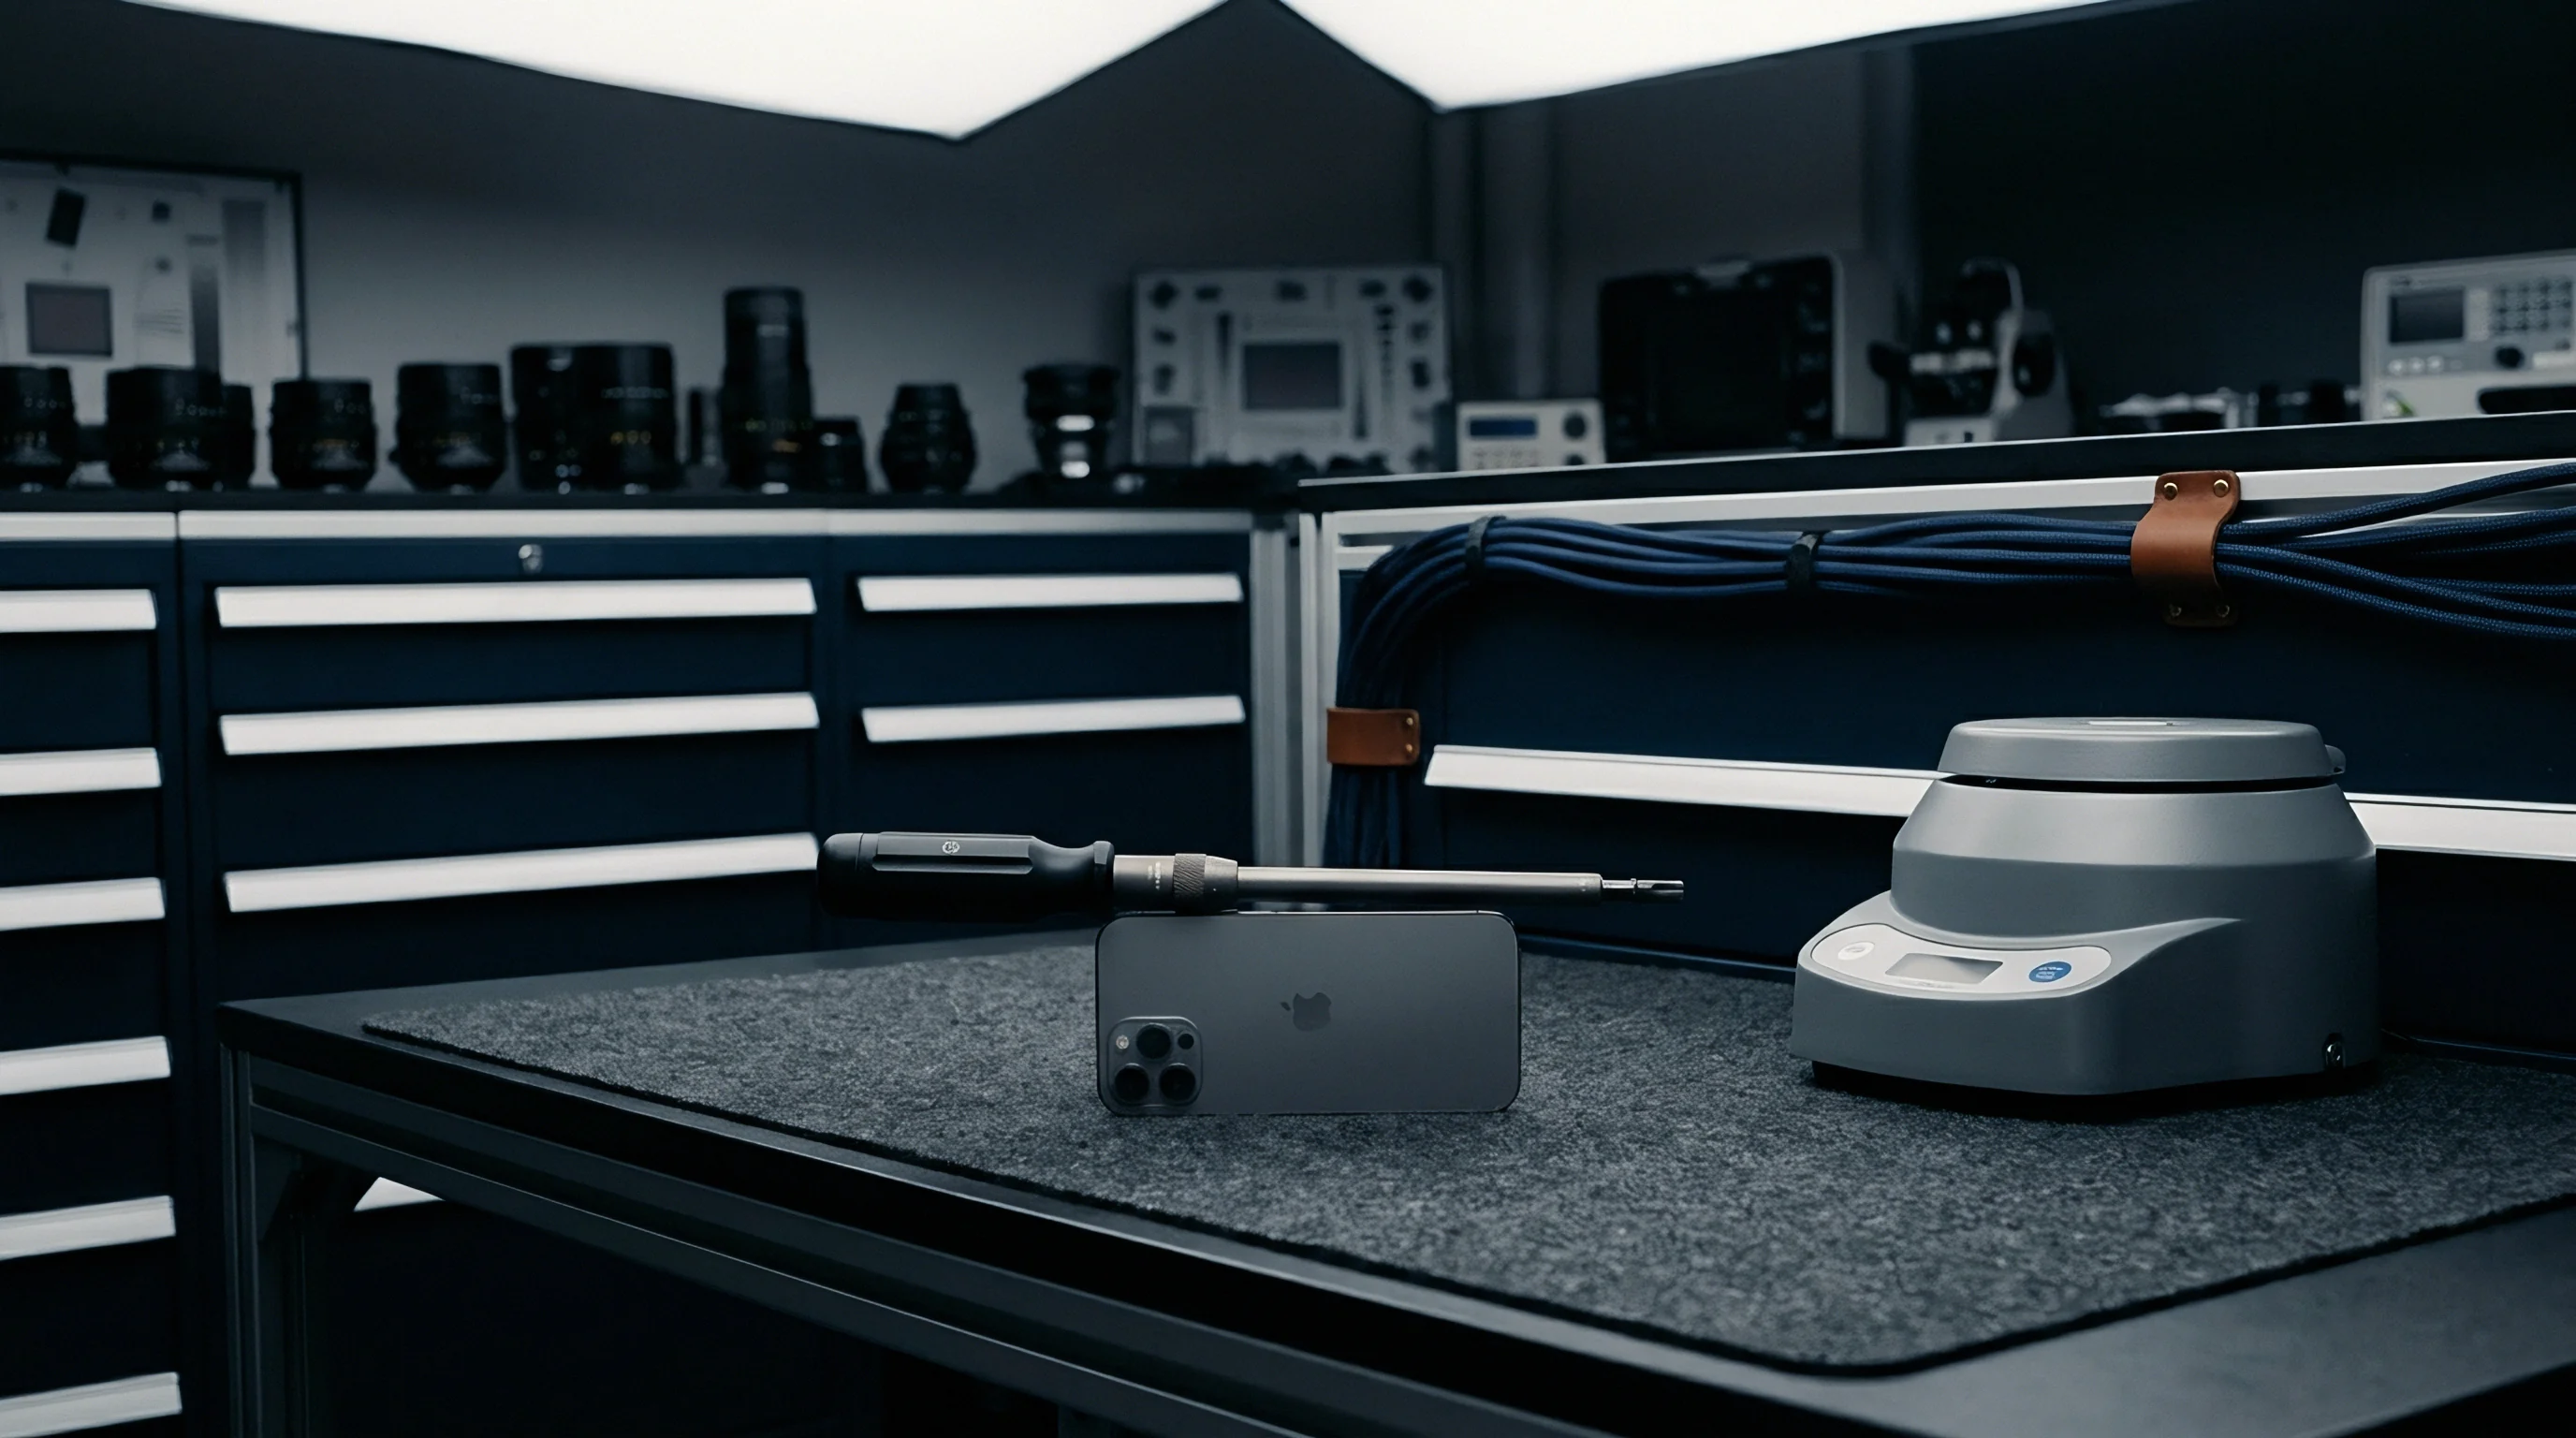
Torque specifications for mounting hardware and retention plates require strict control during test setup. Over-tightening flexes the circuit board, transferring bending moments into the sensor package. Under-tightening allows micro-motion between package and pad during sharp acceleration transients.
Calibrated pneumatic or electronic torque drivers (holding within plus or minus 0.02 Newton-meters) maintain consistent mounting conditions across all sample units.
Improper fixture clamp torque varying by 0.15 Newton-meters from nominal values shifts baseline zero-rate bias by 3.4 degrees per second under 10g random vibration exposure.
Heavy test fixtures introduce thermal mass that prolongs stabilization times during environmental testing. If the device under test reaches equilibrium while the fixture retains a thermal gradient, conductive heat transfer through connection pins induces localized stress across the die. Effective fixture design reduces mass using webbed ribbing and high-modulus materials like titanium or beryllium-copper, achieving rapid thermal settling while maintaining structural rigidity.
Electrical cabling connected to the sensor can transmit parasitic vibration. Rigid harnesses act as acoustic conduits, carrying motor noise and cooling fan vibration directly into the package. Flexible ribbon cables secured with strain-relief blocks prevent cable-borne vibration from distorting baseline measurements.
Resonance Coupling and Cross-Axis Fixture Errors
Evaluating cross-axis sensitivity requires precise alignment between sensor axes and the rate table’s rotation axis. An angular misorientation of 0.1 degree couples 17.5 degrees per second of off-axis rate into the primary channel at 10,000 degrees per second. Test fixtures rely on precision alignment pins, optical targets, and CNC-machined reference surfaces to maintain orthogonality within 0.02 degrees.
Mounting plate flatness governs package stress distribution. Surface irregularities create point loads against the package base, warping the internal cavity. Precision grinding or lapping should hold fixture flatness within 5 micrometers across the mounting footprint to ensure uniform contact.
Key criteria for verifying fixture mechanics before testing include:
- First Structural Resonance Frequency exceeding 3,500 Hz, confirmed via modal analysis.
- Mounting Surface Flatness Deviation kept under 5.0 micrometers across the contact area.
- Dynamic Unbalance Residual below 0.05 gram-millimeters at full rotation speed.
- Thermal Stabilization Time Constant under 180 seconds across 50-degree Celsius steps.
- Electrical Interface Contact Resistance remaining under 50 milliohms per pin through 10,000 insertions.
During high-rate testing, a custom zero-insertion-force socket lost pin pressure during a 15,000 degree per second sweep, destroying three prototype sensors when power supply rails disconnected under high drive current.
Centripetal loads can shift fixture components at maximum velocity, making continuous mechanical inspection necessary.


Disparity
Lot acceptance for high-rate MEMS gyroscopes relies on variable sampling plans governed by standards such as ANSI/ASQ Z1.9 and ISO 3951-1. Unlike attribute sampling, which categorizes parts as pass or fail, variable sampling measures continuous numerical variables ~ scale factor error, zero-rate bias, Allan variance noise limits, and thermal drift coefficients. Analyzing parameter distributions offers equivalent lot protection with smaller sample sizes, reducing rate-table test duration while preserving statistical confidence.
Variable sampling assumes measured parameters follow normal distributions across each production lot. Fabrication processes such as DRIE etching, thin-film deposition, and cavity sealing typically produce normal variation across wafers. However, if parameter distributions exhibit skewness or multi-modal peaks ~ often stemming from mixed wafer lots or split ASIC sourcing ~ standard normal models become invalid.
Automated test pipelines must execute Shapiro-Wilk or Anderson-Darling normality tests before applying variable acceptance calculations.
Acceptable Quality Limit (AQL) and Lot Tolerance Percent Defective (LTPD) define the statistical balance between supplier and buyer risk. AQL establishes the maximum non-conformance rate acceptable as a process average, protecting producers against unwarranted lot rejections. LTPD defines the defect level where the buyer demands a high probability of rejection ~ typically setting consumer risk at 10 percent.
Variable sampling plans shape the Operating Characteristic (OC) curve, using sample standard deviations to discriminate sharply between acceptable and non-compliant lots.
Double and sequential variable sampling plans improve testing throughput by accepting high-quality lots after evaluating a small initial sample. If initial sample means fall comfortably within specification limits with low variance, the lot is accepted immediately. If parameters land near decision boundaries, the protocol draws a secondary sample to gather additional statistical weight before reaching a final disposition.
Statistical Foundations of Variable Acceptance Protocols
Variable acceptance calculations depend on the Upper Quality Index (QU) and Lower Quality Index (QL) derived from sample statistics. For sample size n, mean barX, standard deviation s, upper limit U, and lower limit L, quality indices are defined as QU = (U – barX) / s and QL = (barX – L) / s. These indices quantify the distance between the sample mean and specification limits in units of sample standard deviation.
Estimated lot defect percentages are derived by evaluating quality indices against standard normal distribution tables or cumulative distribution functions. Estimated non-conforming percentages above the upper limit (pU) and below the lower limit (pL) sum to total estimated defects (p = pU + pL). If p remains below the maximum allowable limit M (determined by AQL and sample size codes in ANSI/ASQ Z1.9 tables), the lot is accepted.
Procurement contracts must specify whether lot variance is calculated using the sample standard deviation method or the range method. The standard deviation method offers higher statistical efficiency, requiring fewer samples for equivalent AQL protection. While the range method simplifies manual calculation, it reduces statistical power and increases required sample sizes by 15 to 25 percent.
Automated test environments rely exclusively on the standard deviation method to minimize rate-table occupation time.
Standard clause ISO 3951-1 Section 6.3 mandates switching from normal to tightened inspection whenever two out of five consecutive lots are rejected on initial submission.
Tightened inspection raises quality index thresholds, shifting the OC curve to protect the buyer if supplier quality declines. Conversely, reduced inspection reduces sample sizes when supplier performance remains consistently strong across ten consecutive lots. Automated quality management software should strictly enforce these switching rules to prevent manual overrides during schedule pressure.
The table below details an ANSI/ASQ Z1.9 Inspection Level II Variable Sampling Plan (Standard Deviation Method, Single Sampling, Normal Inspection) applied to a lot size of 1,200 high-rate MEMS gyroscopes with an AQL of 0.40 percent.
| Parameter | Lower Limit (L) | Upper Limit (U) | Sample Size (n) | Max Allowable Defect % (M) | Critical Action Threshold |
|---|---|---|---|---|---|
| Full-Scale Non-Linearity (%) | 0.00 | 0.50 | 35 | 1.03 | Reject lot if estimated p > 1.03% |
| Zero-Rate Bias Offset (deg/s) | -10.00 | +10.00 | 35 | 1.03 | Reject lot if estimated p > 1.03% |
| Angle Random Walk (deg/rt-hr) | N/A | 0.05 | 35 | 1.03 | Reject lot if estimated p > 1.03% |
| Thermal Scale Factor Drift (ppm/C) | -100.00 | +100.00 | 35 | 1.03 | Reject lot if estimated p > 1.03% |
Process capability metrics such as Cp and Cpk provide long-term trend data that complements lot-by-lot screening. Cpk incorporates both process centering and spread relative to specification limits. A Cpk of 1.33 represents 4-sigma quality, whereas 1.67 corresponds to 5-sigma.
When a supplier maintains Cpk above 1.67 over five consecutive lots, inspection protocols can transition from standard ANSI/ASQ Z1.9 sampling to skip-lot inspection ~ testing every third or fifth shipment.

What Statistically Sets the Switch Point for Reduced Inspection in Gyro Lots?
Transitioning from normal to reduced inspection under ISO 3951-1 requires meeting four conditions simultaneously. First, the preceding ten lots must pass normal inspection without rejection. Second, cumulative estimated defects across those ten lots must remain below table thresholds.
Third, production must operate continuously without major tool recalibrations or material changes. Finally, quality engineering must formally approve the transition.
Reverting to normal inspection occurs immediately if a single lot fails reduced criteria. Production interruptions, tool overhauls, or fab transfers likewise cancel reduced inspection status. Enforcing these criteria ensures sample size reductions remain supported by process data rather than commercial scheduling pressures.
Outlier screening is essential when processing variable test data. A faulty socket connection can distort sample means and inflate standard deviations, causing an acceptable lot to fail. Applying Grubbs’ test or Dixon’s Q-test at a 99 percent confidence level identifies these technical anomalies.
Confirmed fixture-induced outliers should be re-tested under verified contact conditions rather than discarded arbitrarily.

Documentation Requirements for Verification Datasets
Complete lot verification packages must archive raw datasets, statistical summaries, and environmental logs to ensure traceability for aerospace and defense applications. This documentation supports system integrators during root-cause investigations following field failures.
Every completed lot package must contain:
- Wafer Fab and Assembly Lot Identifiers tying individual serial numbers back to silicon wafer and packaging runs.
- Raw Measurement Datasets containing uncorrected encoder signals, sensor frame outputs, and thermal chamber logs.
- Calculated Statistical Summaries covering sample means, standard deviations, normality p-values, and quality indices (QU, QL).
- Test Bench Calibration Records verifying NIST-traceable calibration for rate tables, environmental chambers, and meters.
- Outlier Investigation Logs detailing root-cause analysis and re-test actions for excluded points.
Statistical software should calculate quality indices automatically to eliminate manual lookup errors. Automated tools process test data instantly, generating pass/fail dispositions and archiving records in quality databases. This automation avoids transcription errors and ensures uniform rule enforcement across incoming material lines.
Statistical confidence ultimately depends on verifying normal distributions across every measured parameter.
Margin
Sourcing high-rate MEMS gyroscopes involves balancing landed cost, custom screening expenses, yield, and contractual risk. High-rate sensors represent specialized niche components compared to mass-market consumer gyroscopes. Wafer fabs yield fewer high-rate die per wafer because intricate suspension flexures, comb arrays, and high-voltage drive structures require larger silicon real estate.
Procurement agreements must weigh verification expenses against the cost of integrating a non-conforming sensor into a high-value sub-assembly.
Screening 100 percent of high-rate gyroscope lots across full dynamic ranges and temperature spans requires significant capital investment in rate tables and thermal chambers. Operating a dual-axis rate table with an integrated thermal chamber costs between 150 and 250 dollars per hour. Screening a 1,000-unit lot across four temperatures and three orthogonal axes can add up to 45 dollars per unit in direct test expense.
Implementing variable sampling reduces test duration by 70 to 85 percent, containing costs while maintaining rigorous quality assurance.
Yield loss during receiving inspection creates commercial friction between buyers and suppliers. Rejecting an entire lot on statistical grounds imposes substantial supplier costs through scrap or re-screening. Procurement contracts must specify explicit rejection and re-test protocols ~ defining financial responsibility for freight and re-testing when a lot fails.
Defining precise technical criteria in master service agreements prevents disputes when marginal lots are rejected.
Second-sourcing high-rate MEMS gyroscopes presents significant technical hurdles. Few silicon foundries possess the DRIE capability, high-aspect-ratio comb processing tools, and vacuum packaging lines required for components rated above 10,000 degrees per second. Relying on a single foundry exposes system integrators to supply disruption if production equipment fails or yields drop.
Sourcing teams should maintain cross-qualification technical dossiers for alternative components to safeguard production continuity.
Commercial Risk Exposure and Supplier Quality Metrics
Producer risk (alpha risk) represents the probability that an acceptable lot meeting quality standards is rejected due to sampling variation. Consumer risk (beta risk) represents the probability that a non-compliant lot passes inspection undetected. Standard sampling plans set alpha risk at 5 percent and beta risk at 10 percent.
Custom inspection plans can reduce consumer risk to 1 percent for critical military hardware, though this demands larger sample sizes and higher testing expense.
Zero-defect contract clauses, common in aerospace and automotive safety applications, conflict with the statistical foundation of sampling. Sampling estimates population parameters; it cannot guarantee zero defects in accepted material. Achieving zero defects requires 100 percent screening and burn-in testing to eliminate infant-mortality failures.
Master agreements must clearly distinguish statistical lot sampling from 100 percent screening to align operational expectations.
Landed cost models must account for scrap rates, receiving inspection expenses, import duties, and field failure liabilities. Sourcing lower-cost components from unverified suppliers often increases total cost once higher rejection rates and engineering rework are factored in. Strategic procurement favors vendors providing transparent statistical process control data with each shipment, allowing reduced receiving inspection at the buyer’s facility.
Quality audits should evaluate wafer fab cleanroom conditions, DRIE etch logs, wire bond pull test results, and package hermeticity testing. Assessing technical capabilities directly at the fab verifies process control long before silicon reaches packaging and final test. A comprehensive audit schedule includes annual reviews of supplier internal calibration standards and test software.

Contractual Lot Rejection Mechanisms
Explicit contractual terms governing lot rejection eliminate disputes when a shipment fails inspection. Supply agreements should require written rejection notice within 15 business days of material receipt. Rejection notices must provide raw test datasets, calculated quality indices (QU, QL), fixture calibration logs, and normality test results to substantiate the rejection.
Corrective Action Requests (CARs) triggered by lot failure mandate formal root-cause investigations using 8D or 5-Why methodologies. Suppliers must determine whether defects originated from wafer etch drift, packaging stress, ASIC calibration shift, or operator error. Quality engineering must approve verified corrective actions ~ such as modified etch recipes or tightened ASIC burn-in limits ~ before accepting subsequent production lots.
Re-screened or reworked lots resubmitted following an initial failure must undergo tightened sampling under ISO 3951-1 rules. Resubmitted material faces larger sample sizes and stricter acceptance criteria to rebuild statistical confidence. If a resubmitted lot fails variable sampling a second time, the contract should authorize the buyer to cancel outstanding purchase orders without penalty.
Skip-lot agreements incentivize suppliers to maintain consistent process control. When a vendor delivers twenty consecutive shipments without a rejection, receiving inspection can drop to periodic audits, substantially reducing testing expense. Skip-lot privileges are automatically revoked if any shipment exhibits parameter drift or fails inspection.

Cost Allocation per Subsystem Lot
Allocating receiving test expenses across production runs requires tracking rate table operating hours, thermal chamber energy, engineering labor, and fixture wear. High-rate testing consumes substantial power and wears precision spindle bearings, requiring overhauls every 2,000 operational hours. Incorporating equipment maintenance and depreciation into per-unit cost accounting maintains accurate financial metrics.
Third-party qualification laboratories provide screening options for low-volume integrators unable to justify capital expenditure for rate tables. External testing introduces transit lead times, chain-of-custody risks, and higher per-unit processing fees. Sourcing managers must calculate the break-even volume between outsourcing verification to certified labs and investing in dedicated internal test infrastructure.
Frameworks for establishing verification protocols balance lot size, unit cost, application criticality, and supplier performance history. Low-cost sensors intended for non-critical applications rely on simple attribute skip-lot inspection, whereas higher-cost units destined for tactical guidance require strict ANSI/ASQ Z1.9 variable sampling backed by archived raw datasets.
At what point does the cumulative landed cost of internal variable sampling verification exceed the fixed premium charged by silicon foundries for guaranteed 100 percent rate-table screened component lots?