Quantifying High Temperature MEMS Micro Strain Relaxation Kinetics
High-temperature MEMS micro-strain relaxation follows stretched exponential kinetics driven by Coble creep, requiring in-situ Raman verification above 400°C.

Slip
In micro-electromechanical systems, polycrystalline silicon, single-crystal silicon micro-cantilevers, and refractory metal thin films undergo localized atomic rearrangement under sustained high-temperature loading. Operating environments exceeding 300°C trigger structural changes within micro-scale flexures and piezoresistive bridges. These structural shifts relax frozen-in processing strains, shifting sensor zero-points and corrupting dynamic force calibrations.
High elastic stress combined with high heat accelerates defect movement. Thermo-mechanical stability over a three-year deployment relies directly on characterizing the precise rate at which elastic micro-strain converts into plastic deformation. Microstructural deformation mechanisms change at different temperature thresholds, altering overall device drift performance.
Microstructural Stress Dissipation Modes
Thermally activated deformation in micro-scale silicon and metallic thin films follows distinct physical pathways based on temperature and stress magnitude. At temperatures between 300°C and 500°C, low-temperature grain boundary sliding dominates non-passivated polycrystalline silicon. Atoms along disordered interfaces migrate to lower stress states, releasing macro-scale elastic energy through localized sliding micro-yields.
Above 600°C, vacancy-mediated lattice transport becomes the primary driving mechanism. In sub-micron film geometries, Coble creep dominates because the ratio of grain boundary area to total volume remains exceptionally high. Vacancies diffuse along grain boundary networks toward regions under high tension, while counter-flowing atoms cause permanent physical elongation.
Single-crystal silicon flexures behave differently: below 500°C, lattice dislocation motion remains frozen due to high Peierls-Nabarro stress, but localized surface defects and micro-machining damage sites act as sources for micro-scale dislocation nucleation when localized thermal stresses reach critical thresholds.
Single-crystal silicon structures maintained below 450°C avoid bulk dislocation glide, leaving grain boundary diffusion across surface oxide interfaces as the primary driver of zero-point drift.
In thin-film metallizations like platinum, titanium, and aluminum nitride used in MEMS strain gages, interfacial diffusion along adjacent substrate surfaces creates rapid stress dissipation. Compressive thermal mismatch strains relax by forming localized micro-voids or hillocks. These surface modifications shift baseline resistance values in piezoresistive paths, mimicking actual structural strain changes in target machinery.
- Coble Creep in Polycrystalline Films occurs via vacancy transport along grain boundary networks, dominating stress dissipation at temperatures between 400°C and 700°C in film thicknesses below two micrometers.
- Interfacial Sliding along Passivation Boundaries driven by thermal expansion coefficient mismatch causes rapid non-linear micro-strain decay within the first fifty operating hours.
- Dislocation Core Climb in Silicon Flexures initiates at micro-machining surface steps when localized elastic stress concentrations exceed three hundred megapascals at 600°C.
- Thermally Activated Defect Annealing reduces pre-existing lattice line defects, causing irreversible zero-point offsets in freshly sputtered micro-strain sensing elements.

Diffusional Creep and Grain Dynamics
The transition between volume diffusion and grain boundary transport alters the relaxation time constant of micro-machined elements. The effective strain relaxation rate follows a modified equation reflecting micro-scale boundary constraints. Total relaxation velocity scales inversely with the cube of the average grain diameter when Coble mechanisms dominate.
| Material Class | Temperature Range (°C) | Dominant Kinetic Pathway | Activation Energy (eV) | Relaxation Rate Constant (1/s) |
|---|---|---|---|---|
| Polycrystalline Silicon (LPCVD) | 350 to 550 | Coble Grain Boundary Creep | 1.45 ± 0.08 | 2.1 × 10⁻⁸ |
| Single-Crystal Silicon (100) | 500 to 750 | Dislocation Nucleation at Steps | 2.10 ± 0.12 | 4.3 × 10⁻¹⁰ |
| Silicon Carbide (3C-SiC) | 600 to 900 | Interface Diffusional Slip | 2.85 ± 0.15 | 1.2 × 10⁻¹¹ |
| Platinum Thin Film (Sputtered) | 300 to 600 | Surface Hillock Formation | 0.98 ± 0.05 | 8.7 × 10⁻⁷ |
Quantifying these parameters demands high-temperature micro-tensile testing setups capable of isolating thermal expansion noise from real micro-strain decay over extended holds. Thin films with fine microstructures relax stress faster than coarse-grained structures, making control over deposition conditions essential for long-term calibration stability.
Grain structures below one hundred nanometers show accelerated relaxation rates compared to bulk materials. High surface-to-volume ratios mean interfacial energy drives rapid structural change, requiring high-temperature pre-aging protocols to stabilize the initial microstructure prior to field deployment.
Annealing thin films at temperatures above maximum operating thresholds stabilizes grain boundaries, reducing operational strain decay rates over multi-year service lives.

Optics
Non-contact optical strain measurement technologies allow direct tracking of structural strain decay without mechanical loading pin interference. High-temperature optical cells feature double-pane quartz observation ports alongside active nitrogen purge systems to prevent micro-scale surface oxidation during thermal cycling. These systems maintain optical resolution down to sub-nanometer levels at temperatures up to 800°C.
Interferometric and spectroscopic methods quantify strain kinetics directly from optical wavelength shifts and interference pattern motion. Precise tracking of these optical responses provides a direct measure of lattice deformation across active micro-machined flexures.
Raman Shift Strain Mapping
Confocal Raman micro-spectroscopy measures micro-strain in silicon structures by evaluating inelastic photon scattering from optical phonon modes. In unstrained single-crystal silicon, the triply-degenerate longitudinal and transverse optical phonon mode produces a sharp Raman peak at 520.7 inverse centimeters. Applied elastic tension shifts this spectral peak toward lower wave numbers.
Hydrostatic and shear strain components relate directly to frequency shifts through secular equations incorporating deformation potential constants. At elevated temperatures, phonon-phonon scattering broadens the peak width and shifts the baseline center downward. Isolating pure strain relaxation from thermal line-broadening requires simultaneous temperature verification using anti-Stokes to Stokes intensity ratios, or secondary non-strained reference crystals mounted inside the cell.
Conformity with ISO IEC 17025 standard calibration clauses mandates that optical strain measurement setups maintain continuous thermal cell stability within 0.1°C to isolate strain-induced Raman shifts from thermal line-broadening.
Spatial resolution in laser Raman setups reaches sub-micron levels, allowing direct strain profiling across micro-beam fillets and anchor joints. Step-scanning across active sensor elements maps local strain dissipation during isothermal aging tests, revealing where peak stress zones cause localized micro-yielding.
Polarization-resolved Raman spectroscopy separates uniaxial strain components from biaxial stress fields in complex membrane geometries. Controlling incoming laser polarization and scattered light collection angles isolates specific strain tensor components with high accuracy.

Interferometric Micro Tensile Benchmarks
Digital holographic interferometry and double-beam laser Doppler vibrometry supply high-bandwidth tracking of out-of-plane and in-plane surface displacement fields. Micro-machined cantilevers held under fixed mechanical deflection inside high-temperature chambers relax stress, causing subtle changes in resonant frequency and equilibrium bending profile.
Laser Doppler vibrometry captures the shift in flexural resonance frequencies as strain-induced stiffness degrades over time. Resonance frequencies drop predictably as elastic tensile stress decays, giving a real-time measure of integrated micro-strain relaxation across the full length of the beam.
- Dual-Beam Laser Doppler Interferometry tracks out-of-plane micro-deflection with picometer-level displacement resolution, operating through fused silica chamber windows up to 800°C.
- High-Temperature Polarized Raman Spectrometers resolve optical phonon shifts down to 0.02 inverse centimeters, enabling micro-strain precision within fifty micro-strain units.
- Vacuum Environmental Test Chambers maintain operating pressures below one micro-pascal, stopping ambient oxidation from altering thin-film strain profiles during extended elevated temperature testing.
- Silicon Carbide Reference Standards verify baseline thermal alignment inside the optical path, eliminating beam steering errors caused by refractive index gradients in hot air.
Observed baseline shifts in high-temperature MEMS sensors can stem from external signal conditioning drift or from real microstructural relaxation within the silicon element itself.


Modeling
Predicting long-term strain decay requires kinetic models that account for complex, non-exponential relaxation paths. Standard linear elastic models fail at high temperatures because multiple relaxation mechanisms operate simultaneously, each with its own activation energy and time constant. Mathematical models must capture both early fast relaxation and long-term logarithmic decay tail behavior.
Stretched exponential functions offer an accurate framework for modeling these complex decay curves across varied operating temperatures. Fitting empirical test data to these functions yields physical parameters that extrapolate long-term strain drift across multi-year operational lifetimes.

What Governs Non-Exponential Thermal Strain Decays?
Micro-strain dissipation in heterogeneous microstructures proceeds through multiple overlapping physical processes rather than a single exponential step. Initial rapid stress relaxation occurs via high-energy defect movement and localized boundary sliding. As easy defect paths fill, relaxation slows, requiring higher thermal activation energy to drive further structural change.
This distribution of relaxation times produces an extended stretched exponential curve described by the Kohlrausch-Williams-Watts model. The stretching parameter accounts for spatial variation in microscopic structural environments across polycrystalline thin films. Values near unity indicate uniform relaxation, while values near 0.5 reveal broad distributions of activation energies driven by disordered interfaces.
Evaluating this response over time yields a direct representation of remaining micro-strain inside active sensor elements:
ε(t) = ε₀ · exp
Here, ε₀ represents the initial elastic strain state, τ represents the temperature-dependent characteristic relaxation time constant, and β represents the stretching exponent bounded between zero and one. Arrhenius models capture the thermal dependence of the relaxation time constant:
τ(T) = τ₀ · exp
In this expression, Eₐ represents the effective activation energy, kB represents Boltzmann’s constant, T represents absolute temperature in Kelvin, and τ₀ represents a pre-exponential time factor reflecting atomic vibration frequencies.
A high-temperature piezoresistive element subjected to 500 micro-strain at 500°C retains only 412 micro-strain after 100 hours of continuous operation, showing a non-linear decay profile with a stretching exponent of 0.62.
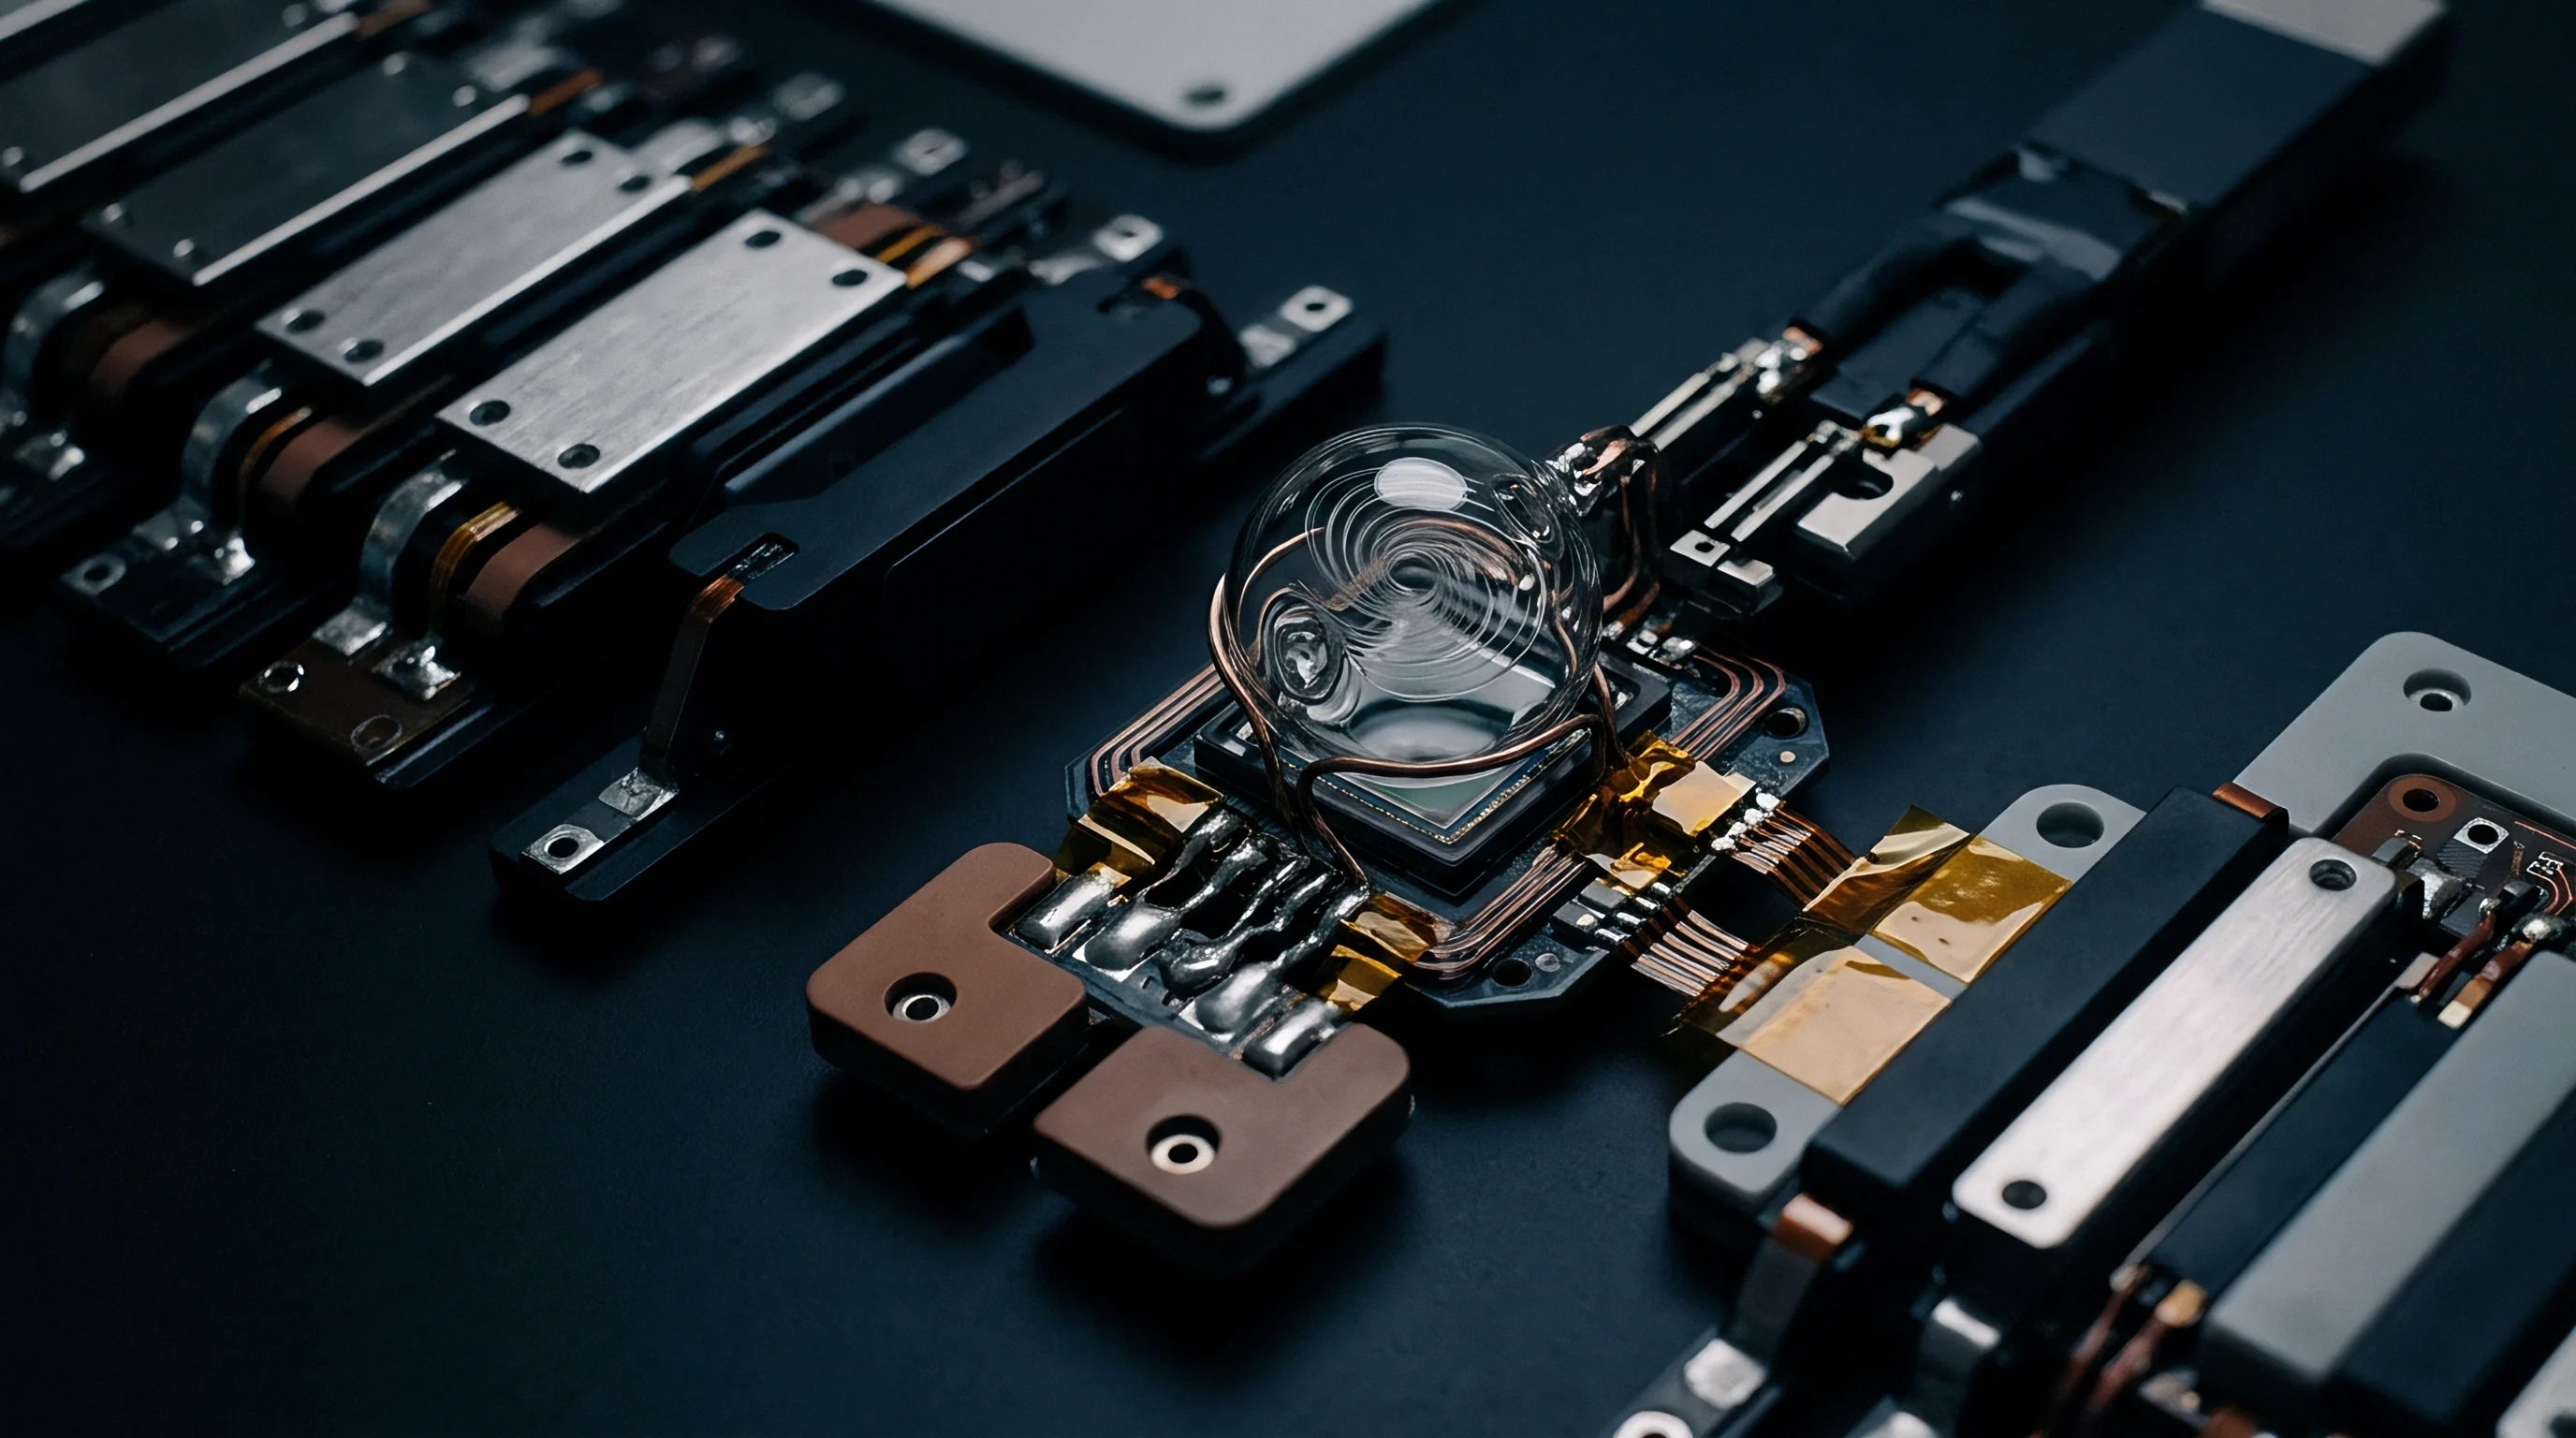
Kohlrausch Stretched Exponential Parametrization
Fitting empirical high-temperature strain decay data to stretched exponential equations requires multi-variable non-linear regression algorithms. Short-term test data spanning a few hundred hours often fails to capture long-term parameters accurately, leading to large errors when projecting total three-year drift.
Step-wise isothermal testing provides a reliable solution. Microstructures undergo controlled strain holds across multiple temperature steps, capturing relaxation kinetics at each level. Combining these dataset curves yields a master relaxation curve that predicts sensor drift over long operational timeframes.
Whether micro-scale strain relaxation kinetics fully reach a stable asymptotic limit at elevated temperatures or minor structural creep continues indefinitely until failure remains an open research question.

Audit
Quantifying micro-strain relaxation kinetics demands rigorous metrological traceability across all measurement setups. Uncertainty budgets must account for temperature instability, optical alignment shifts, thermal expansion mismatches, and instrument drift. Standard room-temperature calibration procedures fail to capture high-temperature performance, making direct in-situ verification essential.
ISO IEC 17025 accredited procedures mandate quantifying every individual contribution to overall measurement uncertainty. Evaluating these components step-by-step ensures traceable calibration figures across high-temperature operational regimes.
In-Situ Environmental Chamber Calibrations
Environmental test chambers used for high-temperature strain sensor evaluations must maintain uniform temperature zones across active test regions. Temperature gradients across micro-cantilevers or strain sensor bridges cause non-uniform thermal expansion, generating false strain signals that corrupt kinetic measurement accuracy.
Multi-point thermocouple arrays calibrated against primary reference standards continuously monitor test cell thermal profiles. Maintaining thermal stability within 0.1°C across test zones keeps thermal expansion noise below target micro-strain measurement limits.
- Mount the micro-strain sensor array onto the high-purity alumina test fixture inside the high-vacuum environmental chamber.
- Attach primary reference thermocouples directly adjacent to the micro-sensor substrate surface to track localized thermal profiles.
- Evacuate the test chamber to a base pressure below 5 × 10⁻⁴ Pa to eliminate ambient thin-film oxidation effects.
- Ramp temperature at 2°C per minute up to target evaluation temperature to prevent severe thermal shock stress.
- Apply controlled baseline mechanical strain via piezoelectric micro-actuators calibrated against optical interferometer standards.
- Log micro-strain relaxation profiles continuously for 500 hours using polarized Raman micro-spectroscopy at fixed time intervals.
- Fit recorded decay profiles against stretched exponential kinetic models to extract precise characteristic relaxation constants.

Traceable Uncertainty Budget Construction
Building a robust metrological uncertainty budget involves identifying every systematic and random noise source in the high-temperature optical test bench. Combining individual uncertainty terms according to standard metrological protocols yields an expanded overall measurement uncertainty figure.
| Uncertainty Source | Distribution Type | Standard Uncertainty (u_i) | Sensitivity Coefficient (c_i) | Uncertainty Contribution (micro-strain) |
|---|---|---|---|---|
| Thermal Cell Stability (±0.15°C) | Normal | 0.087 °C | 12.4 micro-strain/°C | 1.08 |
| Raman Spectral Peak Fit (±0.01 cm⁻¹) | Rectangular | 0.0058 cm⁻¹ | 250 micro-strain/cm⁻¹ | 1.45 |
| Laser Heating Local Drift | Normal | 0.12 mW | 4.2 micro-strain/mW | 0.50 |
| Substrate Expansion Coefficient Variance | Rectangular | 0.15 × 10⁻⁶ /K | 15.0 micro-strain/(10⁻⁶/K) | 2.25 |
| Optical Window Refraction Shift | Normal | 0.002 mm | 18.5 micro-strain/mm | 0.04 |
Combining these individual variance terms yields a combined standard uncertainty of 2.92 micro-strain. Applying a standard coverage factor of two delivers an expanded measurement uncertainty of 5.84 micro-strain at a 95 percent confidence interval.
Ignoring high-temperature strain relaxation kinetics during sensor calibration leads directly to field zero-point drift, causing false structural alarm triggers, premature equipment shutdowns, and costly unbudgeted sensor replacements.

Margin
Translating micro-strain relaxation data into industrial sensor procurement specifications requires establishing realistic drift limits tied directly to operating temperature regimes. Standard datasheets often quote room-temperature accuracy specs, omitting long-term drift figures under high-temperature service conditions. Uninformed buyers risk selecting sensors that meet initial accuracy targets but drift out of tolerance within months of continuous operation.
Evaluating total landed cost requires factoring in initial calibration certificates, field verification cycles, and potential warranty liabilities stemming from sensor drift. Setting tight strain stability tolerances without verifying high-temperature kinetic properties increases production yield losses and inflates component prices needlessly.

Datasheet Drift Limits and Operating Realities
High-temperature MEMS strain gages specified for continuous operation above 400°C must state maximum acceptable zero-point drift rates over target service lifetimes. An un-aged polycrystalline silicon sensor may show up to 15 percent baseline strain decay over its first year in service, while a properly pre-aged element holds drift below 0.5 percent under identical operating conditions.
Procurement specifications should demand high-temperature pre-aging proof alongside traceable verification dossiers showing compliance with target stability limits. Requiring supplier compliance documentation ensures field performance matches datasheet accuracy claims.

Commercial Qualification and Warranty Exposure
Field returns caused by zero-point wander expose sensor suppliers to significant financial liability under industrial supply agreements. Incorporating clear micro-strain stability specifications into master procurement contracts sets binding performance metrics for incoming sensor batches.
Suppliers unable to supply verified thermal aging kinetic data must bear warranty costs associated with premature field drift failures. Clear specification line items shift financial risks back to component manufacturers, protecting end users from unbudgeted field maintenance expenses.
Standard purchase contracts incorporating ISO 10012 measurement management compliance clauses bind component suppliers to deliver fully documented high-temperature kinetic relaxation dossiers for every certified production lot.