Parameter Calibration of Anand Viscoplastic Model for Lead Free Solders
Calibrating Anand viscoplastic parameters for lead free solders demands isothermal tensile and relaxation testing across temperatures and strain rates.

Isotherm
Solder joint reliability in electronic assemblies depends on characterising viscoplastic deformation across operational temperatures ranging from -40°C to 125°C. Lead-free alloys, predominantly tin-silver-copper (SAC) variants and high-reliability bismuth-antimony modified formulations, experience homologous temperatures above 0.5 T_m at room temperature. Under these conditions, elastic deformation accounts for a fraction of total strain, while time-dependent viscoplastic flow governs stress relaxation, creep, and fatigue accumulation. The Anand viscoplastic model incorporates internal state variables to capture strain-rate sensitivity and strain hardening without requiring a explicit yield surface definition.
Calibrating the nine Anand parameters requires an experimental matrix that isolates thermal effects from strain-rate effects. High temperatures lower deformation resistance and accelerate diffusion mechanisms, whereas low temperatures amplify strain-hardening rates. A calibration program relying on incomplete thermal spans risks underestimating stress amplitudes during low-temperature dwells or overestimating stress relaxation at elevated temperatures.

Thermal Matrix Boundaries
At 0.5 to 0.8 times the absolute melting temperature, tin-based alloys undergo rapid dislocation climb and grain boundary sliding. Isothermal tensile testing for SAC305 (Sn-3.0Ag-0.5Cu) and Innolot (Sn-3.8Ag-0.7Cu-1.4Sb-0.15Ni-0.2Bi) must cover a minimum of four temperature baselines: -40°C, 25°C, 75°C, and 125°C. Extended automotive applications require an additional point at 150°C. Temperature uniformity along the specimen gauge length must stay within ±0.5°C during testing to prevent localized necking and thermal gradient artifacts.
Thermal equilibrium demands precise soak times prior to mechanical loading. Temperature shifts state. Unstabilized thermal profiles introduce artificial thermal expansion strain into the force-displacement data, corrupting the calculated elastic modulus and early transient stress-strain slope.
Soaking specimens for twenty minutes at each isothermal step establishes thermal equilibrium without inducing excessive microstructural aging or coarsening of intermetallic compounds prior to strain application.
Strain Rate Ranges across Load Profiles
Viscoplastic flow stress scales non-linearly with strain rate across several orders of magnitude. Operational strain rates in electronic packaging range from low thermal expansion rates around 10^-6 s^-1 during passive dwell periods to 10^-2 s^-1 during rapid power-cycling transients. Isothermal tensile tests must span at least three distinct strain rates, typically 10^-5 s^-1, 10^-4 s^-1, and 10^-3 s^-1, at every designated temperature baseline.
Strain rate alters yield. Testing at a single constant strain rate obscures the strain-rate sensitivity exponent m and invalidates saturation stress calculations. Supplementing monotonic tensile tests with strain-rate jump tests or stress-relaxation tests accelerates parameter isolation.
In a stress-relaxation test, holding total strain constant at a fixed level allows stress decay measurement over time, directly exposing the relationship between viscoplastic strain rate and instantaneous flow stress under evolving internal state variables.
A test matrix spanning three temperatures and two strain rates yields fits that fail under transient field profiles.


Specimen
Mechanical testing of cast solder coupons relies on meticulous control over cooling rates and cross-sectional geometry to replicate printed circuit board microstructures. Bulk tensile bars cast in heavy copper molds solidify significantly slower than sub-millimeter surface-mount solder joints. Slow cooling produces coarse beta-tin grain structures and large primary Ag3Sn plates, yielding lower yield strength and elevated creep rates compared to production joints.
Microstructure governs response. Standard tensile coupons with cross sections larger than three millimeters fail to capture the grain orientation effects present in actual ball grid array interconnects. Production joints often contain only one or two beta-tin grains across their volume, making deformation anisotropic.
When calibrating continuum constitutive models like Anand, test coupons must establish an isotropic continuum baseline while maintaining microstructural feature sizes comparable to actual assembly conditions.

Microstructural Grain Scale Effects
Solidification rates for calibration specimens must target 1.0°C to 3.0°C per second to match surface-mount reflow profiles. Water-chilled aluminum molds achieve these cooling rates for dogbone specimens having gauge diameters between 1.0 mm and 2.0 mm. Deviations in cooling rate alter the secondary dendrite arm spacing (SDAS) of the tin matrix and change the distribution of intermetallic particles, directly shifting the initial deformation resistance parameter s_0.
Sub-millimeter solder joints exhibit faster solidification rates and finer intermetallic spacing than bulk cast tensile bars.
Grain boundaries slide rapidly. Porosity introduced during specimen casting creates stress concentrations that prematurely degrade ultimate tensile strength. Radiographic inspection or micro-computed tomography screens out cast coupons containing internal voids exceeding 1% of the gauge volume.
Machining dogbone geometries directly from extruded or micro-cast rods minimizes surface defects, but final specimens require electrochemical polishing to remove work-hardened surface layers created during lathe operations.
Machine Compliance Compensation
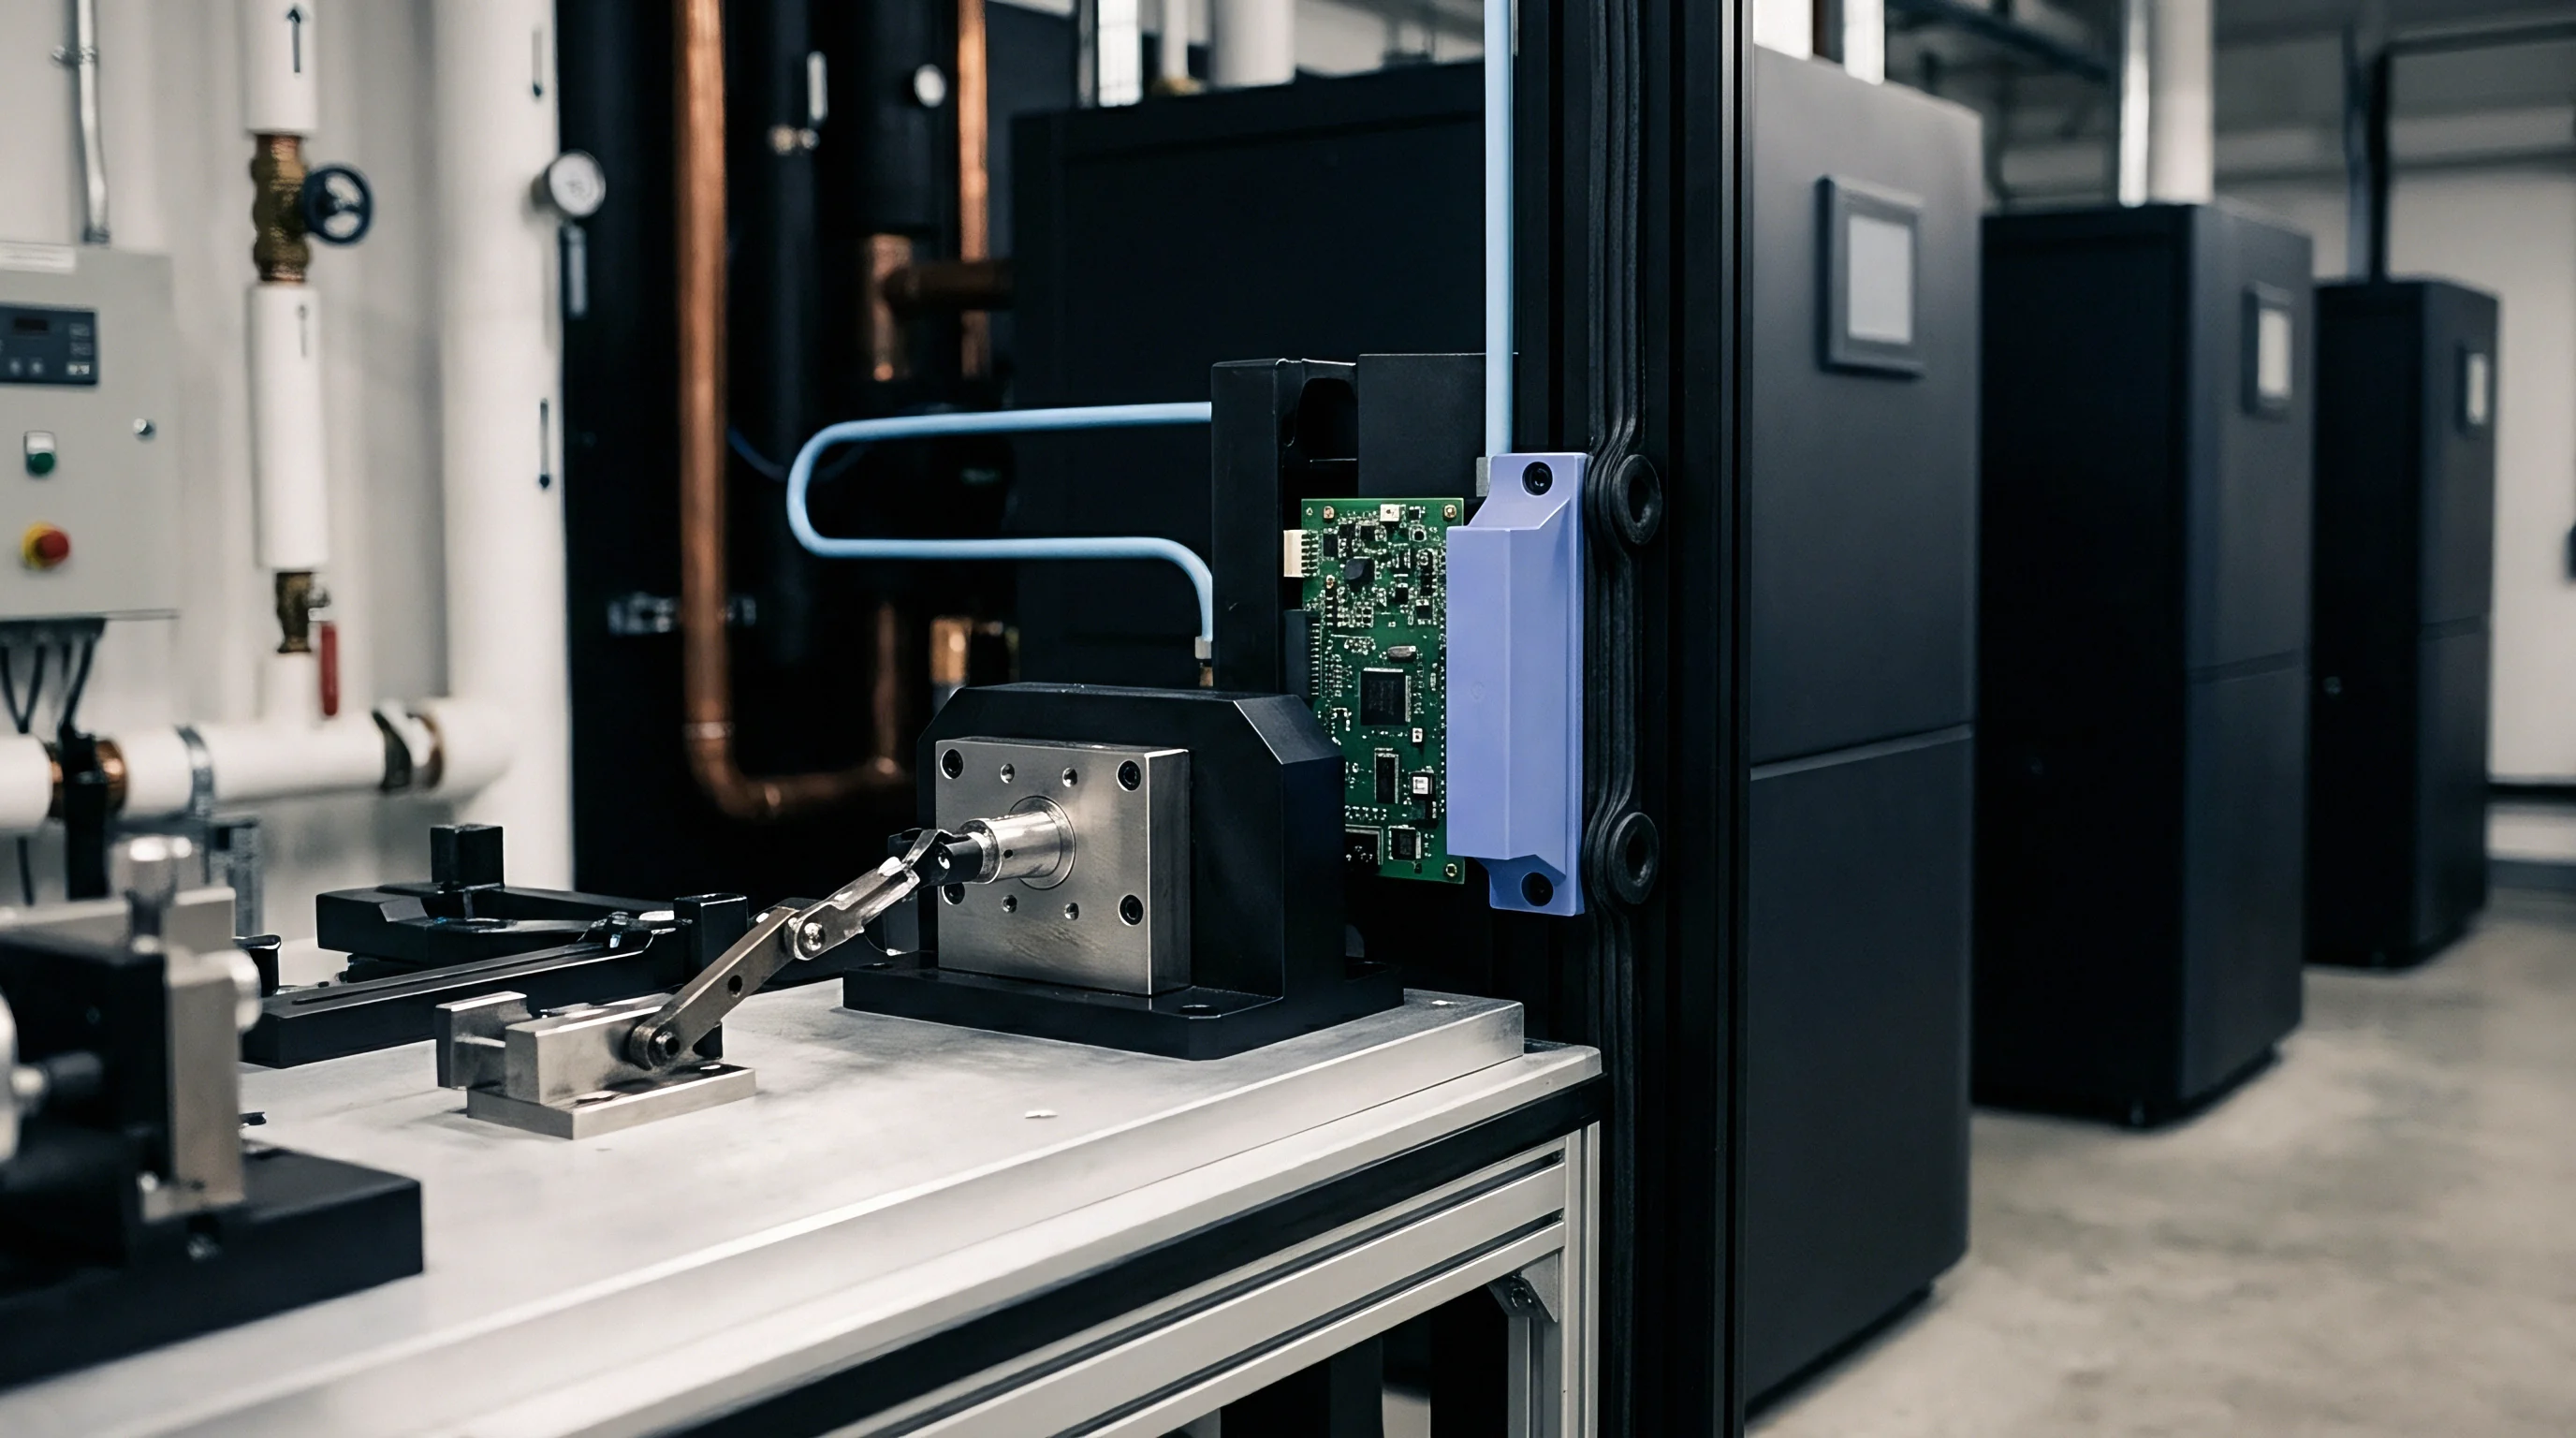
Electromechanical test frames introduce system deflection that distorts measured strain values if load-cell displacement serves as the primary feedback variable. Machine stiffness corrupts modulus. The true specimen strain differs from crosshead displacement divided by gauge length due to compliance in load cells, pull rods, grips, and frame frames.
- Grip slippage alters crosshead displacement readings during high-load tensile transients, introducing fictitious strain components that inflate calculated hardening exponents.
- Thermal frame expansion during elevated-temperature chamber testing induces drift in load transducers, corrupting low-stress relaxation measurements.
- Load cell misalignment subjects miniature dogbone coupons to off-axis bending moments, causing premature localized yielding along gauge margins.
- Extensometer mass loading exerts transverse forces on small-diameter solder specimens, producing localized stress concentrations and invalidating uniform deformation assumptions.
Optical extensometry or non-contact digital image correlation (DIC) isolates pure specimen deformation within the uniform gauge length. DIC tracking eliminates frame compliance artifacts and captures localized strain concentrations prior to necking. When load-cell displacement cannot be avoided, calibrating the mechanical compliance matrix of the test fixture across the temperature domain permits mathematical subtraction of system stiffness from the total displacement record.
Test houses frequently attribute scatter in stress-strain curves to minor casting inclusions rather than grip slippage or system compliance.

Extraction
Determining the nine material constants of the Anand constitutive equation involves separating steady-state saturation behavior from transient strain-hardening responses. The Anand model frames viscoplastic strain rate as a function of equivalent stress sigma and deformation resistance s:
dp/dt = A exp(-Q / (R T)) ^(1/m)
The state variable s evolves according to hardening and softening mechanisms:
ds/dt = h0 |1 – s / s |^a sgn(1 – s / s ) dp/dt
Where the saturation value of deformation resistance s follows the relationship:
s = s_hat ^n
State variables evolve slowly. The material parameters requiring calibration are: activation energy Q divided by universal gas constant R (Q/R), pre-exponential factor A, stress multiplier xi, strain rate sensitivity exponent m, initial deformation resistance s_0, hardening constant h_0, saturation deformation resistance coefficient s_hat, strain rate sensitivity of saturation n, and hardening sensitivity exponent a.
Steady State Parameter Isolation
Under steady-state viscoplastic flow, deformation resistance reaches saturation, meaning s equals s and ds/dt vanishes. The steady-state stress sigma_s relates directly to strain rate and temperature:
sigma_s = (s_hat / xi) ^m )] ^n
Simplifying the formulation in the steady-state regime isolates A, Q/R, xi, and m using non-linear least-squares fitting against saturation stress values identified at the plateau of isothermal tensile curves across multiple temperatures and strain rates. Linearizing the equation at low stress values yields initial estimates for Q/R and A via Arrhenius plots of ln(dp/dt) against inverse absolute temperature 1/T.
At a strain rate of 0.001 per second and a temperature of 125°C, SAC305 exhibits a steady-state saturation stress of 24.2 MPa.

Transient Strain Hardening Coefficients
Once steady-state parameters are fixed, transient stress-strain data determines the remaining hardening parameters s_0, h_0, s_hat, n, and a. Differentiating stress with respect to plastic strain yields the plastic hardening modulus H = d(sigma)/d(p). Integrating the state evolution equation under constant strain rate provides an analytical expression for stress as a function of plastic strain:
sigma = sigma_s – (1 – a) ^(1 / (1 – a))
- Smooth raw load-displacement data using a Savitzky-Golay filter to eliminate mechanical noise without attenuating transient yielding peaks.
- Convert engineering stress and engineering strain to true stress and true plastic strain records by subtracting elastic strain components using temperature-dependent elastic moduli.
- Identify steady-state saturation stress values across all test temperatures and strain rates to populate the steady-state parameter matrix.
- Perform non-linear regression on steady-state stress equations to determine pre-exponential factor A, activation energy Q/R, stress multiplier xi, and strain rate exponent m.
- Extract initial deformation resistance s_0 from the yield stress at zero plastic strain across tested temperatures.
- Fit transient strain-hardening data to isolate hardening constant h_0, saturation coefficient s_hat, saturation exponent n, and strain rate sensitivity exponent a.
Executing sequential extraction steps prevents parameter interaction errors during non-linear fitting operations. Table 1 outlines calibrated Anand parameters for SAC305 and Innolot alloys derived from experimental tensile matrices.
| Parameter | Unit | SAC305 (-40°C to 125°C) | Innolot (-40°C to 150°C) | Physical Significance |
|---|---|---|---|---|
| A | s^-1 | 1.2e7 | 3.5e6 | Pre-exponential strain rate multiplier |
| Q/R | K | 9800 | 11200 | Activation energy divided by gas constant |
| xi | – | 4.0 | 3.2 | Stress multiplier factor |
| m | – | 0.25 | 0.19 | Strain rate sensitivity exponent |
| s_0 | MPa | 18.0 | 34.5 | Initial value of deformation resistance |
| h_0 | MPa | 19000.0 | 28500.0 | Hardening and softening constant |
| s_hat | MPa | 42.0 | 68.0 | Coefficient for saturation deformation resistance |
| n | – | 0.018 | 0.025 | Strain rate exponent for saturation |
| a | – | 1.5 | 1.8 | Strain hardening sensitivity exponent |
| Data derived from strain rate bounds 10^-5 s^-1 to 10^-2 s^-1. Overall fitting RMS error: SAC305 = 4.2%, Innolot = 5.1%. | ||||
Applying an inaccurate activation energy constant overpredicts low-temperature creep resistance and hides early field fatigue failures.


Optimization
Non-linear regression techniques refine preliminary manual parameter estimates by minimizing the sum of squared differences between measured and predicted stress-strain curves. Sequential manual extraction provides strong initial seeds, but global optimization algorithms prevent parameter stagnation in local minima. Multi-variable non-linear regression treats all nine Anand constants as coupled variables within a constrained parameter space.
Residuals reveal parameter bias. Optimization routines must balance errors equally across low strain rates and high strain rates. Without normalized error weighting, high-stress curves generated at low temperatures and high strain rates dominate the objective function, causing significant relative errors in low-stress, high-temperature regimes where stress relaxation occurs.

Objective Function Formulation
Formulating the objective function phi requires normalising stress residuals against experimental stress magnitudes at each data point i across N total measurements:
phi = sum_i ^2
Applying normalized relative residuals prevents high absolute stress values at -40°C from overpowering low absolute stress values at 125°C. Levenberg-Marquardt optimization algorithms efficiently solve this non-linear least-squares problem when provided with strict parameter upper and lower bounds based on physical material limits.
How Do Strain Rate Bounds Alter Extracted Hardening Exponents?
Restricting experimental strain rates to narrow bands shifts extracted hardening sensitivity exponents away from field values. When calibration matrices omit low strain rates (below 10^-5 s^-1), the optimization algorithm inflates the hardening constant h_0 while underestimating the strain rate exponent n. This imbalance causes finite element models to predict artificially rapid stress relaxation during dwell periods in thermal cycling simulations.
Accuracy demands strict bounds. Introducing genetic algorithms prior to gradient-based optimization scans the multidimensional error landscape broadly, preventing early convergence on unphysical parameter sets where parameters like xi or a hit boundary limits.
- Activation energy bounds must remain within 8000 K to 13000 K for tin-rich alloys to align with self-diffusion mechanisms of bulk beta-tin.
- Stress multiplier parameters require restriction to values between 1.0 and 10.0 to maintain mathematical stability during inverse hyperbolic sine operations.
- Hardening sensitivity exponents must be constrained between 1.0 and 2.5 to avoid numerical divergence during high-plastic-strain updates.
- Initial deformation resistance cannot exceed measured yield stress values obtained at the lowest test temperature and highest strain rate.
Table 2 evaluates the sensitivity of finite element output metrics when individual Anand parameters experience a +10% calibration error under thermal cycling load conditions (-40°C to 125°C, 15-minute dwell times).
| Perturbed Parameter (+10%) | Change in Plastic Strain Range (%) | Change in Plastic Work Density (%) | Peak Dwell Stress Impact (%) |
|---|---|---|---|
| A (Pre-exponential) | -3.2 | -4.1 | -5.8 |
| Q/R (Activation Energy) | +6.8 | +8.2 | +9.1 |
| xi (Stress Multiplier) | -8.5 | -9.4 | -11.2 |
| m (Rate Sensitivity) | -12.1 | -14.3 | +13.5 |
| s_0 (Initial Resistance) | +1.1 | +0.8 | +2.4 |
| h_0 (Hardening Constant) | -2.4 | -1.9 | +3.1 |
| s_hat (Saturation Coeff) | -7.6 | -8.1 | +8.9 |
| n (Saturation Exponent) | -5.3 | -6.2 | +6.7 |
| a (Hardening Exponent) | -0.9 | -1.2 | +1.4 |
IPC-9701 qualification protocols require thermo-mechanical fatigue simulations to land within a twenty percent band of experimental characteristic life.
Standard supply agreements incorporating IPC-9701 thermal cycling validation mandate that model inputs use parameter sets fitted across the full operating range rather than ambient room temperature data.

Implementation
Incorporating the viscoplastic constitutive framework into commercial finite element software relies on backward Euler implicit integration algorithms to update internal state variables at every integration point. FEA solvers like ANSYS (via TB,ANAND option) and ABAQUS (via user subroutines UMAT or CREEP) enforce incremental equilibrium at each time step dt. Large thermal steps or rapid strain-rate transitions cause local state-variable evolution equations to become stiff, demanding adaptive time-stepping algorithms to maintain global convergence.
Small errors compounding yield failure. Numerical implementation schemes update internal deformation resistance s_t to s_(t+dt) based on the incremental plastic strain dp. If the incremental step dp is overly large, implicit equilibrium iterations fail to converge, triggering automatic time-step cutbacks that slow down simulation speed.
Viscoplastic State Variable Integration
Within every equilibrium iteration, the numerical algorithm calculates the trial stress state elastically. If the trial stress exceeds the scalar deformation resistance, the solver computes the viscoplastic strain increment dp and updates s using radial return mapping. Convergence demands bounded increments.
Mesh density shifts work values. Strain energy density accumulation per thermal cycle correlates directly with solder joint crack initiation. High parameter sensitivity in m and xi directly alters the calculated plastic work density per cycle, which serves as the fundamental input into Darveaux or fatigue damage models for lifetime prediction.
Viscoplastic strain energy density accumulated during thermal cycling serves as the driver for crack initiation in fatigue damage modeling.
Convergence Instabilities under High Thermal Gradients
Rapid thermal shock conditions (-40°C to 125°C with ramp rates exceeding 30°C per minute) produce steep spatial thermal gradients across print circuit board structures. Solder creep governs fatigue. The stiff temperature dependence controlled by Q/R causes localized element integration points to exhibit extreme variations in viscoplastic flow rate.
Elements near package corners experience rapid stress relaxation while interior elements remain constrained elastically. Abrupt changes in material stiffness across adjacent elements lead to localized numerical chatter. Setting maximum allowable viscoplastic strain increments per time step (typically limited to 0.001) stabilizes numerical integration without compromising global stress-strain history accuracy.
A certified material calibration dossier must contain specific documentation demonstrating parameter validity:
- Raw stress-strain curves formatted as raw ASCII tabular records across all tested temperatures and strain rates with fixture compliance subtracted.
- Parameter optimization reports listing objective function convergence histories, final residual distributions, and lower and upper boundary bounds.
- Goodness-of-fit metrics detailing coefficient of determination R^2 and root-mean-square error values evaluated independently for each isothermal test condition.
- Verification single-element test models providing simulation input scripts that reproduce experimental stress-strain responses within a 5% margin.
Whether rate-dependent hardening exponents calibrated on bulk coupons accurately represent micro-scale deformation in sub-fifty micron solder interconnects remains unresolved in current metrological literature.

Discrepancy
Divergence between predicted finite element joint fatigue life and thermal shock chamber test results stems primarily from calibration errors in the low-strain-rate regime. Standard isothermal tensile testing rarely operates at strain rates below 10^-5 s^-1 due to equipment duration limitations. Thermal dwell periods during passive electronic storage or system operation enforce strain rates down to 10^-8 s^-1, forcing finite element code to extrapolate Anand model equations far outside their calibrated domain.
Unverified constants increase risk. Extrapolating stress relaxation behavior using unverified rate exponents n and m creates massive errors in calculated plastic work density. If saturation stress s is overestimated at low strain rates, simulated stress relaxation during 15-minute dwell periods occurs too slowly, overpredicting residual stress and underestimating plastic creep strain accumulation per cycle.

Thermo Mechanical Fatigue Life Errors
Connecting finite element output to joint lifetime requires feeding calculated inelastic strain range delta_epsilon_p or plastic work density delta_W into empirical fatigue damage equations, such as the modified Coffin-Manson relation:
N_f = C (delta_W)^(-d)
Where N_f represents characteristic cycles to failure, while C and d are fatigue ductility coefficients. A 15% error in calculated plastic work density delta_W, caused by improper calibration of the stress multiplier xi or strain rate exponent m, propagates exponentially through the fatigue equation, resulting in a 30% to 50% discrepancy in predicted fatigue life N_f.
Thermal gradients accelerate damage. When Anand parameter calibration ignores age-hardening and microstructural coarsening that occurs during extended high-temperature exposure, the constitutive model overestimates solder flow resistance in later service years. In-service solder joint coarsening softens the matrix, accelerating creep deformation and reducing actual fatigue life well below initial design estimates.
Commercial Risk of Unverified Model Inputs
Committing manufacturing resources based on unverified Anand model parameters exposes electronic product manufacturers to severe warranty exposure. Overestimating joint lifetime leads to premature field failures in automotive control units, industrial power modules, or aerospace avionics. Conversely, underestimating joint fatigue resistance forces unnecessary engineering redesigns, higher material costs through over-engineering, or delayed product releases.
Purchasing material calibration dossiers from accredited metrology laboratories provides traceable documentation defending design decisions during quality audits. Third-party testing specifications must require dual-validation testing, where calibrated Anand parameters are verified against independent thermal cycling strain measurements on physical test assemblies before finalizing constitutive model inputs for production simulations.