Anand Viscoplastic Strain Accumulation in Metallic Die Attach Solders under Cyclic Thermal Loading
Anand viscoplastic strain modeling requires accredited nine-parameter empirical calibration to accurately calculate fatigue life in metallic die attach layers.
Grain
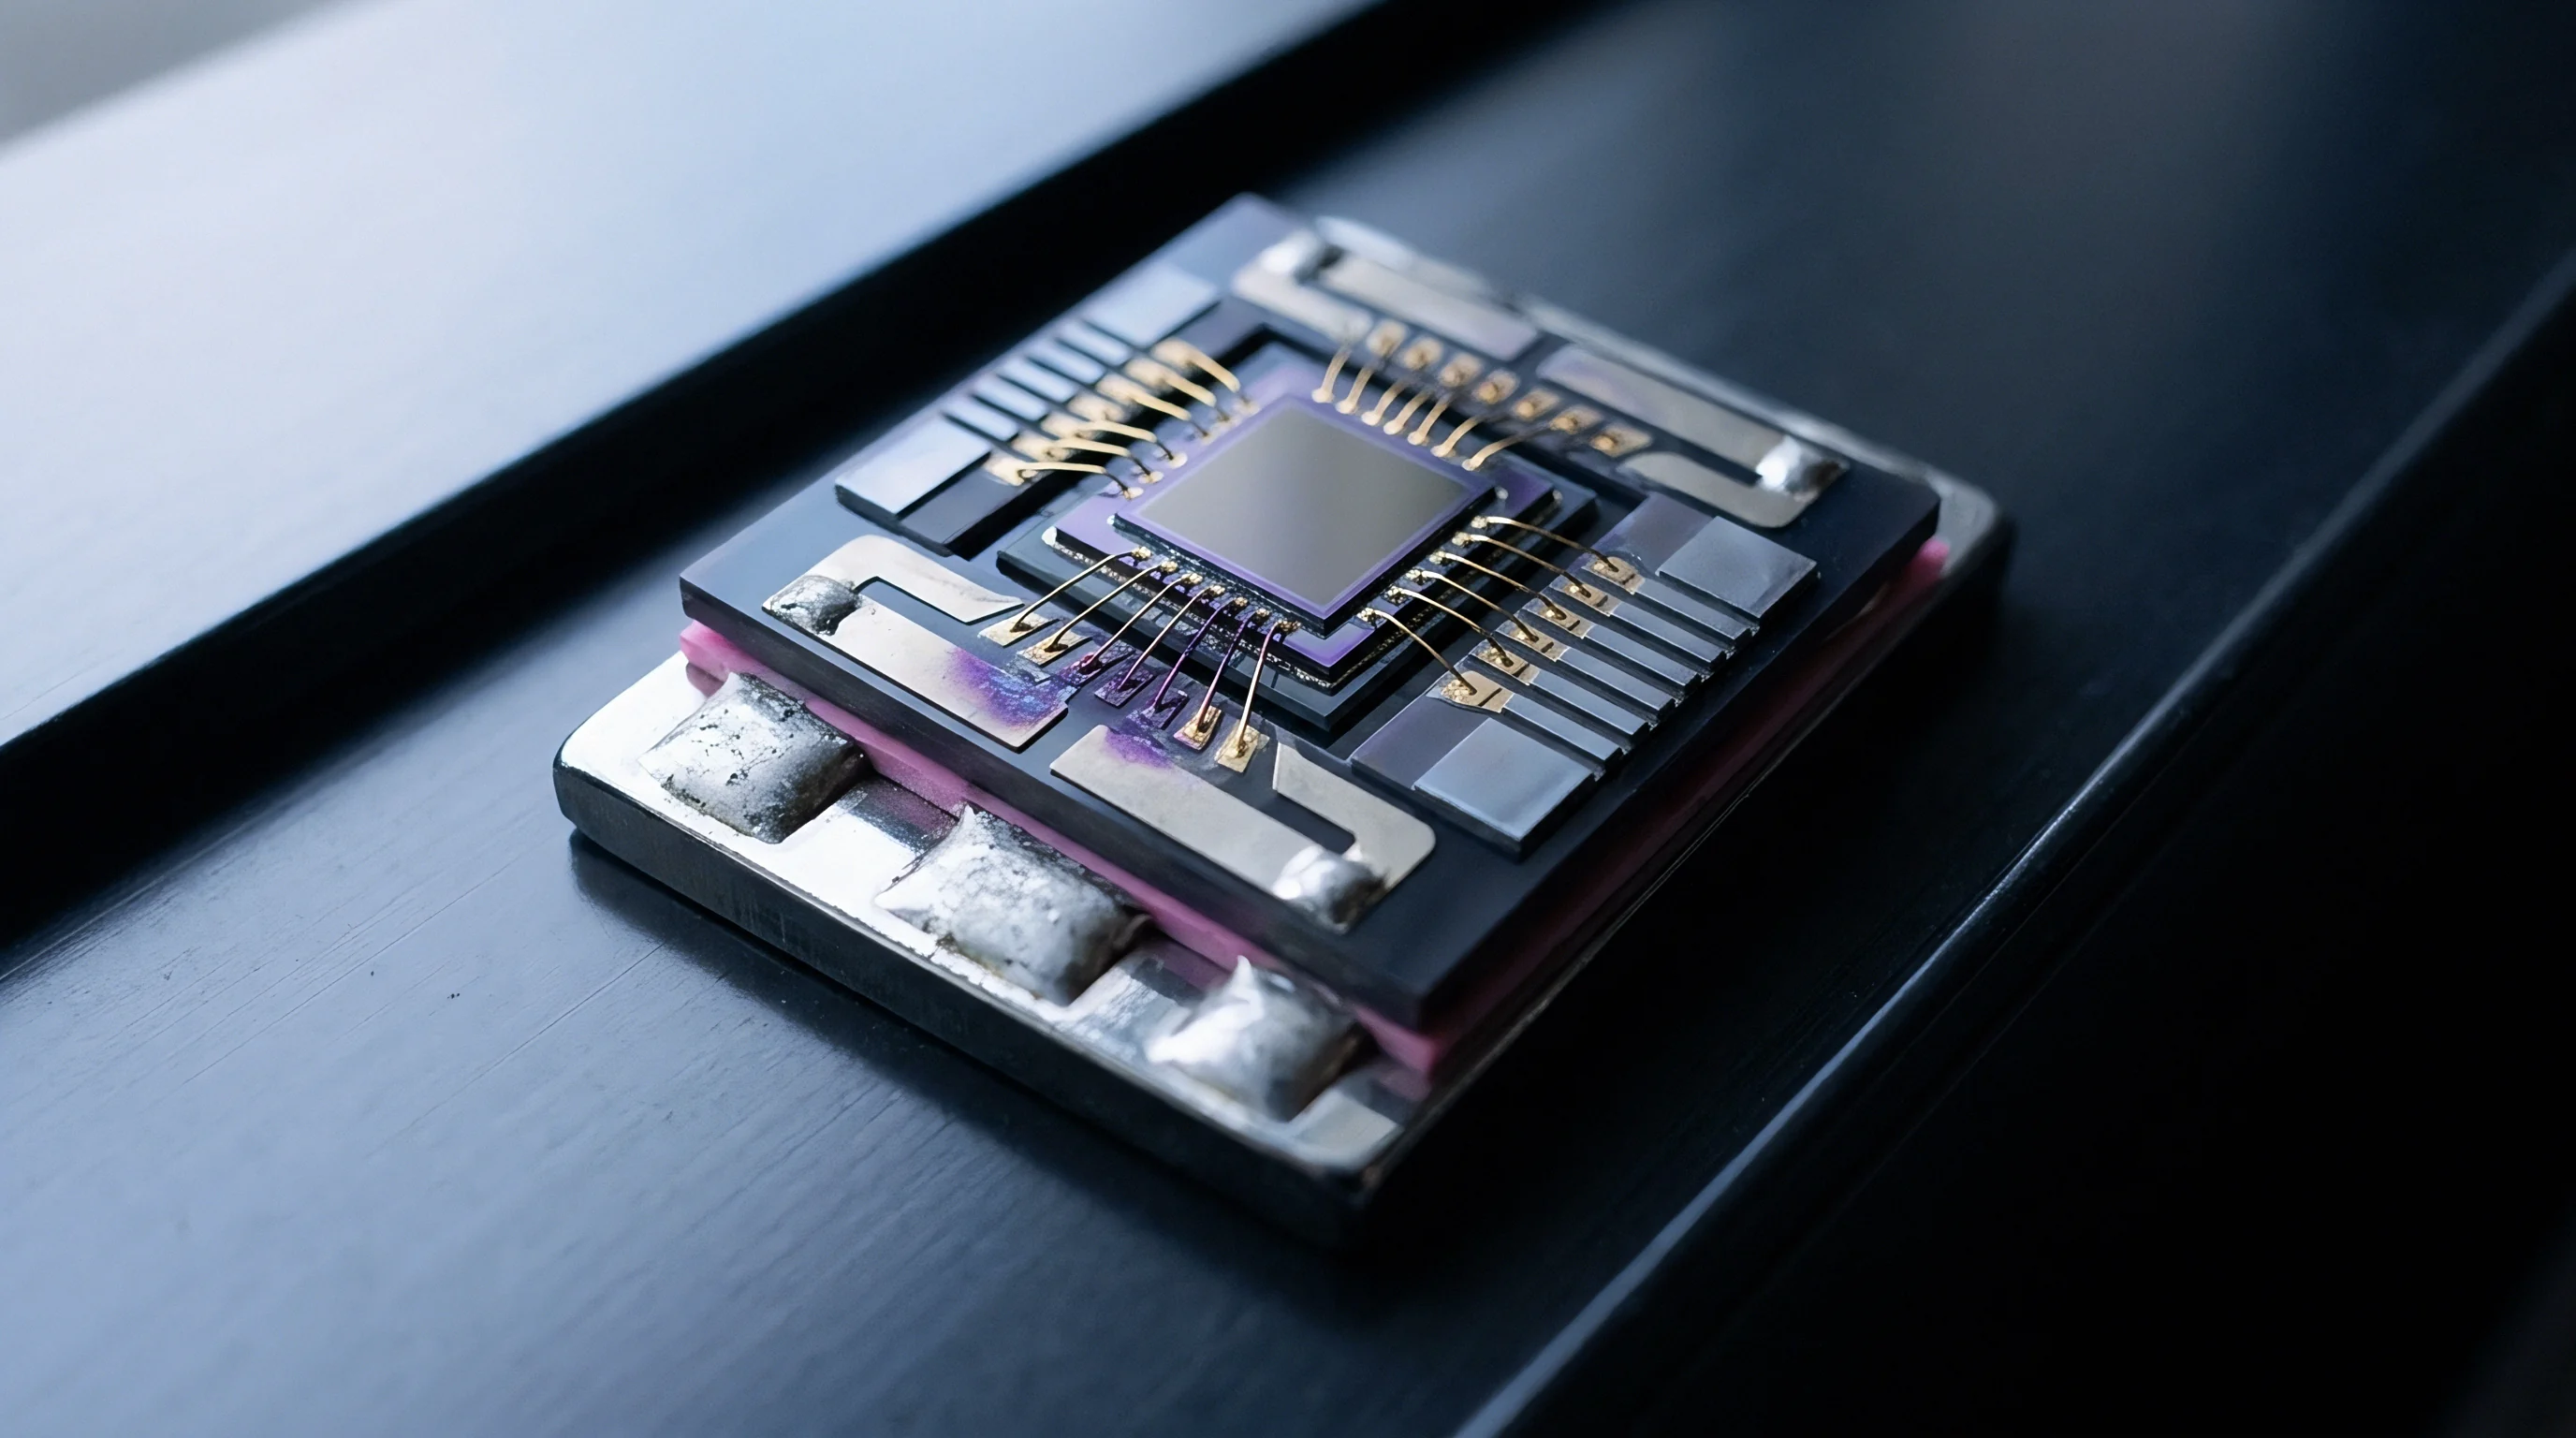
Lead-free solder joints in power electronics operate under continuous mechanical shear caused by thermal expansion mismatches between the semiconductor die and the copper substrate. Because silicon expands far less than copper, the intervening metallic joint absorbs this differential expansion through combined elastic, plastic, and creep deformation. Cyclic power loading and ambient thermal swings continually alter the crystallographic structure of the alloy: phase coarsening transforms fine eutectic microstructures into enlarged tin-rich grains and coarsened intermetallic compounds.
This microstructural migration redistributes internal stresses across the joint, shifting how the interconnect handles subsequent thermal cycles.
At elevated homologous temperatures, solder deformation proceeds via dislocation climb, grain boundary sliding, and lattice diffusion. Standard elastic-plastic stress formulations cannot capture this response because these alloys operate above half their absolute melting point even at room temperature. Under these conditions, creep deformation and rate-independent plastic slip occur concurrently, driving microstructural coarsening as shear stresses accumulate.
Accurate thermomechanical reliability modeling therefore treats these mechanisms as a unified, time-dependent inelastic process. In binary and ternary alloys like the tin-silver-copper system, initial solidification produces large beta-tin grains with strongly anisotropic elastic and thermal properties. A single beta-tin grain can exhibit an elastic modulus along its c-axis that is more than forty percent higher than along its a-axis, with matching directional disparities in thermal expansion.
As a result, thermal cycling generates pronounced micro-stresses across internal grain boundaries even without external substrate constraints.
Under sustained thermal cycling, high-energy grain boundaries migrate to minimize total interfacial energy. In regions where plastic strain concentrates, dynamic recrystallization breaks down the coarse initial grains into sub-micron crystallites. This localized grain refinement lowers the threshold for grain boundary sliding, speeding up inelastic strain accumulation during high-temperature dwell periods.
Accounting for this microstructural evolution provides the physical basis for unified viscoplastic constitutive modeling.
- Intermetallic Coarsening Ag3Sn and Cu6Sn5 precipitates grow during thermal aging, widening the distance between pinning sites and reducing resistance to dislocation motion.
- Recrystallization Driving Force Accumulated plastic work creates localized high dislocation density zones along grain boundaries, triggering dynamic recrystallization after critical strain thresholds.
- Anisotropic Strain Localization Neighboring beta-tin grains with misaligned principal crystallographic axes generate high interlaminar shear stresses during thermal transitions.
- Grain Boundary Sliding Diffusion-assisted displacement along crystal boundaries dominates deformation during high-temperature thermal dwell phases.
During deformation across lead-free interconnects, microstructural changes continuously shift the internal state of the alloy. Hardening mechanisms operating during rapid temperature ramps compete directly with recovery mechanisms operating during extended dwell periods. If the rate of dislocation annihilation through recovery exceeds the rate of dislocation multiplication through plastic shear, the material softens.
Conversely, rapid temperature transients generate dislocation tangles that increase instantaneous flow stress.
A solder joint operating above half its absolute melting point undergoes simultaneous dislocation slip and diffusion-assisted recovery during every thermal transient.
Predicting the fatigue life of metallic die attach layers requires constitutive models that explicitly track these evolving microstructural states without artificially splitting plastic deformation from creep strain. The spatial distribution of this damage dictates where macroscopic cracks will nucleate within the solder volume. Whether microstructural grain growth reaches a steady state prior to crack initiation remains an open question in reliability physics.

Kinetics
Modeling time-dependent inelastic deformation in solder interconnects requires unified constitutive equations that avoid arbitrary divisions between strain hardening and stress relaxation. The Anand viscoplastic model achieves this by using a single scalar internal state variable ~ deformation resistance ~ to represent the isotropic resistance of the microstructure to plastic flow. This eliminates the need to calculate rate-independent plastic strain and time-dependent creep strain separately, tracking all non-recoverable deformation in a single inelastic strain variable.
The constitutive framework relies on two primary equations: an flow equation governing the rate of inelastic strain accumulation, and an evolution equation governing changes in the internal state variable. The flow equation expresses the inelastic strain rate as a function of equivalent stress, absolute temperature, and the internal state variable:
inelastic strain rate = A exp(-Q / (R T)) ^(1 / m)
In this equation, A represents the pre-exponential factor, Q is the activation energy for plastic flow, R is the universal gas constant, T is absolute temperature, xi is the stress multiplier, s is the deformation resistance state variable, and m is the strain rate sensitivity exponent. The stress multiplier scales the equivalent stress relative to the current internal resistance of the crystal matrix.
The internal state variable s evolves dynamically during thermal loading according to the rate of inelastic strain accumulation and the current state relative to a dynamic saturation value:
ds/dt = { h0 | 1 – s / s |^a sign( 1 – s / s ) } inelastic strain rate
Here, h0 is the hardening or softening constant, a is the strain rate sensitivity exponent of hardening, and s is the saturation value of deformation resistance for a given strain rate and temperature. The saturation value s is itself governed by a secondary relation:
s = s_hat ^n
where s_hat is the coefficient for saturation deformation resistance, and n is the strain rate sensitivity exponent for the saturation state. An initial value of deformation resistance, s0, completes the nine-parameter set necessary to execute numerical simulations using the Anand model.
| Parameter Description | Symbol (Units) | SAC305 (96.5Sn3.0Ag0.5Cu) | SAC105 (98.5Sn1.0Ag0.5Cu) | Au80Sn20 (80Au20Sn) |
|---|---|---|---|---|
| Initial Deformation Resistance | s0 (MPa) | 21.41 | 18.30 | 45.20 |
| Activation Energy / Gas Constant | Q / R (K) | 9970 | 9430 | 14200 |
| Pre-exponential Factor | A (1/s) | 4.0E+06 | 3.2E+06 | 1.1E+07 |
| Stress Multiplier | xi (dimensionless) | 4.00 | 4.50 | 3.10 |
| Strain Rate Sensitivity (Stress) | m (dimensionless) | 0.25 | 0.27 | 0.18 |
| Hardening / Softening Constant | h0 (MPa) | 1325.0 | 1100.0 | 2800.0 |
| Saturation Coefficient | s_hat (MPa) | 80.42 | 72.10 | 155.00 |
| Strain Rate Sensitivity (Saturation) | n (dimensionless) | 0.018 | 0.022 | 0.012 |
| Hardening Exponent | a (dimensionless) | 1.50 | 1.45 | 1.80 |
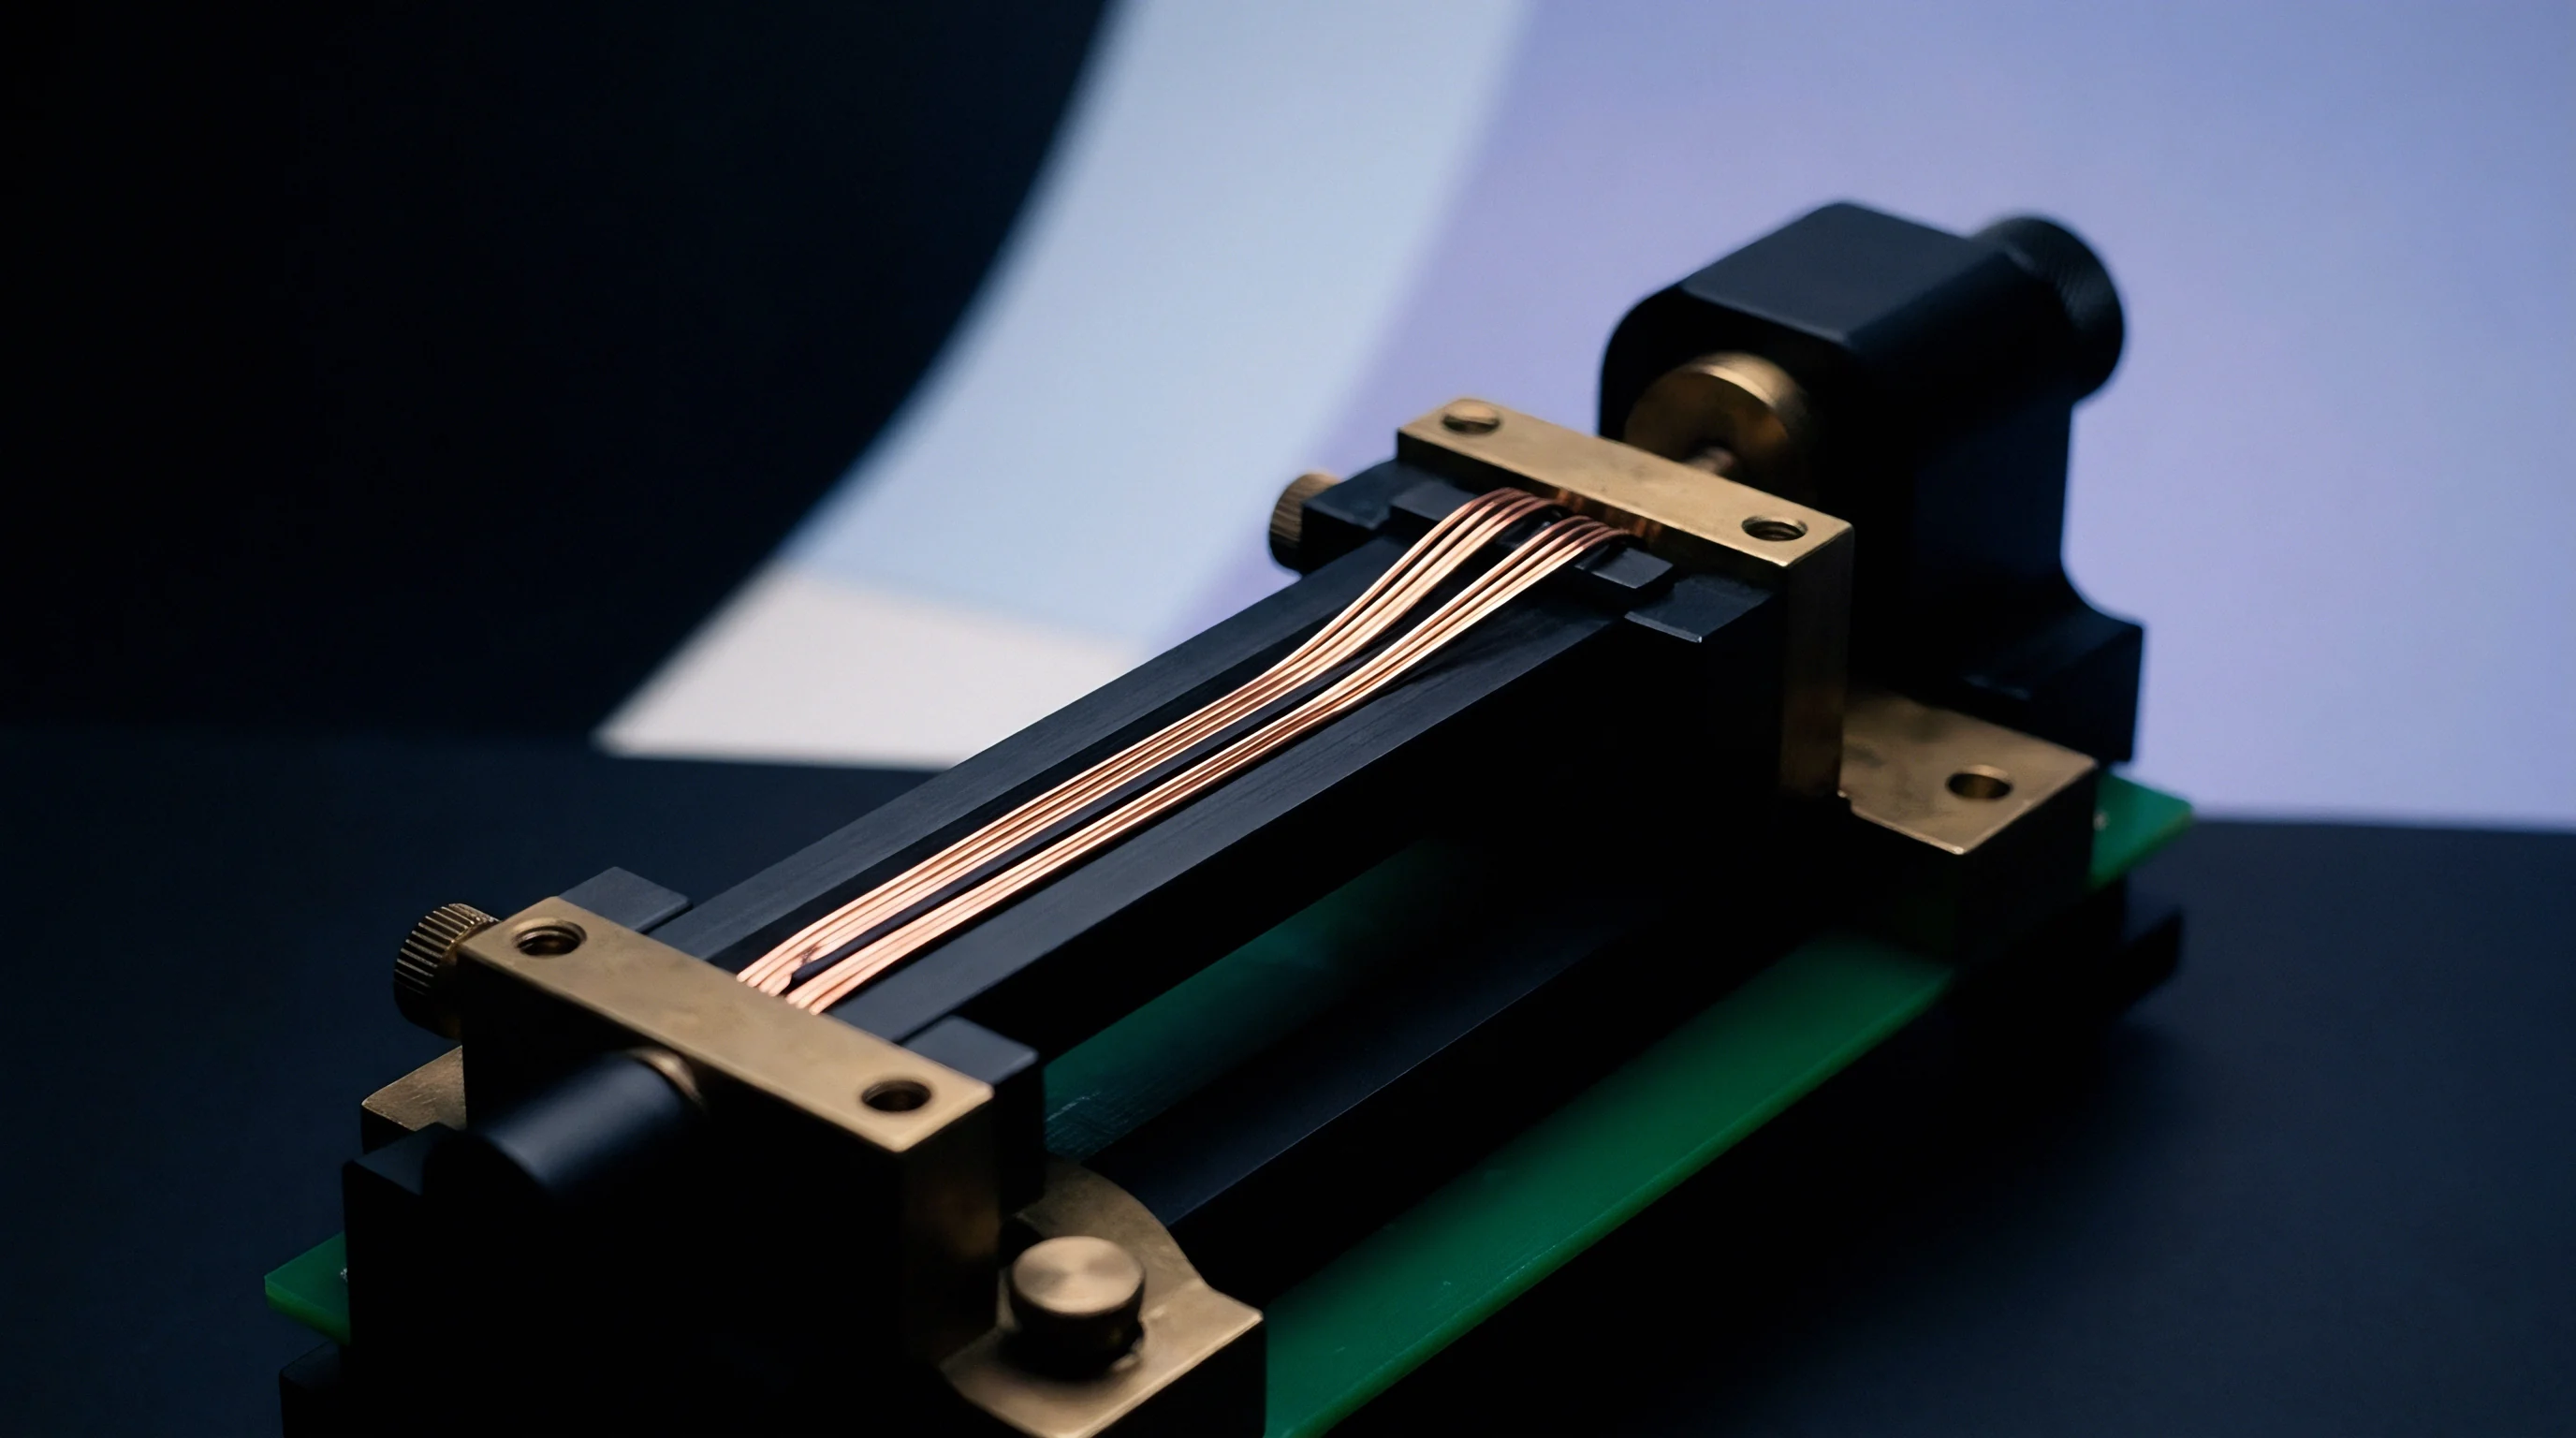
Extracting these parameters requires running constant strain rate tensile tests across multiple temperatures and strain rates alongside strain-rate jump tests. Regressions performed on narrow datasets often yield non-unique parameter sets that diverge significantly when applied outside the experimental test envelope. Reliable finite element predictions require parameter fits derived from testing across the full operating temperature range.
Because these nine parameters are coupled within numerical routines, an error in activation energy Q miscalculates the temperature sensitivity of the strain rate, skewing predicted stress relaxation during dwell periods. Overestimating Q artificially amplifies thermal sensitivity, causing simulations to overpredict plastic strain during high-temperature excursions.
- Execute Monotonic Tensile Tests Test standardized sub-size solder specimens across five temperatures ranging from negative forty degrees Celsius to one hundred fifty degrees Celsius under four distinct strain rates.
- Extract Steady State Stress Values Determine saturation stress levels from true stress-strain curves at each temperature and strain rate combination to establish initial estimates for s_hat and n.
- Calculate Activation Energy Ratio Regress the natural logarithm of normalized strain rates against inverse absolute temperatures to fix the Q over R thermal scaling parameter.
- Optimize Hardening Parameters Fit the evolutionary parameters h0 and a using the transient non-linear portions of the stress-strain curves prior to saturation.
During temperature dwells, stress relaxes while inelastic deformation keeps accumulating as elastic strain converts into viscoplastic shear. The Anand formulation captures this transition by adjusting deformation resistance s as equivalent stress decays toward equilibrium.
Traditional creep equations can match steady-state test results without the complexity of a nine-parameter viscoplastic model, but that approach ignores stress-history effects during fast thermal ramps, where plastic slip outpaces steady-state secondary creep.
Fatigue
Each thermal cycle drives irreversible plastic and creep deformation within the solder interface. Dissipated plastic work generates heat while damage accumulates within the crystal lattice, eventually causing micro-void nucleation, coalescence, and fatigue crack growth along the die attach boundary.
Finite element solvers calculate the accumulated viscoplastic strain energy density per cycle by integrating the inner product of the stress tensor and inelastic strain rate tensor across critical solder elements:
delta W_acc = integral ( stress_ij d_epsilon_inelastic_ij / dt ) dt
Peak strain energy density consistently concentrates at the outer corners of the die attach layer, where the distance to the neutral point is largest. Package compliance, substrate stiffness, and bond line thickness dictate the severity of this localized strain concentration.
| Thermal Profile Extremes (°C) | Dwell Duration (min) | SAC305 delta W_acc (MPa) | SAC105 delta W_acc (MPa) | Au80Sn20 delta W_acc (MPa) |
|---|---|---|---|---|
| -40 to +125 | 10 | 0.425 | 0.512 | 0.115 |
| -40 to +125 | 30 | 0.588 | 0.695 | 0.142 |
| -55 to +150 | 10 | 0.812 | 0.964 | 0.230 |
| -55 to +150 | 30 | 1.145 | 1.320 | 0.298 |
Darveaux energy-based failure models relate the calculated inelastic strain energy density per cycle to crack initiation and crack propagation rates. The number of cycles to crack initiation N_0 and the crack growth rate per cycle da/dN are defined by empirical power-law relations:
N_0 = K1 ( delta W_acc )^K2
da/dN = K3 ( delta W_acc )^K4
The constants K1, K2, K3, and K4 represent crack growth correlation factors calibrated to specific finite element mesh dimensions and element layer thicknesses. Using parameters calibrated for a twenty-five micron element height on a fifty micron element height mesh introduces systematic numerical errors that corrupt life predictions.
Does Dwell Duration Dominate Viscoplastic Strain Accumulation?
Longer dwells at peak temperature allow stress relaxation to run further toward completion, converting stored elastic energy into additional viscoplastic strain work. However, strain energy accumulation slows exponentially as internal stress relaxes. As a result, tripling the dwell duration from ten to thirty minutes increases accumulated strain energy per cycle by only thirty to forty percent.
In large-area die attach layers, crack propagation accounts for the bulk of total fatigue life. Once cracks initiate at the corners and advance inward, the shrinking load-bearing area raises nominal stresses across the remaining solder, accelerating crack growth rates with each cycle.
An arbitrary reduction in finite element mesh size without recalibrating Darveaux crack growth coefficients alters calculated fatigue life by up to two hundred percent.
Using mismatched material constants or uncalibrated mesh dimensions skews fatigue life projections, leaving assemblies vulnerable to premature field failures that escape standard screening.
Failing to account for non-linear viscoplastic strain accumulation during early packaging design frequently results in field returns once thermal cycling pushes interfacial solder joints past their fatigue limits.

Chamber
Environmental test chambers replicate operating field stresses using programmed temperature ramps and dwell periods. Accelerated thermal cycling protocols evaluate die attach reliability by cycling fully packaged assemblies through hundreds or thousands of thermal transitions. The goal is to accelerate damage accumulation through steeper ramp rates and wider temperature extremes without triggering failure mechanisms unrepresentative of actual service conditions.
Ramp rates and dwell limits directly influence the viscoplastic response of the solder. Steep ramps ~ such as fifteen to twenty degrees Celsius per minute ~ induce sharp transient thermal gradients between the semiconductor die and the substrate. These gradients create flexural bending that superimposes normal peel stresses onto the primary shear strain field in the die attach layer.
Maintaining accurate test conditions requires careful sensor calibration and uniform airflow across board surfaces. Inadequate airflow creates thermal lag, causing heavy copper substrates to trail chamber air temperatures by several minutes. For this reason, dwell timing must be referenced to the physical solder joint temperature rather than the chamber control sensor.
- Attach micro-thermocouples directly to the metallic die edge and substrate underside using high-conductivity silver adhesive.
- Log temperature profiles at continuous sampling rates of at least two Hertz during maximum heating and cooling ramps.
- Verify that the thermal lag between chamber air sensors and physical solder joints remains below two degrees Celsius at steady-state dwell.
- Adjust profile dwell timers to ensure internal solder joint temperatures hold setpoint within specified tolerances for the full required duration.
Significant shifts in strain energy accumulation occur when dwell times extend beyond fifteen minutes. At elevated temperatures, the internal state variable s decreases due to microstructural recovery, softening the alloy and permitting continuous creep deformation under small residual stress fields. Conversely, low-temperature dwell periods at negative forty degrees Celsius feature high flow stresses where recovery processes freeze out completely, storing peak elastic energy within the structural assembly.
Thermal cycling profiles must guarantee that physical solder joint temperatures reach setpoint for the entire specified dwell duration regardless of ambient chamber sensor readings.
Accelerated test standards require tight control over thermal profile boundaries. Unintended variations in ramp rate or dwell timing alter the ratio of instantaneous plastic deformation to time-dependent creep, compromising the validity of acceleration models.
From a test efficiency perspective, extending dwell times once stress relaxation has largely completed adds test duration and cost without producing meaningful additional damage.

Inspection
Full-field displacement mapping across micro-scale solder joints requires non-contact optical measurements calibrated against physical standards. Digital image correlation tracks speckle patterns on polished assembly cross-sections during in-situ thermal cycling, generating 2D and 3D strain tensors across the bond line at sub-micron resolution.
High-temperature moiré interferometry provides an alternative optical approach by directing coherent laser light onto a high-frequency diffraction grating bonded to the specimen. As thermal expansion strains the assembly, the deformed grating forms interference fringes that map relative shear displacements across the joint thickness. Resolving fine strain gradients reliably requires careful control over optical distortion and thermal drift.
Aligning the reference grating against a monochromatic wavelength standard eliminates spatial magnification errors across thermal extremes. Temperature variations inside the optical measurement chamber introduce refractive index shifts in the surrounding air. Correcting for these thermal optical distortions requires mapping atmospheric optical paths using flat zero-expansion glass calibration targets across the entire operating thermal range.
| Uncertainty Component | Standard Uncertainty (µm) | Probability Distribution | Sensitivity Coefficient | Uncertainty Contribution (µstrain) |
|---|---|---|---|---|
| Spatial Magnification Scale | 0.012 | Normal (k=1) | 1.00 | 120 |
| Thermal Refractive Index Drift | 0.025 | Rectangular | 0.577 | 144 |
| Camera Sensor Thermal Noise | 0.008 | Normal (k=1) | 1.00 | 80 |
| Substrate Rigid Body Motion | 0.015 | Normal (k=1) | 0.866 | 130 |
| Combined Standard Uncertainty | – | Root Sum Square | – | 242 |
| Expanded Uncertainty (k=2) | – | Coverage Factor 2 | – | 484 |
Thermal cycling produces a variance of roughly six percent in crack initiation cycles. Capturing subtle strain gradients across thin solder layers requires high optical magnification, where a single pixel corresponds to less than five hundred nanometers of physical displacement. At this resolution, out-of-plane rigid body motions of the specimen frame mimic shear strains, generating artificial strain signals unless dual-camera stereoscopic digital image correlation architectures are integrated into the test bench.
Calibrating optical strain systems against certified reference artifacts provides traceable baseline data for validating Anand finite element models. If experimental strain inputs are uncalibrated, numerical models calibrated against them will systematically mispredict fatigue life in field service.
- Spatial Calibration Certificate Optical systems require traceable physical scale calibration according to ISO/IEC 17025 accredited procedures prior to thermal strain acquisition runs.
- Out of Plane Motion Compensation Dual-camera stereoscopic arrangements must quantify and subtract rigid body translation artifacts from in-plane shear deformation tensors.
- Pattern Density Metrics Speckle patterns applied to solder cross-sections must maintain minimum feature sizes of three to five pixels to prevent aliasing errors during cross-correlation analysis.
- Thermal Drift Correction Baseline optical subtraction routines must execute image corrections using zero-expansion quartz reference substrates across the full temperature range.
Optical displacement measurements executed without thermal refraction compensation yield false shear strain readings across sub-micron die attach interfaces.
To meet ISO 17025 section 7.8 requirements, test reports must include expanded uncertainty figures alongside measured strain values. Reporting raw strain data without its associated coverage factor and calibration baseline undermines its technical validity during qualification reviews.

Expenditure
Selecting die attach alloys requires balancing upfront material costs against potential warranty exposure. High-lead solders like 95Pb5Sn offered low alloy cost and strong fatigue resistance for decades, but regulatory mandates have largely phased them out. High-gold alloys such as 80Au20Sn provide exceptional creep resistance and thermal stability, yet their raw material cost restricts them primarily to mission-critical aerospace, defense, and optoelectronic assemblies.
For high-volume commercial hardware, lead-free options like SAC305 and SAC105 are the standard compromise, despite higher sensitivity to cyclic viscoplastic fatigue. Low-silver alloys cut bill-of-materials costs, but their lower yield strengths lead to greater plastic strain accumulation per cycle, reducing overall thermal fatigue life by twenty to thirty percent relative to SAC305.
Characterizing solder viscoplasticity carries significant upfront engineering cost. Running the full test matrix ~ monotonic tensile tests across temperatures and strain rates, stress relaxation runs, and rate-jump tests ~ to fit all nine Anand parameters requires dedicated test fixtures and substantial lab time, typically running twenty-five thousand to forty-five thousand dollars per alloy.
Relying on generic datasheet values rather than extracted viscoplastic parameters introduces real financial risk. If a power module suffers die attach fatigue in the field, warranty claims, field recalls, and customer churn quickly outweigh the cost of proper material characterization.
Simulation pipelines help balance these engineering trade-offs during early design phases. Accurate Anand parameters enable packaging engineers to optimize bond line thickness, select substrate metallizations, and refine layout geometry before committing to tooling. Investing in traceably calibrated viscoplastic modeling shifts reliability validation upstream, replacing iterative hardware respins with predictive simulation.