Thermoset Crosslink Density Mechanics in Microelectronic Die Attach Adhesives
Crosslink density controls die attach modulus, glass transition, and interfacial shear stress, dictating thermal cycle fatigue life in microelectronic packages.

Resin
Polymer formulation in semiconductor packaging balances reactive functionality against vitrification limits. Die attach adhesives rely on crosslinking thermoset matrices to bond semiconductor dies to metallic leadframes, ceramic substrates, or organic laminates. Crosslink density represents the concentration of covalent junction points joining polymer chains into a three-dimensional macromolecular lattice.
This structural parameter governs the physical characteristics of the adhesive layer, setting its glass transition temperature, storage modulus, thermal expansion coefficient, and resistance to cohesive rupture.
Epoxy resins remain the dominant base chemistry for conductive and non-conductive die attach pastes. Diglycidyl ethers of bisphenol-A and bisphenol-F offer balanced viscosity and wetting behavior, while cycloaliphatic epoxies and epoxy novolacs supply elevated functional group density per unit volume. Epoxy novolacs, possessing an average epoxide functionality between 2.5 and 3.8 per oligomer chain, generate dense molecular grids upon reaction with polyfunctional hardeners.
Phenolic novolac hardeners and aromatic amines yield tight, rigid networks capable of maintaining mechanical integrity past two hundred degrees Celsius. Anhydride curatives produce ester linkages that offer lower melt viscosities and extended working life, though their sensitivity to moisture hydrolysis limits deployment in non-hermetic packages.
Bismaleimide formulations provide an alternate chemical route for applications demanding thermal stability beyond the reach of standard epoxies. Maleimide rings undergo addition polymerization via free-radical mechanisms or react with coreactants such as diallyl bisphenol-A through ene reactions and Diels-Alder additions. The resulting polybismaleimide structure achieves crosslink densities exceeding 3500 moles per cubic meter.
These densely crosslinked structures prevent chain slippage under extreme thermal loads. Bismaleimides retain modulus at elevated temperatures. Cyanate ester resins polymerize through cyclotrimerization of cyanate groups to form symmetric triazine rings.
This trimerization reaction proceeds with high conversion efficiency, generating an oxygen-linked aromatic lattice that exhibits low moisture uptake and stable dielectric properties across high frequencies. Cyanate esters exhibit low dielectric loss.
Cyanate ester cyclotrimerization achieves a crosslink density of 4200 moles per cubic meter at 220 degrees Celsius after two hours of isothermal dwell.

Monomer Architecture and Gelation Thresholds
Thermoset cure conversion progresses through distinct rheological states governed by molecular architecture. In a stoichiometric blend of bifunctional epoxy monomers and tetrafunctional amine crosslinkers, addition reactions increase average molecular weight until reaching the gel point. The classical Flory-Stockmayer criterion defines this threshold by the critical conversion ratio of reactive groups:
αgel = 1 / 1/2
In this relationship, r denotes the stoichiometric ratio of reactive groups and f represents the functionality of the branch units. For a stoichiometric mixture of a difunctional epoxy and a tetrafunctional amine, gelation occurs when conversion reaches fifty-eight percent. Below this gelation boundary, the formulation behaves as a viscous liquid capable of flow, fillet formation, and substrate wetting.
Once the system crosses the gel point, an infinite macromolecular cluster spans the bond line. The loss factor tan delta, defined as the ratio of loss modulus to storage modulus, exhibits frequency-independent behavior at this exact juncture. Gelation freezes the gross macro-conformation of the die attach adhesive, after which further conversion amplifies network density without permitting gross liquid flow.

Conversion Kinetics and Vitrification Mechanics
Differential scanning calorimetry traces heat flow during ring-opening and addition polymerizations. The total exothermic reaction enthalpy, typically between 100 and 130 kilojoules per mole of epoxide groups, serves as the reference state for complete conversion. When the adhesive cures isothermally at a temperature below its ultimate glass transition temperature, conversion proceeds rapidly until the rising glass transition temperature of the reacting mixture approaches the cure temperature.
At this stage, vitrification intervenes. The transformation from a rubbery gel to a glassy solid reduces molecular mobility by three to four orders of magnitude. Epoxy conversions reach eighty percent.
Vitrification transitions the reaction from kinetic control to diffusion control. Unreacted functional groups become trapped within a rigid matrix, severely suppressing reaction rates and leaving residual uncured monomer fractions unless an elevated post-cure bake is applied. The DiBenedetto equation establishes the relationship between chemical conversion and glass transition shift:
(Tg – Tg0) / (Tg∞ – Tg0) = (λ α) /
Here, Tg0 represents the glass transition temperature of the unreacted monomer, Tg∞ is the glass transition temperature of the fully crosslinked polymer, α represents fractional conversion, and λ is a structural parameter relating the heat capacity step at Tg0 to that at Tg∞. In high-density die attach formulations, λ ranges between 0.35 and 0.55. If a manufacturing thermal profile truncates the cure cycle before vitrification resolves, the resulting bond line retains depressed crosslink density.
Unreacted monomers plasticize the cured adhesive. Storage temperatures govern monomer conversion kinetics.
| Resin Chemistry | Functional Hardener | Conversion at Gel Point | Crosslink Density Range (mol/m³) | Glass Transition Temperature (°C) | Rubbery Modulus at Tg+40°C (MPa) |
|---|---|---|---|---|---|
| Bisphenol-F Epoxy | Aromatic Amine | 0.58 | 1800 – 2400 | 130 – 155 | 18 – 26 |
| Epoxy Novolac | Phenolic Novolac | 0.48 | 2800 – 3600 | 170 – 210 | 32 – 45 |
| Bismaleimide (BMI) | Diallyl Bisphenol-A | 0.52 | 3200 – 4100 | 220 – 260 | 40 – 58 |
| Cyanate Ester | Transition Metal Catalyst | 0.67 | 3800 – 4600 | 230 – 275 | 48 – 65 |
| Epoxy-Acrylate Hybrid | Aliphatic Amine / Peroxide | 0.42 | 1200 – 1700 | 90 – 120 | 11 – 17 |
A post-mold cure bake running at 175 degrees Celsius drives conversion past ninety-five percent, stabilizing crosslink density across subsequent packaging assembly processes. Without this complete thermal conversion, subsequent reflow soldering passes activate latent reactive sites, inducing unpredictable shrinkage and warpage shifts in the field.

Modulus
Dynamic mechanical analyzers apply oscillatory shear or tensile displacement to measure storage response. The instrument records storage modulus E’, loss modulus E”, and tan delta across a thermal sweep from minus sixty-five degrees Celsius to three hundred degrees Celsius. Below the glass transition zone, the die attach material resides in the glassy state, where mechanical stiffness originates from interatomic bond stretching and torsional potential barriers.
In this regime, storage modulus values range from 3 to 12 GPa depending on filler loading. As temperature traverses the glass transition zone, cooperative segmental motion unlocks along the polymer backbone, causing storage modulus to plummet by two to three orders of magnitude.
Above the transition zone lies the rubbery plateau. In this high-temperature region, crosslink junctions prevent macroscopic chain flow, storing elastic energy through conformational entropy reduction during deformation. The magnitude of the rubbery storage modulus correlates directly with the density of covalent junction points per unit volume.
The kinetic theory of rubber elasticity defines the relationship between the equilibrium rubbery tensile modulus E’rubbery and crosslink density νe:
E’rubbery = 3 νe R T = 3 (ρ / Mc) R T
In this equation, R represents the universal gas constant, T is absolute temperature in Kelvin, ρ represents polymer mass density, and Mc is the number-average molecular weight between adjacent crosslink sites. Measuring E’rubbery at forty degrees Celsius above the tan delta peak yields an accurate calculation of crosslink density. Solvents also probe this lattice structure; Flory-Rehner equilibrium swelling measurements in acetone or tetrahydrofuran determine Mc through volumetric expansion ratios, corroborating dynamic mechanical calculations without relying on viscoelastic models.
Equilibrium swelling takes twenty-four hours.
Affine Elasticity and Molecular Chain Weight
Kinetic theories treat rubbery polymers as assemblies of flexible segments anchored at junction points. When an external force strains the bulk adhesive, an affine deformation model assumes that the junction displacement vectors scale proportionally with macroscopic dimensions. The Phantom Network model relaxes this assumption, allowing junction points to fluctuate around mean positions within confining cages formed by neighboring chains.
In densely crosslinked microelectronic adhesives, junction fluctuations become sterically constrained, causing the affine model to predict experimental rubbery moduli with high fidelity. As Mc decreases below 500 grams per mole, chain stiffness effects depart from Gaussian statistics, necessitating non-Gaussian inverse Langevin corrections to account for finite chain extensibility under high strain.

Can Viscoelastic Relaxation Compensate Crosslink Embrittlement?
Sub-ambient storage response measurements confirm elevated stiffness in densely coupled polymers. Increasing crosslink density restricts local free volume, shifting both the glass transition and secondary sub-Tg beta relaxations toward higher temperatures. Secondary relaxations stem from local crank-shaft motions of aliphatic segments or glycidyl ether linkages.
Suppressing these modes severely degrades the fracture toughness K1c of the adhesive matrix. Densely crosslinked neat epoxies frequently exhibit critical stress intensity factors below 0.8 MPa·m1/2, predisposing the material to catastrophic brittle cleavage at fillet corners. Formulations balance this brittleness by incorporating rubber-toughening agents, such as core-shell rubber particles or carboxyl-terminated butadiene-acrylonitrile elastomers, which generate localized shear banding without depressing the crosslink density of the continuous phase.
- Interfacial delamination propagates along the boundary between the adhesive and leadframe metallization under thermal shear strain when crosslink density exceeds 4000 moles per cubic meter.
- Cohesive fillet fracture initiates at microscopic voids within the adhesive meniscus during temperature cycling, running through regions where elevated crosslink density prevents plastic yield relaxation.
- Die cracking occurs in large-area silicon dies when high rubbery modulus adhesives freeze in extensive thermal mismatch stresses during cooling from wire-bond temperatures.
- Filler decoupling develops when strain mismatches between high-modulus silver flakes and an over-crosslinked polymer matrix tear the resin away from particle surfaces.
Whether viscoelastic relaxation rates can be preserved through tailored oligomer backbone flexibility while maintaining crosslink density targets remains an unresolved question in low-stress packaging formulation.

Stress
Differential contraction between silicon and copper leadframes generates mechanical strain during post-mold cool-down. Silicon exhibits an in-plane coefficient of thermal expansion between 2.6 and 3.2 ppm/K, whereas copper leadframes exhibit an expansion coefficient near 16.5 ppm/K. Organic bismaleimide-triazine laminates range from 14 to 17 ppm/K in their x-y axes. The die attach adhesive layer, situated between these contracting materials, accommodates the resulting thermal mismatch displacement.
The magnitude of thermomechanical stress generated within the package couples directly to the adhesive crosslink density through its influence on modulus and thermal expansion characteristics.
Below the glass transition, the coefficient of thermal expansion, denoted α1, ranges from 25 to 50 ppm/K for silver-filled pastes. Above the glass transition, the expansion coefficient α2 expands to values between 90 and 180 ppm/K. Crosslink density dictates the transition temperature demarcating α1 from α2. A low crosslink density reduces Tg, shifting a larger portion of the operating temperature envelope into the high-expansion α2 zone.
Elevated crosslink density elevates Tg beyond operating limits, maintaining the adhesive in the lower-expansion α1 regime but locking in higher elastic storage moduli across the entire application range. Thermal stress scales with assembly length.
Increasing crosslink density elevates glass transition temperatures while simultaneously amplifying brittle interfacial shear fracture during thermal cycling.

CTE Mismatch and Fillet Concentration Profiles
Silicon exhibits a linear thermal expansion rate near three parts per million per Kelvin. The thermal stress accumulated during cooling from cure temperature down to ambient conditions follows a path-dependent integral:
σ(x) = ∫T / dT
In this expression, t represents layer thickness, E denotes Young’s modulus, Gadh is the shear modulus of the adhesive, and f(x) describes the spatial variation of shear stress across the die footprint. Suhir’s solution for tri-material microelectronic assemblies reveals that shear stresses remain near zero at the neutral center of the die and escalate exponentially toward the die margins, reaching absolute peaks at the corners. High crosslink density increases Gadh across the entire thermal span, suppressing the shear compliance required to mitigate interfacial shear loading.
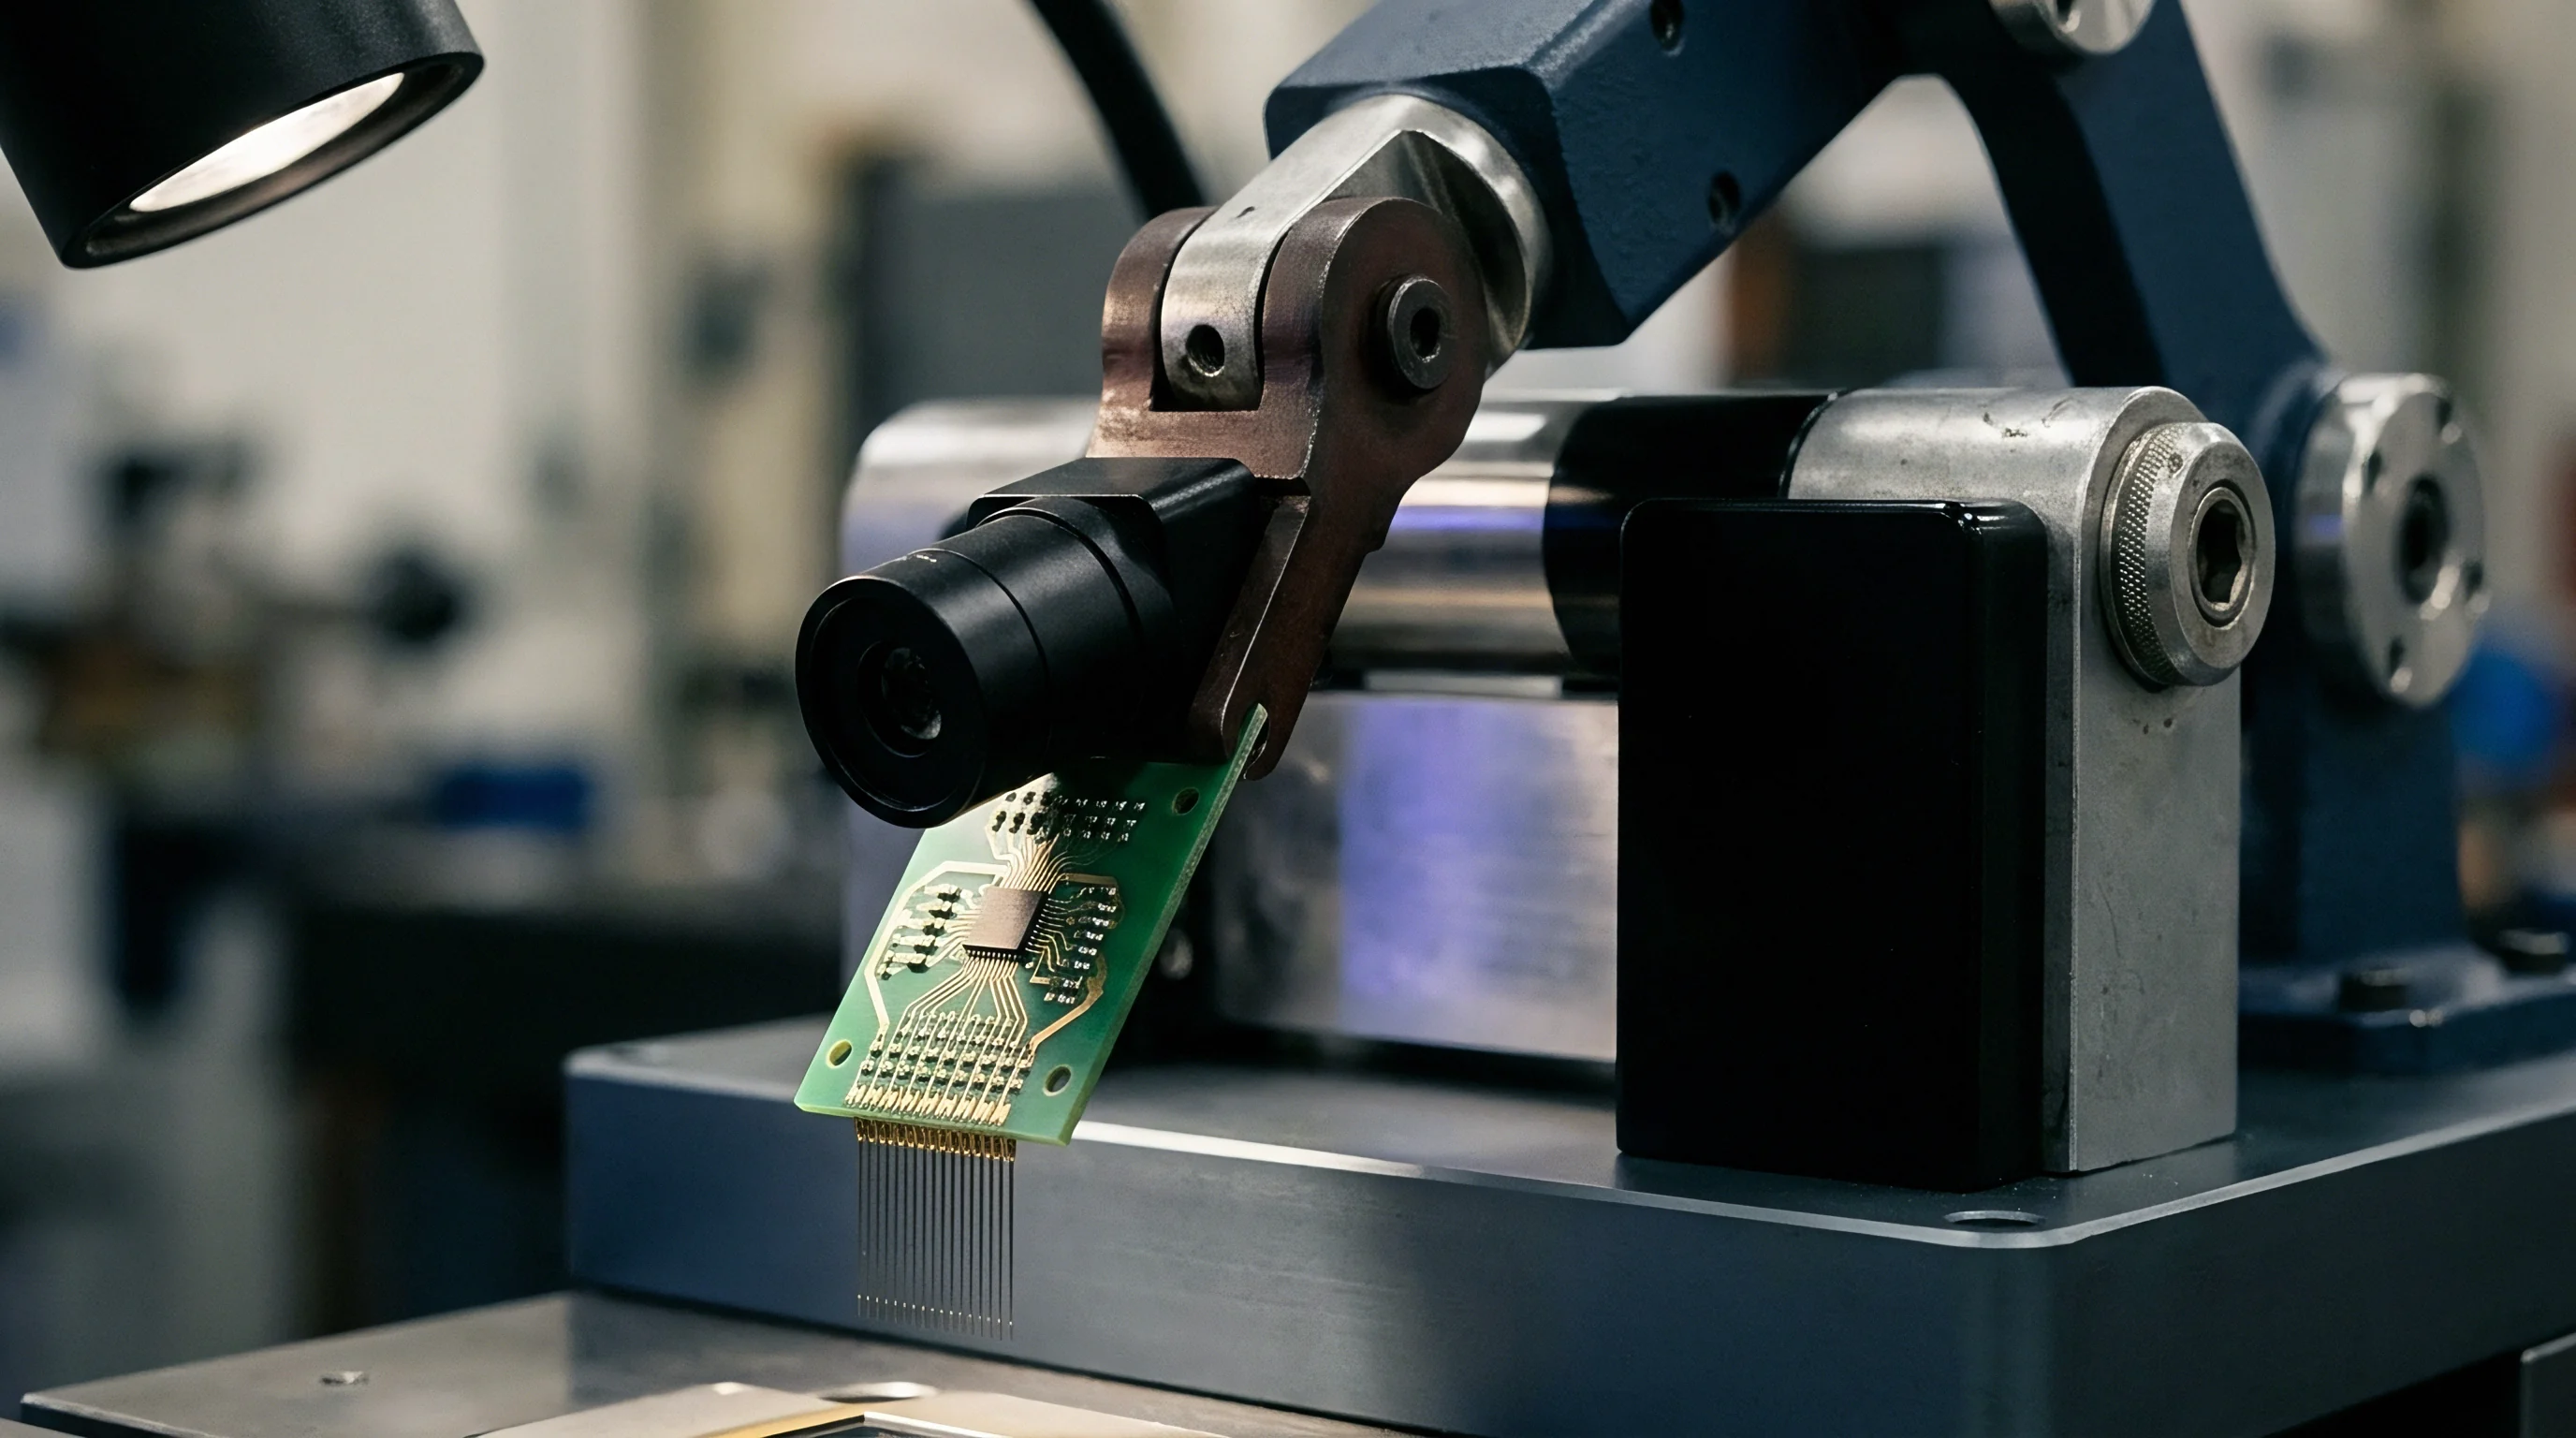
Shear loads concentrate at die corners.
Will Modulus Plateau Shifts Predict Delamination Margins?
Interfacial shear forces reach their maximum at the peripheral corners of rectangular dies. When thermal cycling drives packages through temperatures traversing the rubbery plateau, changes in the rubbery modulus shift the stress neutral axis. Measuring strain energy release rate G across temperature reveals whether an adhesive can withstand cyclic packaging shear without interfacial separation.
Delamination initiates when the strain energy release rate exceeds the critical interfacial fracture toughness Gc:
G = / (2 Gadh) + / (2 Edie)
Elevating crosslink density increases Gadh in the rubbery zone, which decreases the stored shear strain energy per unit volume at elevated temperatures. This modification simultaneously increases room-temperature glassy modulus and thermal cure shrinkage. Cure shrinkage in epoxies spans 1.5 to 4.5 volume percent, producing intrinsic tensile stresses prior to thermal cycling.
The increased shrinkage stress directly lowers the margin against peel delamination at die corners. Voids alter interfacial stress distributions.
Executing an analytical stress evaluation requires a sequential calculation sequence that accounts for both the temperature dependence of the viscoelastic modulus and the shrinkage strain accumulated during matrix vitrification.
- Quantify the volumetric cure shrinkage of the formulation by comparing liquid density at dispensing to solid density following post-mold cure using gas pycnometry per ASTM D792.
- Establish the master storage modulus curve across the entire operating spectrum by performing dynamic mechanical analysis from minus sixty-five degrees Celsius to two hundred and sixty degrees Celsius at a scan rate of two degrees per minute.
- Measure the coefficient of thermal expansion below and above the glass transition using thermomechanical analysis with an expansion probe loaded at five millinewtons per IPC-TM-650 Method 2.4.24.
- Compute the temperature-dependent shear stress distribution along the die-adhesive interface using numerical finite element routines or closed-form Suhir approximations that incorporate the measured modulus spectrum.
- Compare the calculated interfacial shear and peel stresses at die corners against the critical interfacial fracture energy measured via blister testing or end-notched flexure testing.
| Property Parameter | Test Condition | Low Density (<1500 mol/m³) | Medium Density (2000-3000 mol/m³) | High Density (>3800 mol/m³) |
|---|---|---|---|---|
| Glass Transition Temperature (°C) | DMA, tan δ peak at 1 Hz | 95 – 115 | 140 – 175 | 210 – 255 |
| Storage Modulus at -40°C (GPa) | DMA, 1 Hz oscillatory tensile | 4.2 – 5.5 | 6.8 – 8.5 | 9.5 – 12.8 |
| Storage Modulus at 25°C (GPa) | DMA, 1 Hz oscillatory tensile | 3.1 – 4.2 | 5.2 – 6.6 | 7.8 – 9.9 |
| Rubbery Modulus at Tg+40°C (MPa) | DMA, equilibrium plateau | 8.5 – 14.0 | 22.0 – 35.0 | 45.0 – 68.0 |
| Thermal Expansion Alpha-1 (ppm/K) | TMA, expansion mode, -40 to +60°C | 45 – 58 | 35 – 44 | 26 – 34 |
| Thermal Expansion Alpha-2 (ppm/K) | TMA, expansion mode, above Tg | 140 – 185 | 110 – 135 | 85 – 105 |
| Volumetric Cure Shrinkage (%) | Gas pycnometry, 25°C | 1.2 – 1.8 | 2.4 – 3.2 | 3.8 – 4.9 |
| Die Shear Strength at 25°C (MPa) | MIL-STD-883 Method 2019, 2×2 mm die | 18 – 24 | 28 – 36 | 32 – 42 |
| Die Shear Strength at 260°C (MPa) | MIL-STD-883 Method 2019, hot shear | 1.2 – 2.1 | 3.8 – 5.5 | 7.2 – 11.0 |
| Test conditions specify silver filler loading at seventy-five weight percent on copper leadframe substrates with a bond line thickness of twenty-five micrometers. | ||||
Omitting thermal-mechanical stress modeling during adhesive formulation selection causes premature package destruction through corner cracking, lift-off during wire bonding, or massive silicon fracture during temperature cycling verification.
Fillet
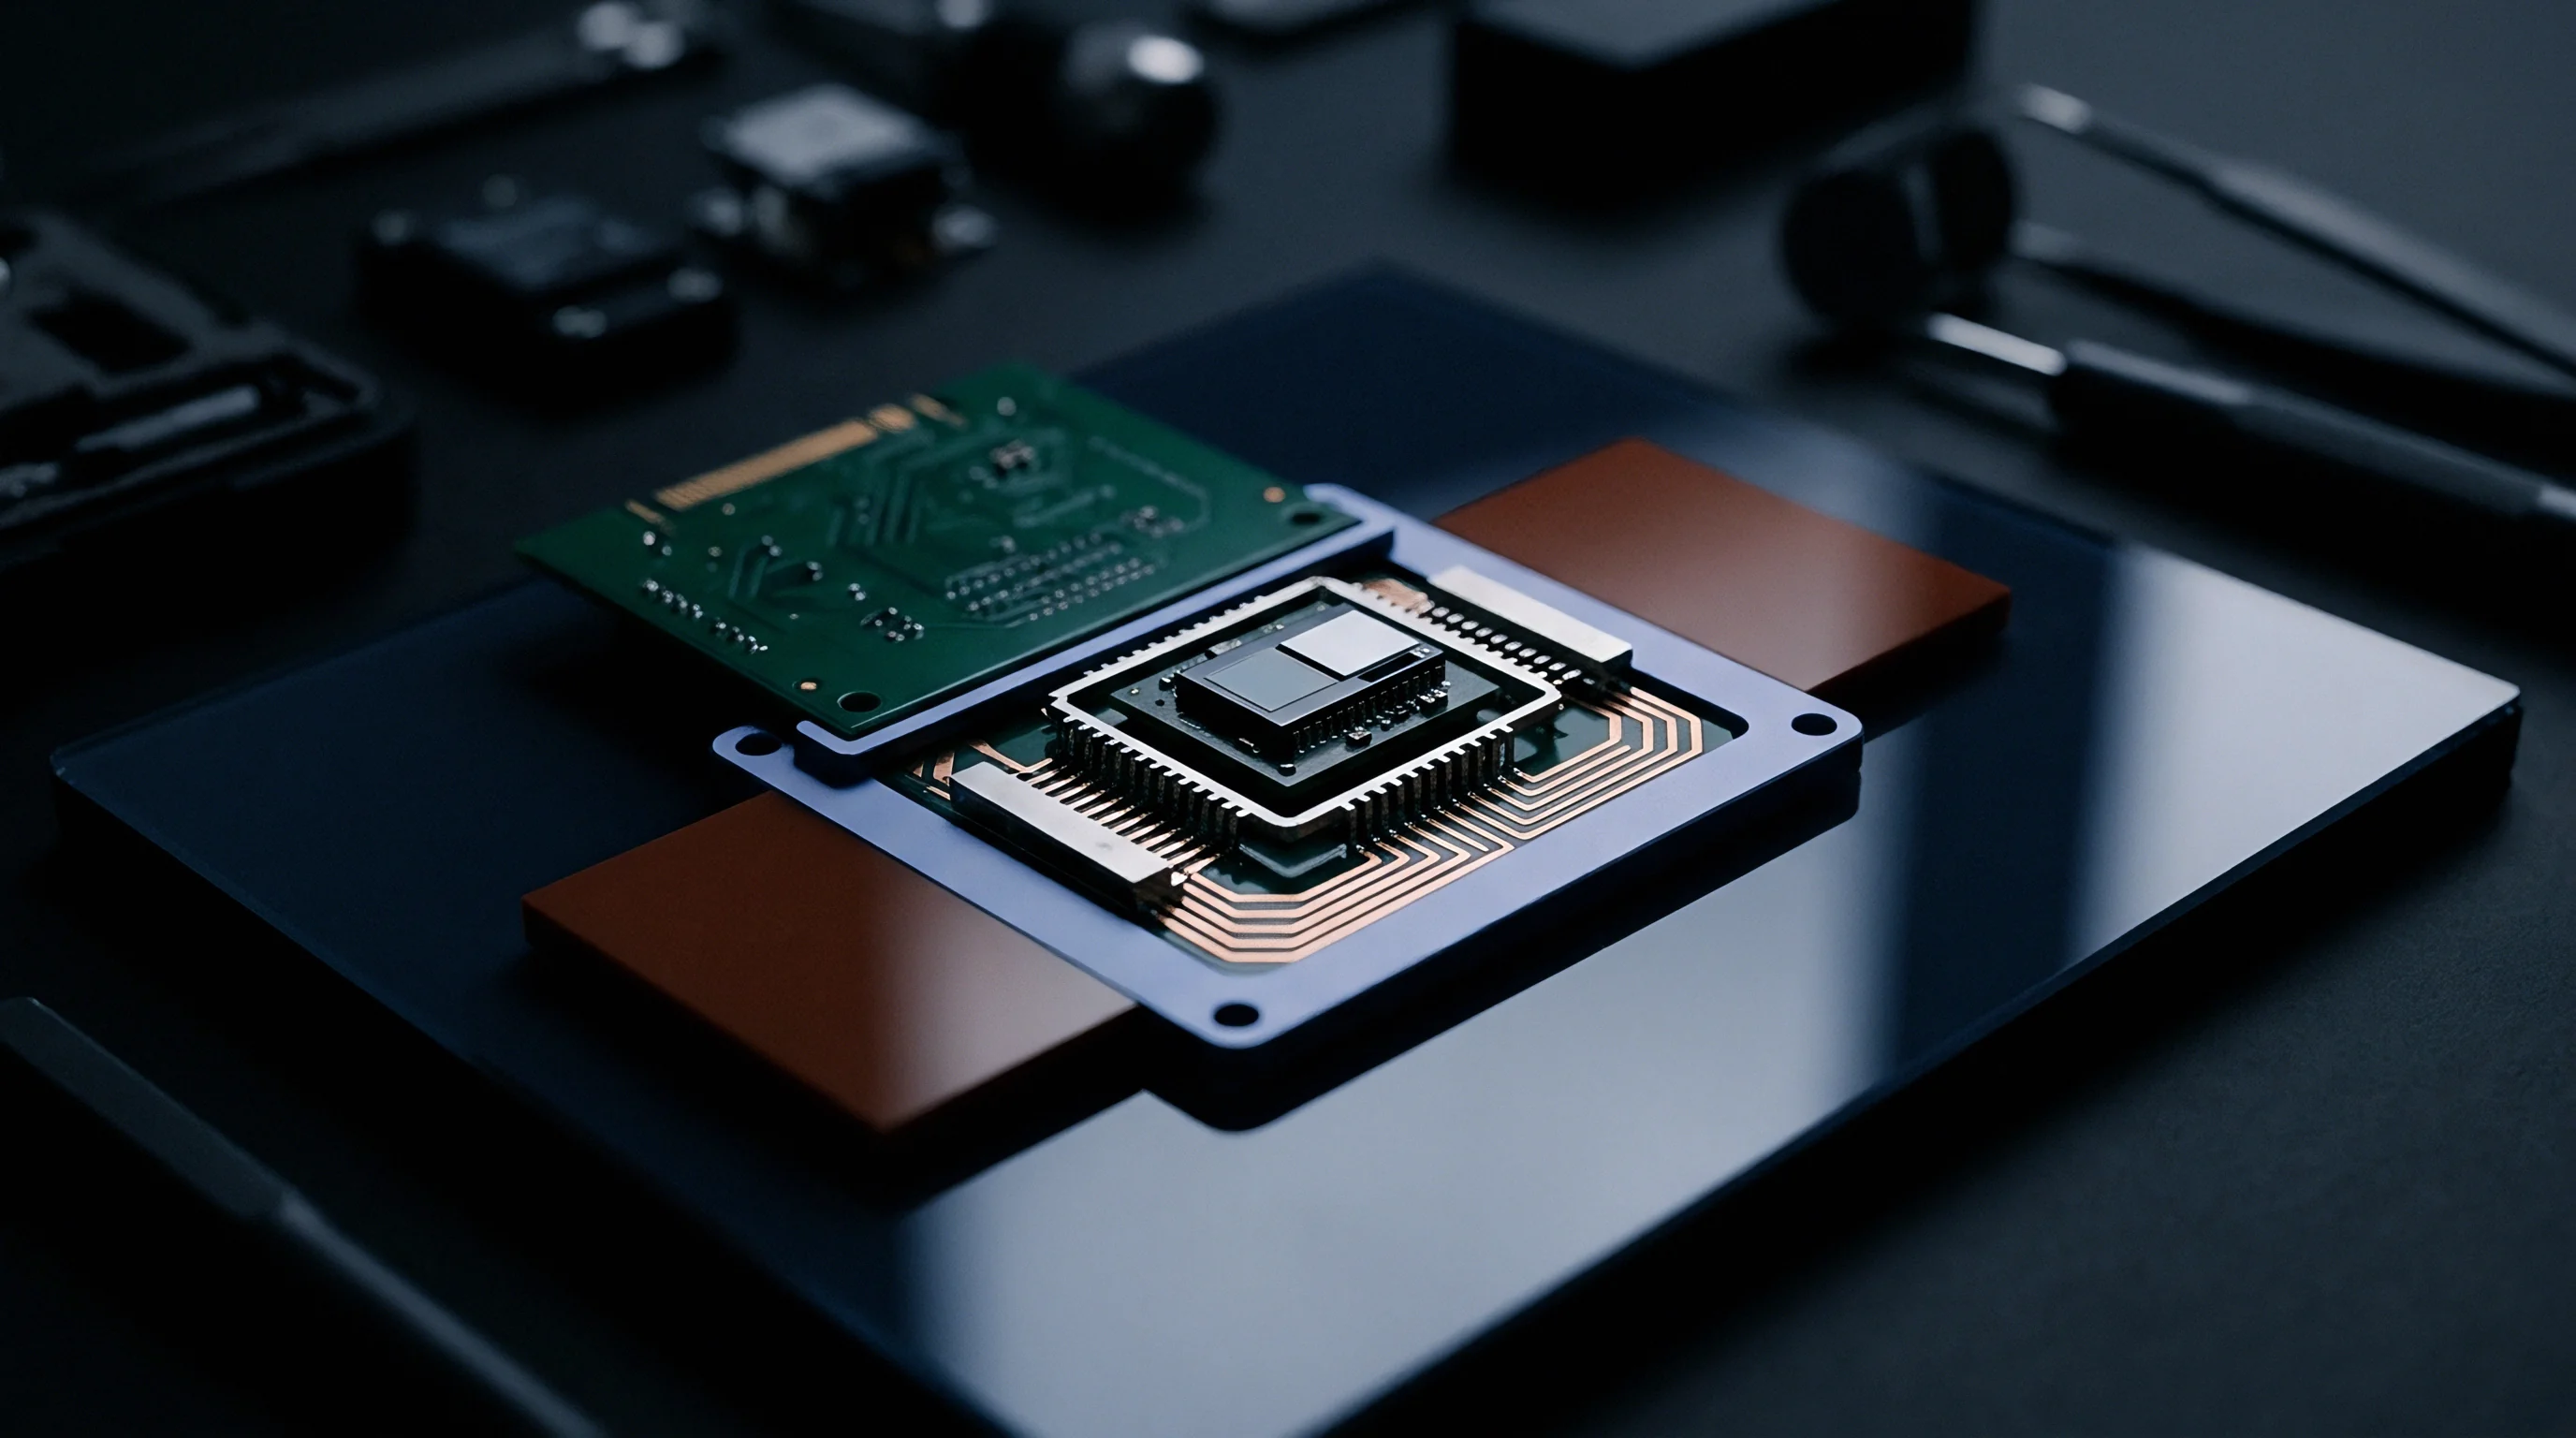
Dispense geometry dictates how capillary action establishes adhesive boundaries along the perimeter of the die. A uniform fillet rising twenty-five to seventy-five percent of the die thickness protects peripheral edges from mechanical impact and distributes edge shear strains across an extended geometry. The crosslink density of the formulation controls fluid dynamics prior to gelation, as well as the mechanical capability of the solid fillet to resist stress-corrosion cracking and environmental fatigue.
Silver flakes provide electrical percolation. Silica particles lower thermal expansion coefficients.
Thermal fatigue testing per JESD22-A104 subjects microelectronic assemblies to repeated temperature extremes, typically cycling between minus fifty-five degrees Celsius and one hundred and twenty-five degrees Celsius. In every cycle, the fillet experiences cyclic multiaxial strain fields. Fillets with excessive crosslink density lack the secondary molecular relaxation pathways needed to dissipate local stress concentrations, driving microcracks inward from the fillet surface toward the active silicon edge.
Fillers alter local strain fields within the fillet. Highly filled conductive adhesives contain seventy to eighty-five weight percent silver flakes, which creates high local stress concentrations in the thin polymer interlayers between particles.
Moisture absorption plasticizes polymer chains and lowers the threshold energy needed to initiate interfacial delamination.

Moisture Plasticization and Glass Transition Depression
Saturated humidity environments drive water molecules into microvoids within the cured adhesive. Moisture enters through polar functional groups, disrupting hydrogen bonding between polymer chains and expanding the network free volume. This plasticization phenomenon depresses the glass transition temperature by twenty to forty degrees Celsius.
The Gordon-Taylor relationship describes the glass transition of the plasticized polymer mixture:
Tg,wet = (wp Tg,p + k ww Tg,w) / (wp + k ww)
In this equation, w represents weight fractions, indices p and w refer to polymer and water respectively, and k is a fitting parameter relating the thermal expansion coefficients of the components. During IPC/JEDEC J-STD-020 moisture sensitivity level preconditioning, components absorb atmospheric moisture during soak stages at eighty-five degrees Celsius and eighty-five percent relative humidity. Subsequent exposure to convection reflow soldering at two hundred and sixty degrees Celsius rapidly vaporizes the entrapped moisture.
If the crosslink density is insufficient to preserve rubbery modulus at reflow temperatures, internal vapor pressure induces delamination or cohesive popcorn failure.
Acoustic Microscopic Signatures of Interfacial Failure
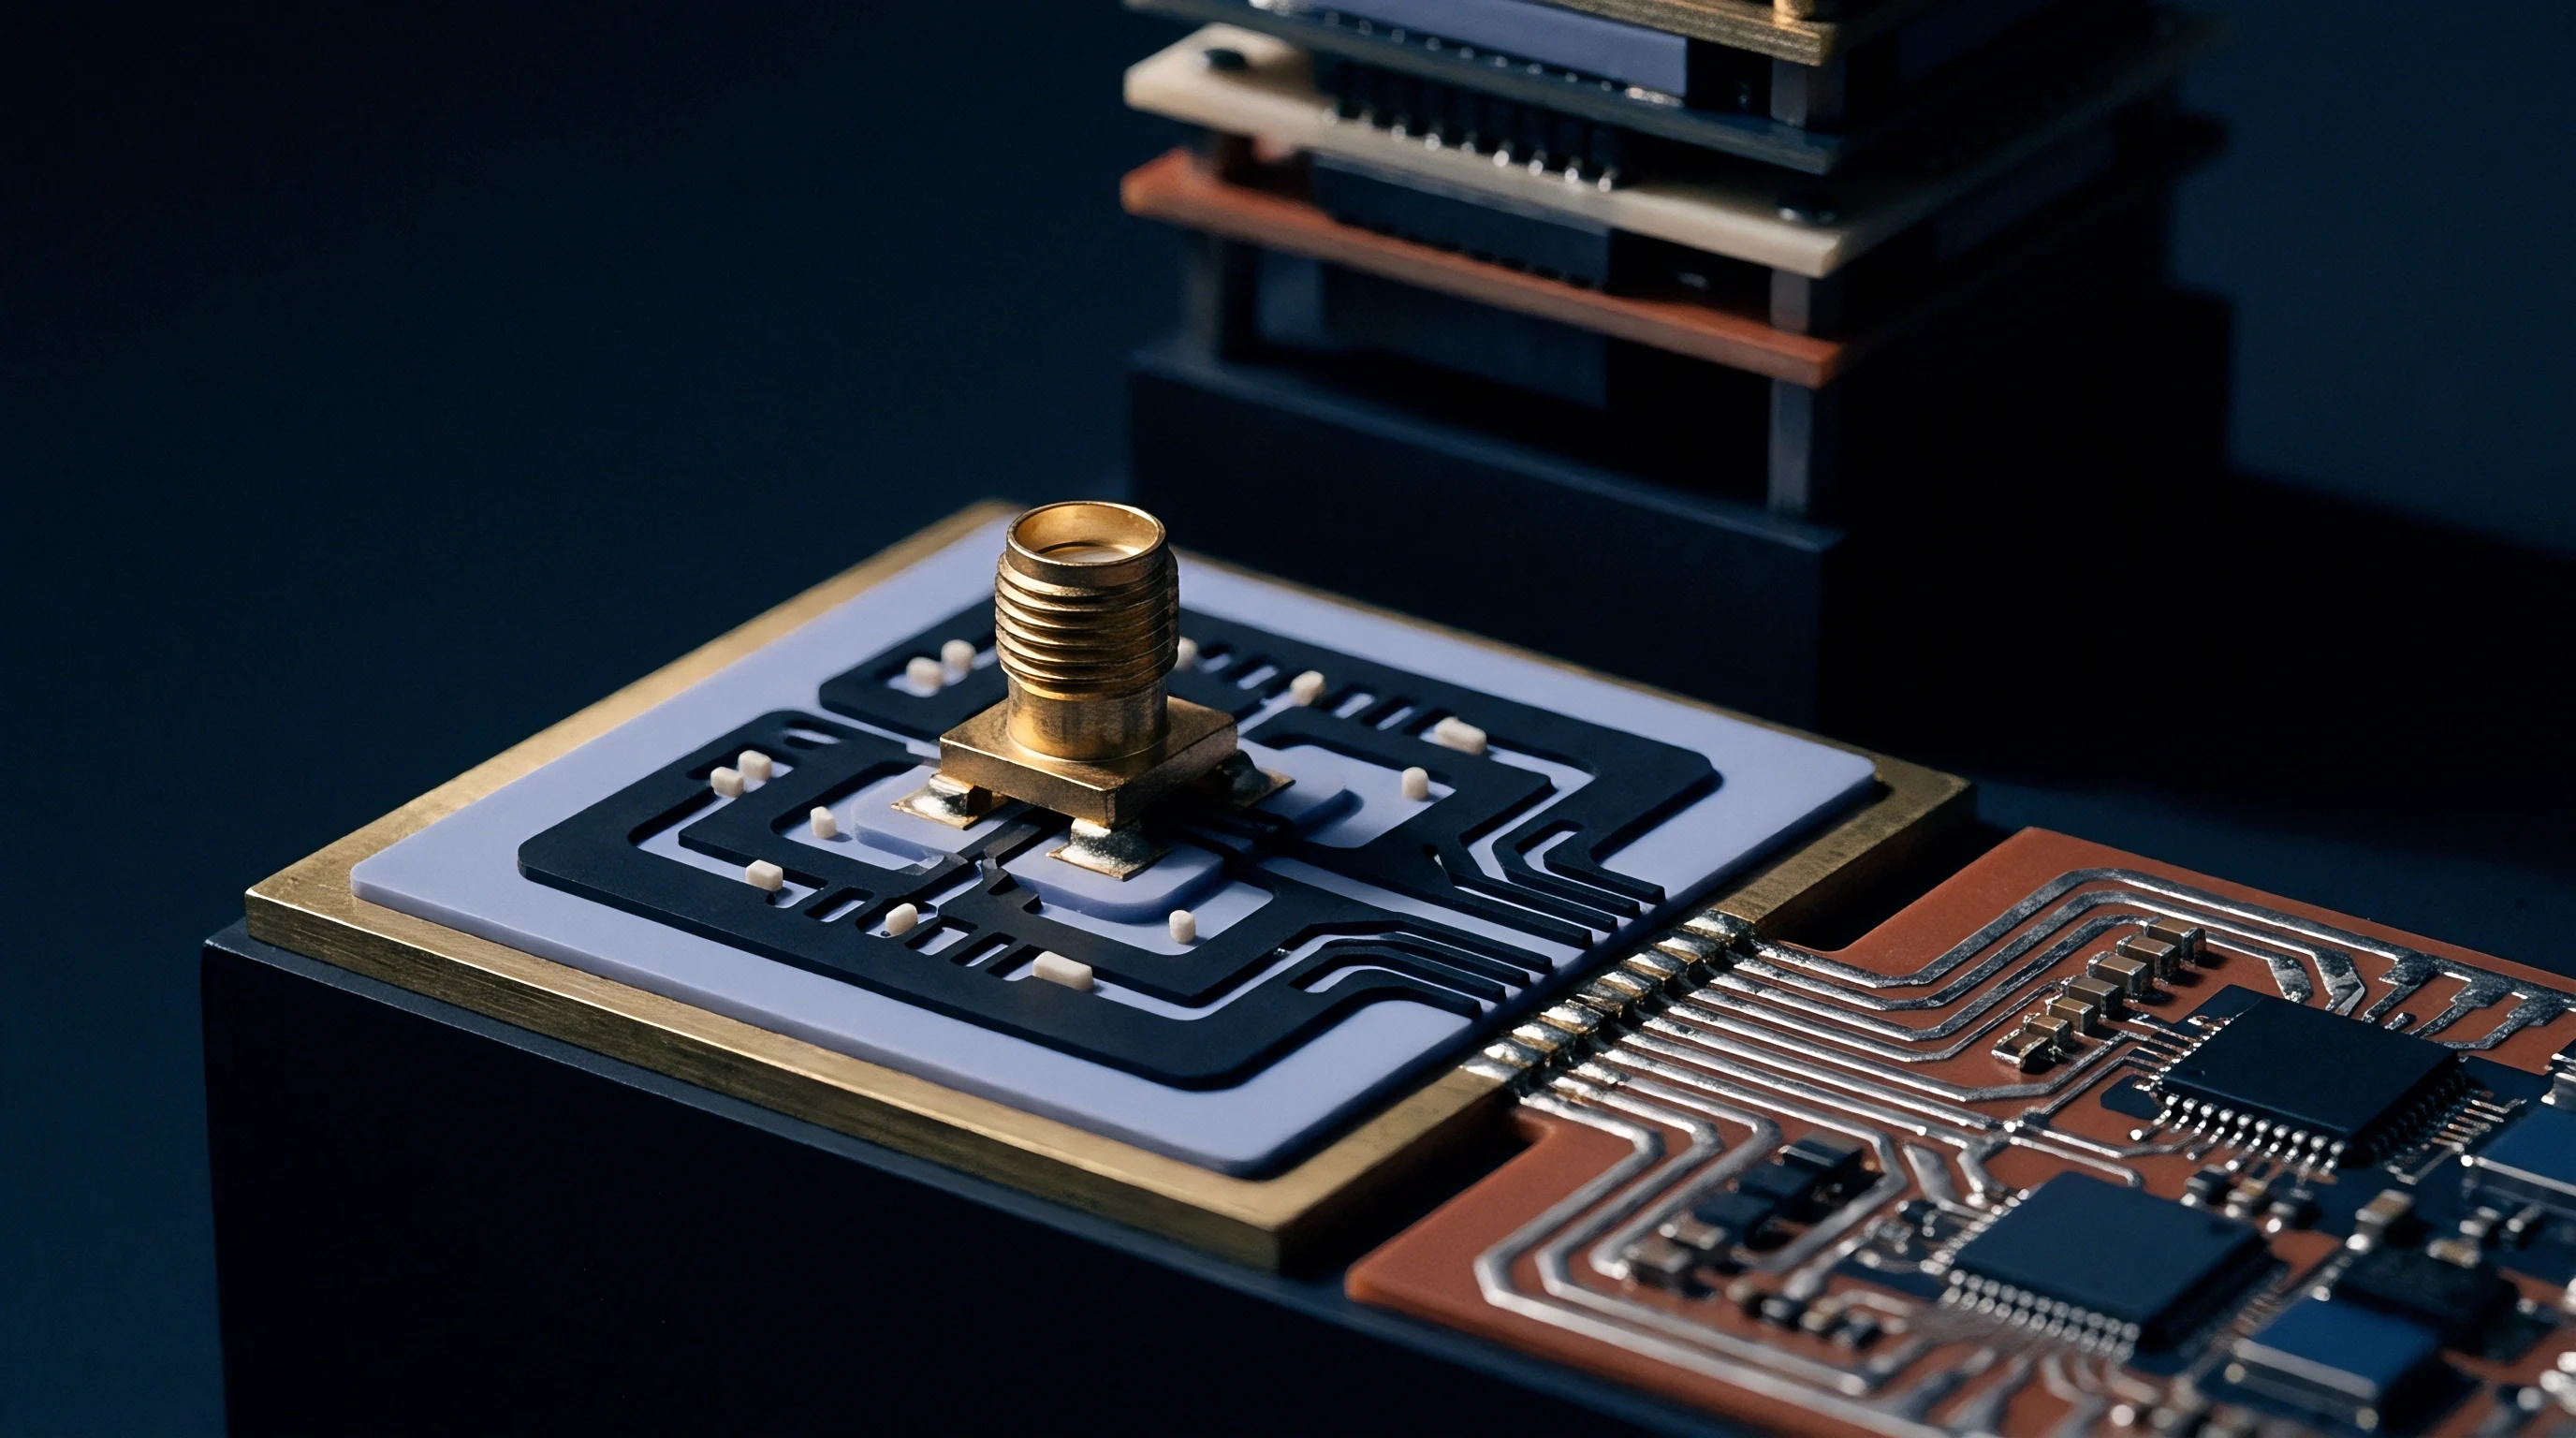
Reflected ultrasonic pulses identify acoustic impedance shifts between bonded interfaces. Scanning acoustic microscopy operating between 100 and 230 MHz maps the boundary between the die attach fillet and adjacent packaging members. When moisture-induced delamination occurs, the solid-to-solid interface transforms into a solid-to-air boundary, inverting the phase of the reflected ultrasonic wave and increasing reflection amplitude to near one hundred percent.
Adhesion energy drops following moisture saturation. Glass transitions depress under moisture saturation.
- Hygroscopic swelling mismatch produces expansive mechanical strain during moisture soaking, pitting the expanding adhesive against the dimensionally stable silicon substrate.
- Hydrolytic chain scission cleaves ester and ether linkages in under-crosslinked matrices during prolonged temperature humidity bias testing, reducing bulk modulus over time.
- Silver migration accelerates along microcracks within moisture-saturated fillets when electrical bias is applied across adjacent conductive bond lines.
- Solder bridging occurs during surface mount assembly if low rubbery modulus permits excessive hydrostatic expansion of the adhesive under package clamping force.
When interfacial failure occurs during reflow qualification, adhesive formulators often maintain that assembly dispense parameters caused void entrapment rather than acknowledging that inadequate crosslink density permitted excessive moisture plasticization.

Batch
Incoming raw materials enter receiving docks in refrigerated containers held at minus forty degrees Celsius. Maintaining tight limits on the crosslink mechanics of microelectronic die attach adhesives demands rigorous monitoring of material history long before dispensing occurs. Epoxies, bismaleimides, and acrylics are reactive mixtures that undergo gradual background addition reactions even at sub-zero storage temperatures.
These advance reactions consume reactive functional groups, raising monomer molecular weight, altering paste viscosity, and lowering the ultimate crosslink density achievable during scheduled assembly cure cycles.
Shelf-life validation requires systematic assessment of reaction conversion using differential scanning calorimetry. A freshly formulated adhesive exhibits a characteristic total reaction exotherm ΔH0. Testing thawed lots at scheduled intervals determines residual reaction enthalpy ΔHresidual.
The advance conversion ratio αadvance reflects degradation from improper storage:
αadvance = (ΔH0 – ΔHresidual) / ΔH0
If αadvance exceeds five percent, the adhesive lot should be removed from high-reliability production lines. Advanced polymerization shifts the stoichiometry of multi-part systems, suppresses final network density, and accelerates premature vitrification during cure.
Specifying IPC-TM-650 Method 2.4.24.4 for glass transition verification binds the supplier to thermal mechanical analysis parameters that prevent acceptance disputes.

Pot Life Decay and Viscosity Advance
Ambient exposure initiates background addition reactions before the adhesive reaches the dispense needle. Syringe packages placed on automated die bonders warm to cleanroom ambient conditions of twenty-five degrees Celsius and forty-five percent relative humidity. The working life, or pot life, defines the duration an adhesive remains within operational viscosity limits.
Standard specifications set pot life as the time required for Brookfield or cone-and-plate viscosity to increase by twenty-five percent at a shear rate of 10 s-1. Viscosity climbs as monomers react.
As room-temperature background polymerization proceeds, oligomers form within the syringe, narrowing the processing window. These oligomers shift the gelation threshold during downstream cure passes, resulting in localized variations in crosslink density across a production wafer lot. Syringes exceeding certified out-time limits exhibit degraded substrate wetting, irregular fillet rise, and elevated void generation caused by entrapped air pockets in the high-viscosity paste.
Secondary amines react at lower temperatures.
Standard Specifications and Sourcing Controls
Procurement documents define precise physical boundaries for lot release. Engineering drawings specifying microelectronic adhesives incorporate analytical acceptance thresholds spanning chemical, mechanical, and thermal metrics. Relying on nominal manufacturer datasheets leaves packaging programs exposed to lot-to-lot variance.
Incoming inspection criteria incorporate verification testing across multiple analytical methods.
Thermal stability qualification per MIL-STD-883 Method 5011 mandates testing for hydrolytic ionic impurities, outgassing weight loss, and high-temperature die shear retention. Formulations engineered for automotive electronics qualify under AEC-Q100 Grade 0, requiring survival through two thousand thermal shock cycles from minus fifty-five degrees Celsius to one hundred and fifty degrees Celsius. Meeting these benchmarks demands precise supplier control over monomer equivalent weight, hardener purity, and catalyst concentrations.
Procurement agreements enforce compliance by incorporating IPC-TM-650 Method 2.4.24.4, which establishes that any delivered adhesive lot exhibiting a glass transition temperature variance greater than five degrees Celsius from the qualified type-baseline triggers automated commercial rejection.