Sintered Silver Die Attach Sintering Porosity Measurement Methods
Sintered silver porosity measurement requires separating macroscopic void inspection by acoustic microscopy from submicron pore quantification by ion beam SEM.


Scale
During sintering, silver particles join through solid-state atomic diffusion into a continuous metallic network filled with interstitial voids. This total void fraction falls into two physical domains: macro-voids larger than twenty micrometers across ~ left behind by entrapped solvent during rapid drying or substrate warpage ~ and the submicron microporosity inherent to incomplete grain coalescence. Evaluating direct volumetric density starts with distinguishing these two populations.
Pressure-assisted power electronic die attach processes operating at 10 to 30 megapascals target a finished bulk porosity of 10 percent to 22 percent, while pressureless formulations settle between 20 percent and 35 percent. Measuring the resulting microstructure requires tools calibrated to the target domain; an instrument set up for macro-void screening misses submicron pores entirely.

Density Regimes and Volume Fractions
The physical properties of the die attach layer govern thermal conduction and mechanical fatigue life. At room temperature, bulk silver has a thermal conductivity of 429 watts per meter-kelvin and an electrical resistivity of 1.59 microhm-centimeters. Sintered silver die attach layers reach thermal conductivity values between 120 and 280 watts per meter-kelvin, governed directly by final density.
Bond line thickness ranges from 15 to 50 micrometers after drying and pressing. Within this thin bond line, porosity acts as a thermal barrier while simultaneously offering stress relief during power cycling. Higher pressure produces lower porosity.
Pressureless pastes trade density for simpler tooling, producing porous structures that relieve shear stress on large silicon carbide dies at the cost of peak heat dissipation.
Disputes in receiving inspection arise when total porosity is calculated by subtracting measured mass density from theoretical silver density (10.49 grams per cubic centimeter) using Archimedes immersion techniques. Helium pycnometry measures skeleton density accurately on freestanding pellets, but fails on finished assemblies where silicon dies, copper leadframes, and ceramic substrates obscure the die attach mass. Determining density on production power modules requires spatial transduction methods that isolate the bond line volume.
| Measurement Modality | Physical Transduction Principle | Spatial Resolution Limit | Targeted Porosity Domain | Destructive State |
|---|---|---|---|---|
| Scanning Acoustic Microscopy | Acoustic reflection at mechanical impedance boundaries | 15 to 40 micrometers | Macro-voids and delamination | Non-destructive |
| Micro-Focus X-Ray Radiography | Differential photon attenuation through atomic density | 5 to 10 micrometers | Gross void clusters | Non-destructive |
| Nano-Focus X-Ray Computed Tomography | Three-dimensional radiographic projection reconstruction | 300 to 800 nanometers | Micropore clusters and macro-voids | Non-destructive to coupon |
| Broad Ion Beam Planarization with SEM | Secondary and backscattered electron emission | 5 to 20 nanometers | Submicron sintering pores and grain boundaries | Destructive |
| Transient Thermal Impedance | Heat flux propagation and thermal RC network response | Layer lumped average | Effective thermal porosity proxy | Non-destructive |

Morphology Distribution across the Bond Line
Sintering kinetics create clear spatial gradients between the die and substrate metallization interfaces. Grain coalescence accelerates near gold or direct-bonded copper plating because of interdiffusion, leaving most open pores concentrated along the central plane of the bond line. Rather than isolated spherical cavities, the pore morphology forms irregular, interconnected networks of canals that distort volumetric models built on spherical assumptions.
High tortuosity inside this network cuts the effective area available for phononic heat transfer to less than 60 percent of the apparent geometric bond area.
Mechanical abrasive polishing drags ductile silver across open pores and masks the true void network.
Evaluating this network requires an analytical approach that separates isolated intra-granular voids from contiguous inter-granular channels. When stress relief during thermal shock cycling relies on the matrix’s compliance, pore aspect ratio and spacing determine whether microcracks arrest or open up catastrophic delamination paths through the joint plane.

Acoustics
High-frequency ultrasonic waves reflect at physical boundaries where acoustic impedance changes ~ impedance being the product of material density and acoustic velocity. Pure silver has an acoustic impedance of roughly 38 megarayls, silicon sits near 19.6 megarayls, and air-filled voids register at approximately 0.0004 megarayls. This near-total reflection at silver-air boundaries makes scanning acoustic microscopy sensitive to separations in the stack, with the reflection coefficient at a void interface approaching negative unity and inverting the phase of the echo relative to the incident pulse.

Transducer Bandwidth and Interface Echoes
Piezoelectric transducers turn radiofrequency electrical signals into focused ultrasonic pulses through a sapphire buffer rod and an immersion fluid, typically deionized water. Inspecting die attach layers through a 100 to 300 micrometer silicon or silicon carbide die requires the signal to pass through the semiconductor, reflect off the die attach interface, and return to the transducer without getting lost in surface reverberations. Operating frequencies between 100 megahertz and 230 megahertz balance spatial resolution against acoustic attenuation.
Higher frequencies reduce penetration depth because water attenuation scales with the square of the acoustic frequency, driving steep signal losses above 200 megahertz. Transducer selection dictates focal length, depth of field, and beam waist spot size, which in turn sets lateral resolution. A 100 megahertz transducer with an F-number of 2.0 produces a spot size near 30 micrometers in silicon, while a 230 megahertz short-focus transducer achieves a spot near 15 micrometers.
Pores smaller than two micrometers scatter acoustic energy instead of reflecting a discrete, coherent echo.
- Acoustic impedance mismatch generates strong front-surface echoes off the silicon chip that saturate the receiver amplifier if gate timing drifts.
- High signal attenuation inside porous silver dissipates pulse energy via multiple internal reflections and grain boundary scattering.
- Phase cancellation artifacts emerge when the focused beam spot covers bonded silver and microporous void networks at the same time.
- Substrate resonance interference occurs when reflection pulses from the leadframe backside overlap the die attach echo in thin direct-bonded copper assemblies.

Wavelength Constraints in High Frequency Immersion
Sound travels through silicon at 8,430 meters per second along the primary crystallographic axis. At 100 megahertz, the acoustic wavelength inside the chip measures roughly 84 micrometers; at 230 megahertz, it contracts to 37 micrometers. Pulse-echo acoustic microscopy cannot resolve features much smaller than half the acoustic wavelength as discrete geometries, meaning individual submicron sintering pores remain invisible to the technique.
The tool registers bulk microporosity only as an integrated attenuation of the interface echo’s amplitude.
Whenever the transducer wavelength exceeds the die thickness, reverberation corrupts interface gate timing.
In factory inspection, operators running C-mode scanning acoustic microscopy isolate the die attach echo using an electronic time gate set to the expected round-trip time through the bond line thickness. A sintered silver layer with a uniform 15 percent microporosity causes the overall echo amplitude to drop across the entire die footprint. Consequently, acoustic maps can report full bond integrity within the resolution limit of a standard transducer even when parts overheat during bench verification.


Absorption
Photon transmission through matter depends exponentially on atomic number, physical density, and material thickness under the Beer-Lambert law. With an atomic number of 47 and high bulk density, silver has an X-ray linear attenuation coefficient far greater than silicon, aluminum, or organic molding compounds, providing strong transmission contrast. In planar 2D X-ray inspection, the beam penetrates the entire stack ~ projecting copper leadframes, ceramic isolation layers, silicon dies, and the sintered silver layer onto a flat panel detector where each pixel records the path integral of all materials along the trajectory.

Computed Tomography Voxel Resolution Limits
Three-dimensional nano-focus computed tomography resolves depth ambiguity by gathering hundreds of 2D projections over a 360-degree rotation. Algorithms reconstruct the volumetric attenuation matrix into cubic voxels. Getting voxel dimensions below 500 nanometers requires placing the sample within fractions of a millimeter from the micro-focus X-ray target.
In full power modules built on 300-micrometer copper baseplates and ceramic substrates, physical clearance prevents such close proximity, causing geometric magnification to collapse.
Full power module assemblies degrade the voxel resolution of commercial micro-CT systems to between 8 and 15 micrometers. Filtering of lower-energy photons by the dense copper baseplate causes beam hardening, which introduces false density gradients and cupping artifacts around the perimeter of the bond line. Photon starvation through thick baseplates adds heavy noise to reconstructed cross-sections.
Isolating 200-nanometer sintering pores ultimately requires cutting the module down to a micro-coupon pin under two millimeters wide, transforming a non-destructive screening tool into a destructive preparation process.
| System Architecture | Acceleration Voltage | Focal Spot Diameter | Sample Diameter Limit | Reconstructed Voxel Size |
|---|---|---|---|---|
| Standard 2D Radiography | 90 to 130 kilovolts | 3 to 5 micrometers | 300 millimeters | Planar projection only |
| Industrial Micro-Focus CT | 130 to 160 kilovolts | 1 to 3 micrometers | 100 millimeters | 6 to 12 micrometers |
| High-Resolution Nano-CT | 60 to 100 kilovolts | 200 to 500 nanometers | 2 to 5 millimeters | 300 to 600 nanometers |
| Synchrotron Phase-Contrast CT | 20 to 40 kiloelectronvolts | Parallel coherent beam | 1 millimeter | 30 to 80 nanometers |

Radiographic Thresholding and Partial Volume Artifacts
Separating pores from solid silver relies on grayscale thresholding, but the partial volume effect distorts this boundary whenever a pore occupies only a fraction of a voxel. The reconstructed linear attenuation value of that voxel falls into an intermediate gray between silver and air. Grouping that voxel with solid silver underestimates porosity, while classifying it as a void overestimates it ~ a choice that shifts the calculated porosity by several absolute percentage points.
- Otsu automated thresholding fails in unimodal grayscale histograms where submicron pore volume is small compared to the dense silver matrix.
- Adaptive local thresholding introduces artificial pore networks when window sizes coincide with high-frequency image noise.
- Ring artifacts from uncalibrated detector elements mimic circular porosity bands concentric with the rotation axis.
- Beam hardening streaks between adjacent wire bond pads or copper traces mask void channels near the die edge.
Automated image analysis engines cannot distinguish whether an intermediate gray level stems from a cluster of 50-nanometer nanopores or a continuous 300-nanometer void crossing a voxel boundary.


Slice
Destructive physical analysis provides the ground truth for sintered silver microstructure. The assembly is cross-sectioned, the exposed joint face polished, and the internal void network visualized directly using field emission scanning electron microscopy. However, pure sintered silver is soft and ductile; mechanical polishing with diamond suspensions or alumina slurries exerts shear forces that smear metal into open surface cavities, masking submicron voids and creating severe artifacts.

Ion Beam Planarization against Mechanical Smearing
Broad ion beam milling avoids smearing by bombarding the cross-section with accelerated argon ions at low incident angles. A standard recipe directs a wide argon beam across a tungsten or titanium mask placed over the die attach joint. Operating at 3 to 6 kilovolts, the argon ions sputter surface atoms through momentum transfer without mechanical shear stress, preserving the underlying interfaces.
The resulting planar surface exposes pristine grain boundaries, intermetallic compound layers at metallization interfaces, and true pore geometries. While focused ion beam milling offers similar quality across localized 20 by 20 micrometer regions, broad ion beam processing opens continuous fields of view spanning one to two millimeters of bond line, preventing local density variations from distorting statistical porosity calculations.
| Preparation Methodology | Mechanical Stress Input | Pore Edge Rounding | Observed Porosity Bias | Execution Time per Sample |
|---|---|---|---|---|
| Abrasive Diamond Lapping | High shear friction | Severe edge deformation | Negative 6 to 14 percent | 45 minutes |
| Vibratory Silica Polishing | Moderate friction | Moderate relief polish | Negative 3 to 7 percent | 180 minutes |
| Broad Ion Beam Planarization | Zero mechanical contact | Atomic-scale preservation | Zero baseline reference | 90 minutes |
| Focused Ion Beam Trenching | Zero mechanical contact | Zero edge deformation | Zero baseline reference | 240 minutes |

Stereological Projection to Volumetric Porosity
Quantifying porosity from electron micrographs relies on mathematical stereology. Under Delesse’s principle, the area fraction of pores measured on a random planar section through a homogeneous isotropic microstructure equals the volumetric pore fraction of the bulk material. Backscattered electron imaging yields clear atomic number contrast, presenting solid silver as bright regions and open voids as dark cavities where optical contrast fails below micron scales.
Broad ion beam cross-sections imaged at 10,000 times magnification yield an intra-lot porosity variation of plus or minus 1.8 percent across a 35-micron bond line.
Extracting the true area fraction requires systematic image processing: applying a median filter to remove camera noise, setting a threshold against a solid silver reference, and dividing total dark pixel area by the bounding box area of the sintered layer.
- Section cutting separates the target die attach region from the substrate using a low-speed diamond wire saw to minimize mechanical cracking.
- Epoxy encapsulation stabilizes open pore channels by vacuum-infiltrating a low-viscosity resin before grinding.
- Mechanical pre-grinding thins the cross-section plane to within 50 micrometers of the targeted die centerline using silicon carbide papers up to 4000 grit.
- Broad ion beam polishing removes the smeared surface layer inside a cooled vacuum chamber to prevent thermal recrystallization of the silver grains.
- Micrograph collection captures secondary and backscattered electron frames at a minimum magnification of 10,000 times across at least ten contiguous fields along the bond line.
Running incoming quality control with mechanical metallography instead of broad ion beam milling can lead to accepting batches carrying 30 percent true porosity, as smeared metal conceals void channels and risks thermal runaway when modules operate at rated power.

Impedance
Thermal transduction offers a fast, non-destructive proxy for the functional performance of a sintered joint on finished assemblies. Rather than imaging individual pores, transient thermal testing evaluates the lumped thermal resistance and capacitance of the package stack. Following the transient dual interface method in JEDEC JESD51-14, the device operates until reaching steady-state temperature, at which point the heating current turns off and a temperature-sensitive parameter tracks the cooling curve at microsecond resolution.

Structure Functions from Transient Thermal Probing
The forward-bias voltage of an IGBT gate-emitter diode or a silicon carbide MOSFET body diode acts as the thermal sensor. Using a calibration curve that connects voltage drop to temperature at a stable drive current (typically 1 to 10 milliamperes), the measurement system logs temperature versus time down to one-microsecond intervals. Mathematical deconvolution then transforms this cooling curve into a cumulative or differential structure function, mapping thermal resistance against thermal capacitance spatially from the semiconductor junction down through the die attach into the substrate.
The sintered silver layer appears as a thermal resistance plateau accompanied by a small rise in thermal capacitance. Sintering porosity affects both values at once: higher void fractions reduce the metallic cross-section available for conduction, pushing the resistance plateau to the right, while voids replace silver with air, lowering thermal capacitance per unit volume. Comparing differential structure functions against a baseline detects global density shifts without de-encapsulating the module.
Conductivity Derivation from Heat Path Resistance
Deriving numerical porosity values from thermal resistance requires isolating the joint’s geometric parameters, where thermal resistance equals bond line thickness divided by effective thermal conductivity times bonded area. If component tilt causes bond line thickness to vary from 20 micrometers on one edge to 45 micrometers on the other, thermal resistance increases mimic true porosity shifts; transient thermal analysis cannot differentiate a 10 micrometer increase in bond line thickness from a 5 percent rise in layer porosity.
Four-point electrical probing offers an independent check on test coupons by measuring sheet resistance across the joint. Electrical resistivity tracks thermal conductivity via the Wiedemann-Franz law, where the Lorenz number for pure silver links electronic and thermal transport. When voids break up conduction pathways, electrical resistivity spikes, signaling an increase in open pore volume.
When thermal resistance meets specification despite acoustic microscopy showing edge voids, heat spreading within the copper substrate is compensating for the localized joint defects.

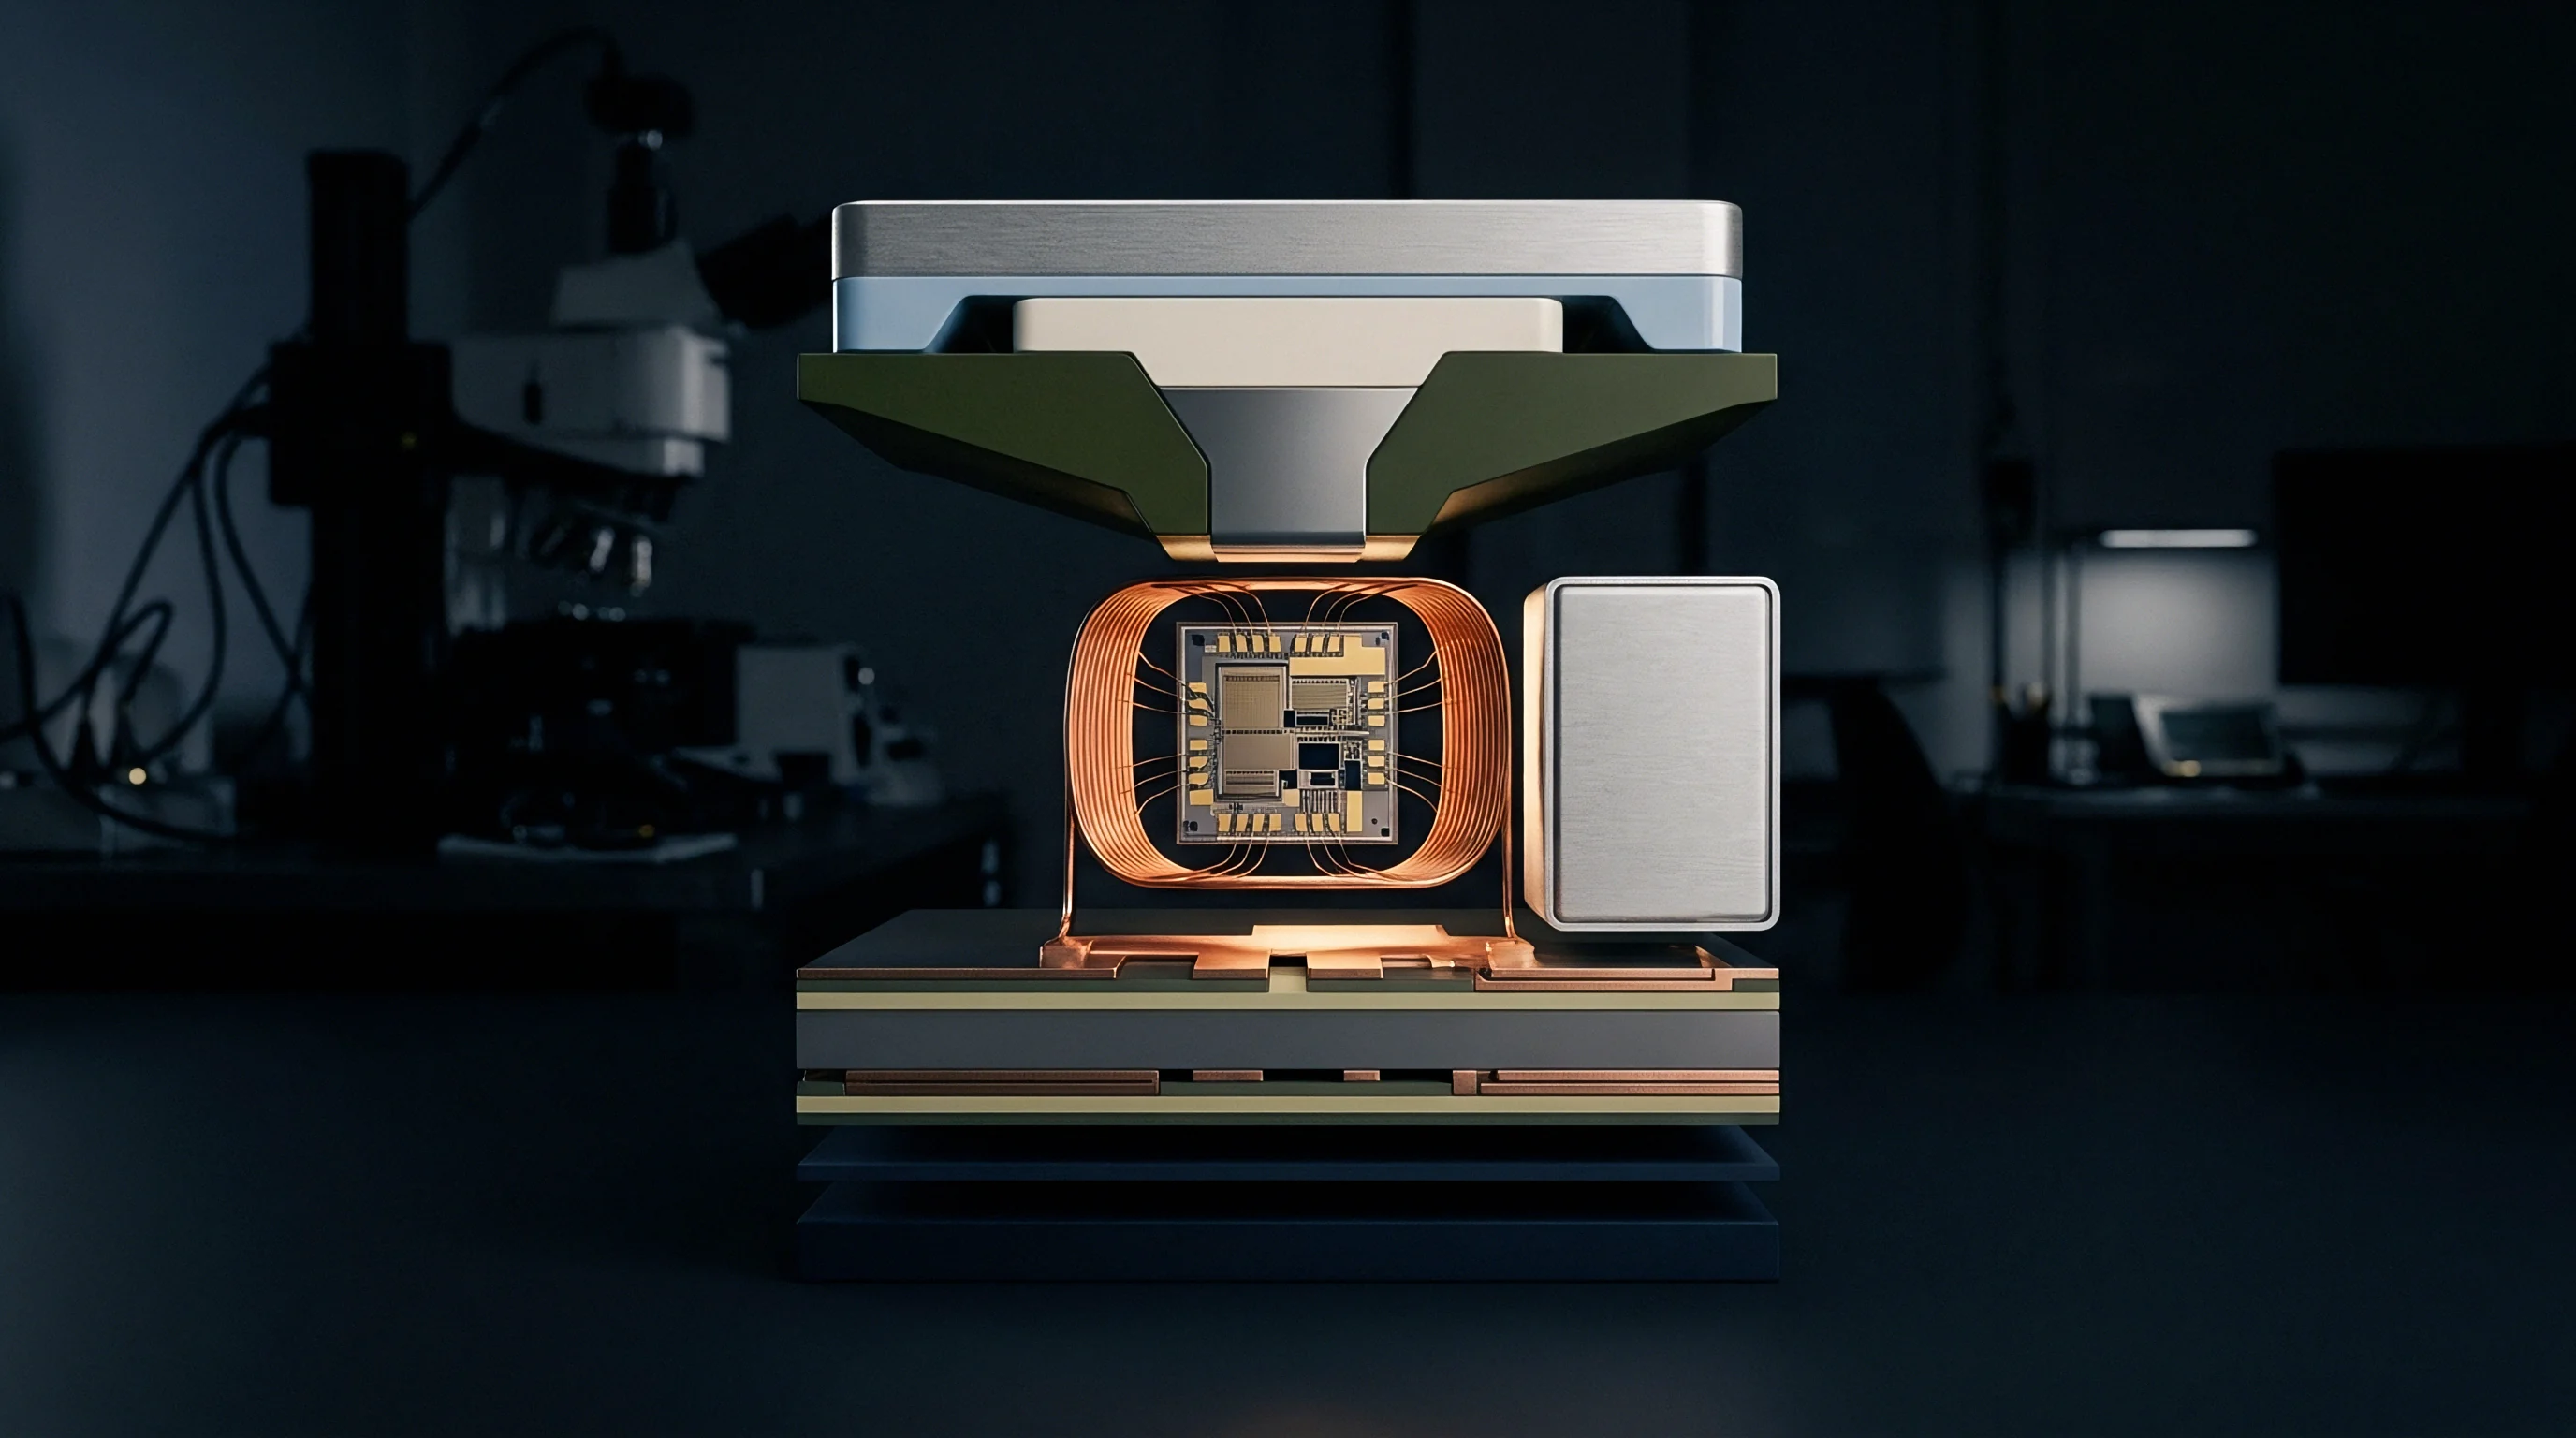
Audit
Production lot acceptance cannot rely on destructive broad ion beam milling for every manufactured unit. Quality strategies combine inline non-destructive tools with periodic destructive sampling to monitor porosity. Production lines run scanning acoustic microscopy or automated 2D X-ray systems inline to catch gross process deviations, while QA labs section sacrificial coupons with ion beam milling to audit submicron microporosity drift.

Inline Scanning against Destructive Lot Gating
Inline acoustic scanning adds cycle time, with automated systems requiring 30 to 90 seconds to scan a six-die power module substrate depending on raster resolution. To maintain line throughput, factories run high-speed acoustic scans at 50-micrometer pixel resolution ~ catching gross voids and edge delaminations over 100 micrometers, but passing parts with uniformly unsintered paste.
Lot gating rules require destructive validation whenever paste batches, stencil designs, or press thermal profiles change. Sacrificial leadframes processed alongside active units provide specimens for ion beam milling. Acceptance limits establish an upper boundary on total void area fraction and a lower limit on lap shear strength.
Sintered silver with 18 percent volume porosity achieves lap shear strengths between 35 and 55 megapascals on direct-bonded copper substrates plated in silver or gold; if audited porosity climbs toward 28 percent, shear strength drops below 20 megapascals, driving interfacial fatigue failure during power cycling.

Contractual Thresholds in Thermal Interface Standards
Procurement contracts frequently reference MIL-STD-883 Method 2030 for ultrasonic inspection or Method 2012 for radiographic evaluation. These legacy military standards set maximum allowable void areas as a percentage of total die area, typically rejecting parts with more than 15 percent total voiding or 5 percent in a single contiguous void. However, those standards were written for eutectic gold-silicon and tin-lead solder joints, where voids appear as discrete gas bubbles in a fully dense matrix.
Sintered silver does not fit this binary classification.
Sintered silver contains inherent microporosity distributed throughout the joint. When procurement contracts cite MIL-STD-883 Method 2030 without clarifying whether the 15 percent limit applies only to macro-voids or includes background microporosity, contractual disputes follow. Suppliers formulate pastes that naturally possess 12 to 20 percent bulk porosity after a full pressure-assisted cure.
Treating intrinsic sintering porosity as a defect stops shipments unnecessarily, while ignoring it allows under-sintered modules with reduced thermal capacity to reach the field.
Contractual agreements resolve this conflict by adopting a formal definition based on ASTM E562 for stereological point counting: inline ultrasonic testing screens macroscopic voiding and delamination with a 50-micrometer defect filter, while broad ion beam cross-sectional electron microscopy serves as the referee method for bulk microporosity, setting lot acceptance at a maximum volume fraction of 22 percent across ten random fields of view.