P-Type Boron Doping Density Effects on Transducer Gauge Factor Thermal Stability
Heavy boron doping above 1e19 cm-3 stabilizes piezoresistive gauge factor thermal decay, allowing passive current-bias drift compensation.

Carrier
In p-type single-crystal silicon piezoresistors, boron doping reconfigures the electronic band structure, altering the piezoresistive coefficient by redistributing holes across the valence sub-bands. Unstressed silicon maintains degenerate heavy-hole and light-hole bands at the valence band maximum. Applied mechanical stress breaks this degeneracy, transferring carriers between sub-bands and altering the effective mass tensor.
The longitudinal gauge factor reflects this relative resistance shift per unit of mechanical strain, defined as the ratio of fractional resistance change to applied uniaxial strain.
Acceptor concentration sets the room-temperature Fermi level in the valence band, fixing the baseline population of active holes. At light doping densities between 1016 cm-3 and 1017 cm-3, the Fermi level sits well above the valence band edge. Under applied strain, holes transfer asymmetrically between the split sub-bands, producing high piezoresistive sensitivity.
Longitudinal gauge factors along the 110 crystallographic direction reach 120 to 170 in this lightly doped regime. However, thermal energy easily disrupts this carrier distribution, causing steep drops in sensitivity as ambient temperature rises.

Sub-Band Splitting and Piezoresistive Coupling
Mechanical deformation lowers crystal symmetry, lifting the degeneracy at the valence band zone center. The shear piezoresistive coefficient, π44, governs the electromechanical response in p-type silicon oriented along the 110 axis. Lightly doped p-type silicon converts strain into resistance changes efficiently because the low carrier density allows the lower-energy, high-mobility sub-band to populate fully under stress.
Carrier concentration scales the piezoresistive output according to the Kanda model, which reduces the fundamental piezoresistive coefficient through a density-dependent factor.
Fermi Level Degeneracy Thresholds
Pushing the boron concentration past the semiconductor degeneracy threshold, roughly 3 × 1019 cm-3 in silicon, drives the Fermi level directly into the valence band continuum. In this degenerate regime, carrier populations follow Fermi-Dirac statistics instead of Maxwell-Boltzmann approximations. Free holes fill states deep into the sub-bands, blunting the relative carrier transfer caused by stress-induced splitting.
As a result, the gauge factor falls from peak values to between 30 and 50 at heavy doping levels.
Elevated dopant density reduces piezoresistive magnitude while dampening thermal coefficient susceptibility across operational temperature spans.
Transducer design balances baseline sensitivity against thermal drift. Lightly doped elements generate larger millivolt signals per unit force, easing downstream gain requirements. That sensitivity, however, brings substantial gain drift across operating temperatures, necessitating active thermal compensation.
Heavy boron doping sacrifices raw signal amplitude to secure a much more stable thermal response.
| Doping Density (cm-3) | Room Temp Gauge Factor | TCGF (ppm/°C) | TCR (ppm/°C) | π44 Multiplier Factor |
|---|---|---|---|---|
| 1 × 10¹⁷ | 145 | -2700 | +950 | 0.98 |
| 1 × 10¹⁸ | 118 | -2100 | +1100 | 0.85 |
| 1 × 10¹⁹ | 82 | -1200 | +1450 | 0.62 |
| 5 × 10¹⁹ | 48 | -450 | +2100 | 0.38 |
| 1 × 10²⁰ | 32 | -120 | +2800 | 0.22 |
Evaluating piezoresistive thermal performance relies on two distinct parameters: the temperature coefficient of resistance and the temperature coefficient of gauge factor. The temperature coefficient of resistance tracks bulk resistivity changes resulting from carrier mobility shifts and incomplete dopant ionization. The temperature coefficient of gauge factor quantifies the proportional loss in strain sensitivity for every degree of temperature rise.


Drift
Temperature swings alter mobile hole mobility through acoustic phonon interactions, eroding signal stability across the operating window. The temperature coefficient of gauge factor, TCGF, tracks this decay in parts per million per degree Celsius. In lightly doped p-type elements, lattice thermal expansion is negligible compared to carrier scattering.
As temperature increases, lattice vibrations scatter mobile holes more frequently, reducing drift mobility and weakening the stress-induced band shifts that generate piezoresistance.
Acoustic Phonon Mobility Degradation
Acoustic phonon scattering governs mobile hole behavior across standard operational spans from -40 to 125 degrees Celsius. At low impurity levels, hole mobility follows an empirical temperature dependence proportional to temperature raised to the power of negative 1.5. This drop in mobility lowers the piezoresistive coefficient at higher temperatures, causing significant loss of span sensitivity.
Heavy boron doping introduces ionized impurity scattering, which exhibits an opposite thermal trend, counterbalancing phonon scattering and flattening the net mobility curve.

Piezoresistance Factor Temperature Dependence
The piezoresistance temperature factor acts as a dimensionless scaling term relative to a 273 Kelvin baseline. Below 1018 cm-3 boron concentration, this factor scales inversely with absolute temperature. At higher doping densities, degenerate carrier screening modifies this relationship, softening the drop in sensitivity across temperature.
- Phonon lattice scattering dominance increases at elevated temperatures, systematically dampening hole mobility regardless of crystal stress state.
- Impurity ion scattering governs mobility in heavily doped regimes below 100 Kelvin, mitigating thermal sensitivity variations at cryogenic operational limits.
- Intervalley carrier transfer becomes less active under heavy degeneracy, preserving shear coefficient ratios across wide thermal bounds.
- Valence band warping changes under strain, requiring consistent hole populations across light and heavy sub-bands to maintain predictable output slopes.
A boron doping concentration of 1.2 × 1019 cm-3 restricts gauge factor thermal decay to less than -1000 ppm/°C across the span from -40 to 125 degrees Celsius.
The interplay between phonon and ionized impurity scattering explains why degenerate boron concentrations stabilize the electromechanical output. At heavy doping levels, ionized impurities screen lattice vibrations, arresting steep mobility drops. This stability comes at the expense of baseline gauge factor, requiring designers to trade raw sensitivity for temperature immunity.
Selecting an unsuitable doping profile shifts the burden onto downstream analog gain stages, increasing overall signal chain power draw and board footprint.


Junction
Fabrication sets the spatial distribution of boron acceptors using high-energy ion implantation followed by thermal activation. Implantation bombards the silicon substrate, disrupting the crystal lattice; subsequent annealing repairs this damage and shifts boron atoms into substitutional lattice positions. Thermal activation also drives dopant diffusion, creating a depth profile defined by surface concentration, junction depth, and overall channel dose.
How Does Annealing Duration Shift Thermal Coefficient Stability?
Annealing between 950 and 1050 degrees Celsius drives complete substitution of implanted boron into silicon lattice sites. Full activation removes uncharged interstitial boron atoms, which act as neutral scattering centers without contributing carriers to conduction. Incomplete anneal cycles leave behind point defects that trap mobile holes at elevated temperatures, introducing non-linear hysteresis into both the temperature coefficient of resistance and the temperature coefficient of gauge factor.
Rapid thermal processing restricts lateral diffusion while holding junction depths to tight dimensional targets. Furnace annealing yields deeper dopant profiles with smoother Gaussian distributions, reducing internal strain gradients through the piezoresistive element. The resulting profile geometry sets the effective resistor thickness, which governs surface scattering and boundary layer carrier trapping.
Boron Segregation and Active Profile Depth
During thermal oxidation, boron segregates into the growing silicon dioxide layer rather than remaining in the silicon substrate. This segregation depletes surface boron, shifting the peak acceptor concentration deeper into the channel. Foundry recipes adjust initial implant doses to compensate for this surface loss and preserve target sheet resistance across the wafer.
The boundary between the p-type piezoresistor and the n-type substrate forms an isolating p-n junction. Applying a reverse bias across this junction blocks current leakage into the substrate. As operating temperature climbs, reverse leakage rises exponentially, forming a parasitic conduction path that shunts current away from the piezoresistive Wheatstone bridge.
Thermal ramp rate tolerances within batch diffusion furnaces during activation drive lot-to-lot thermal coefficient variance.

Compensation
Offsetting the negative temperature coefficient of gauge factor with the positive temperature coefficient of resistance allows passive bridge stabilization without digital intervention. Piezoresistive pressure sensors and accelerometers generally configure four piezoresistors in a Wheatstone bridge topology. Under constant voltage excitation, bridge output tracks gauge factor decay directly: as temperature increases, output sensitivity falls in line with the native TCGF.
Constant Current Biasing Mechanics
Switching from constant voltage to constant current excitation fundamentally alters the thermal behavior of the Wheatstone bridge. Silicon piezoresistors feature a positive temperature coefficient of resistance (TCR), meaning total bridge resistance climbs with temperature. Under a constant current supply, this rising resistance increases the voltage drop across the bridge terminals in accordance with Ohm’s law.
The growing terminal voltage delivers higher effective excitation to the piezoresistors. When the positive TCR matches the absolute magnitude of the negative TCGF, the rise in excitation voltage offsets the loss in strain sensitivity. Achieving this self-compensation requires matching the boron doping level to the target thermal coefficient balance during fabrication.
| Doping Density (cm-3) | Drive Topology | Uncompensated TCGS (ppm/°C) | Net Output Shift (ppm/°C) | Power Growth over 100°C Span (%) |
|---|---|---|---|---|
| 1 × 10¹⁸ | Constant Voltage | -2100 | -2100 | -10.4 |
| 1 × 10¹⁸ | Constant Current | -2100 | -1000 | +11.6 |
| 1.5 × 10¹⁹ | Constant Voltage | -1100 | -1100 | -12.8 |
| 1.5 × 10¹⁹ | Constant Current | -1100 | +100 | +13.3 |
| 5 × 10¹⁹ | Constant Current | -450 | +1650 | +23.1 |

Active Span Correction Circuits
When boron concentration falls below the self-compensating threshold, external analog conditioning applies closed-loop gain adjustments based on temperature. Operational amplifiers with negative temperature coefficient thermistors in their feedback loops raise signal gain dynamically as temperature climbs. Microcontrollers apply polynomial corrections by sampling on-die temperature diodes and calculating compensation factors in real time.
- Constant current bias allocation requires matching the temperature coefficient of resistance directly to the negative temperature coefficient of gauge factor.
- Series resistor pad incorporation trims bridge excitation voltage rise when material bulk resistivity exceeds target design limits.
- Thermistor bridge shunting provides second-order curvature correction when non-linear temperature effects dominate high-temperature operating points.
Constant current excitation converts bulk resistance thermal growth into bridge drive voltage expansion.
Analytical models of bridge output illustrate the interaction between drive topology and thermal coefficients. Differential bridge voltage depends on applied strain, initial gauge factor, excitation voltage, and temperature offset terms. Expanding these thermal series terms shows that second-order non-linearities emerge once temperature deviations exceed 100 degrees Celsius.
Selecting an element doping concentration where resistance growth matches gauge factor decay removes the need for active analog conditioning stages.

Heat
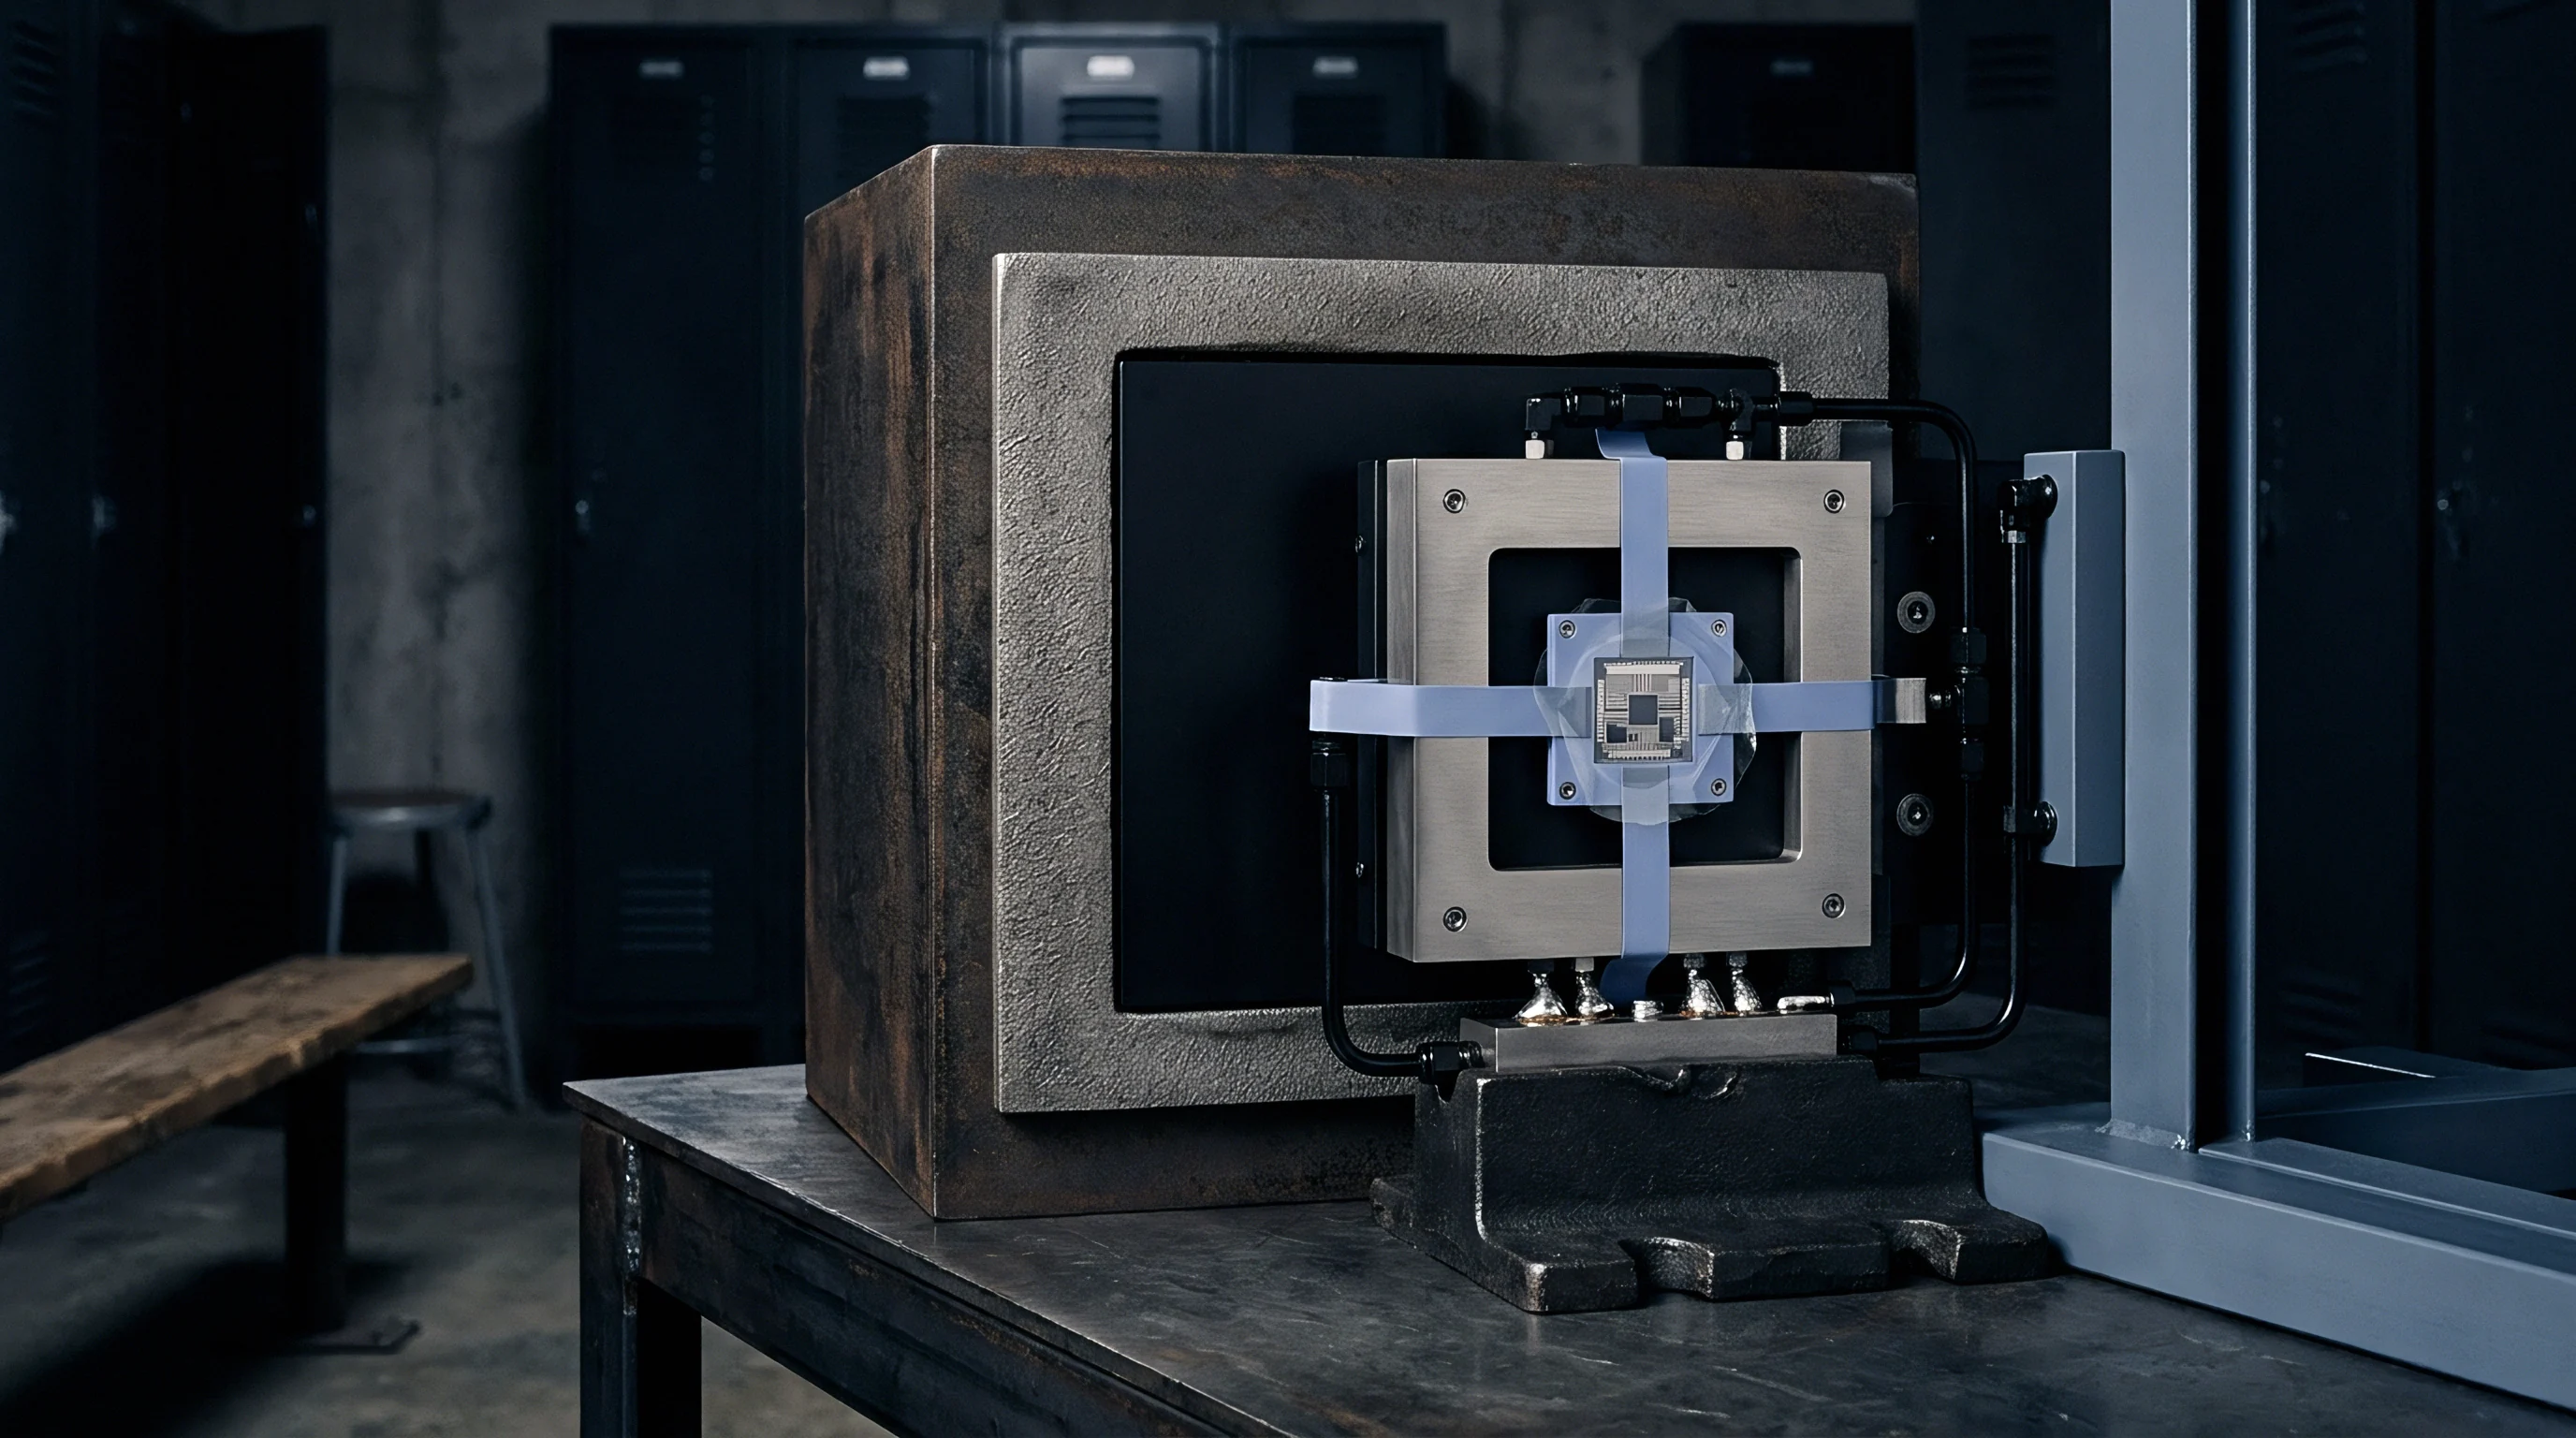
Evaluating sensor thermal stability requires characterization in an environmental chamber under fixed mechanical strain and controlled excitation. Environmental screening tests complete transducer assemblies across their full storage and operating temperature ratings. Test fixtures use four-wire Kelvin connections to eliminate lead resistance errors from high-resolution measurements.
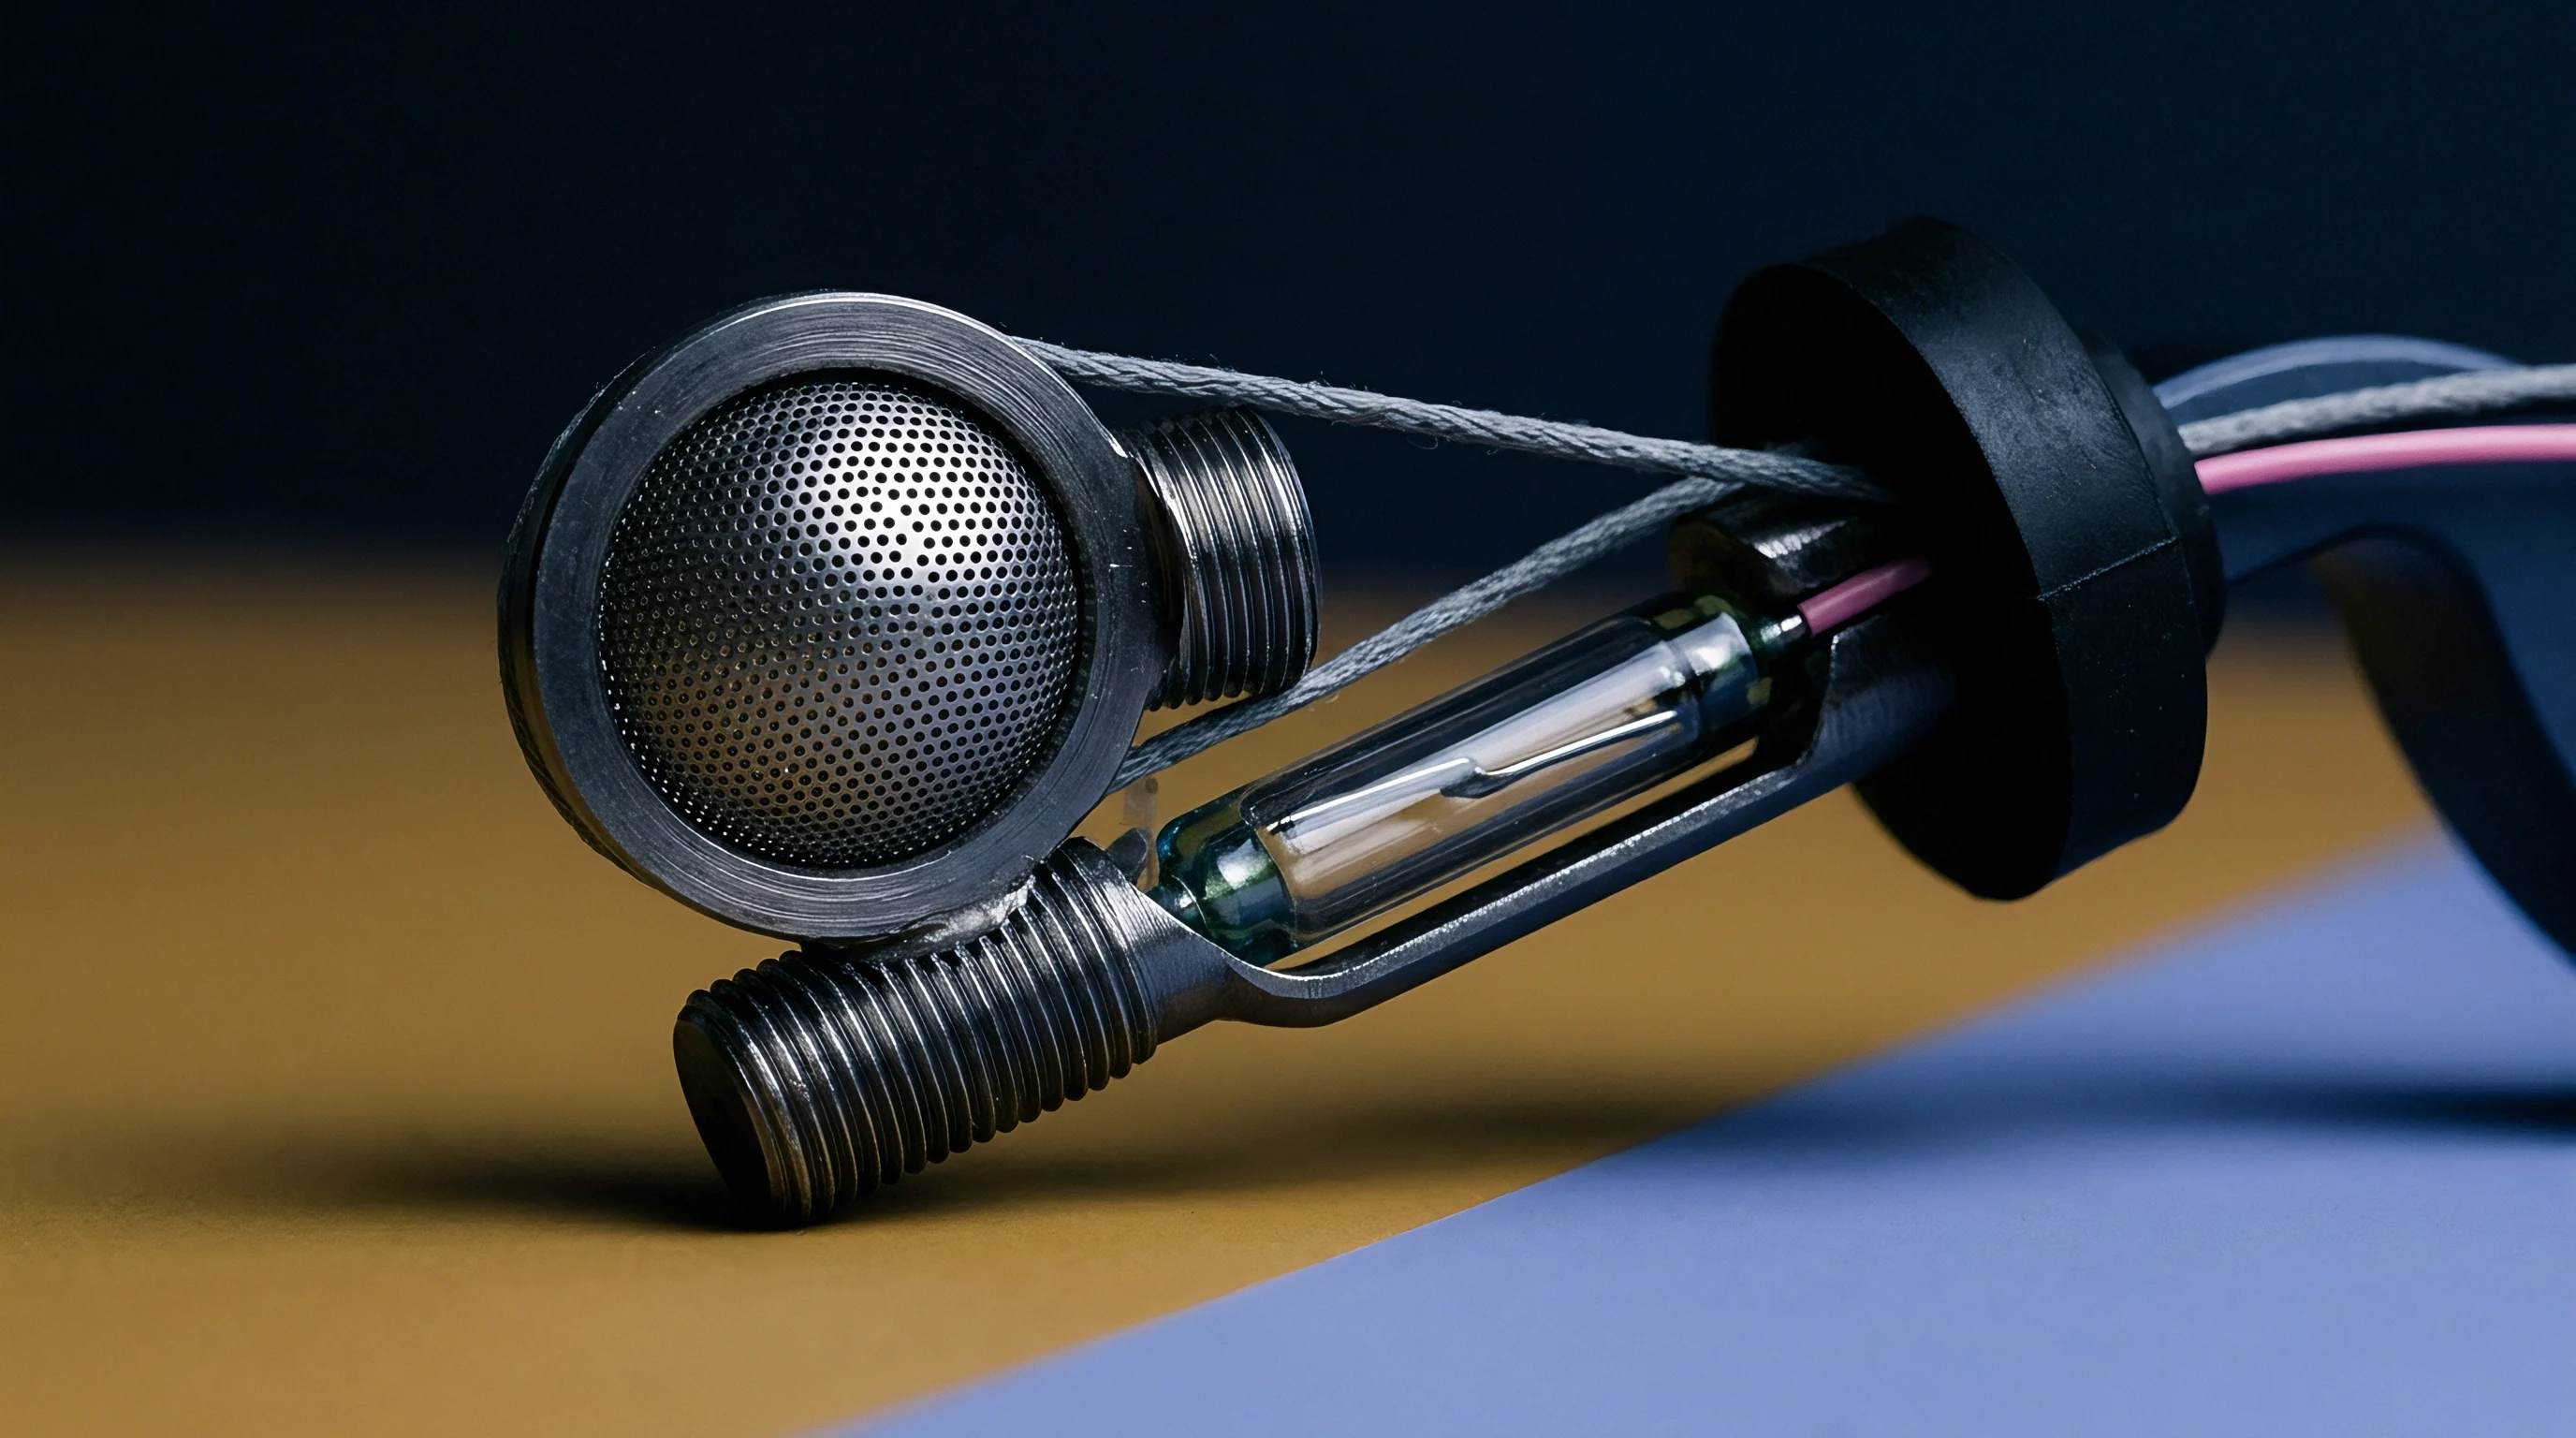
Thermal Chamber Test Methodologies
Characterization routines apply known mechanical loads to piezoresistive test structures inside thermal chambers. Automated data acquisition monitors zero offset voltage, full-scale span, and bridge input impedance at several temperature dwell plateaus. Soaking ensures the silicon die, header assembly, and die-attach materials reach thermal equilibrium before recording values.
- Mount the transducer inside the environmental chamber and wire bridge terminals to a low-noise digital multimeter utilizing 4-wire Kelvin sense paths.
- Apply reference mechanical load at room temperature to establish baseline differential bridge voltage output.
- Ramp chamber temperature in steps of 25 degrees Celsius, holding each plateau until thermal equilibrium stabilization criteria of less than 0.05 ohms per minute is met.
- Record full-scale span voltage and zero-measurand offset voltage across all target thermal plateaus.
- Compute temperature coefficient of gauge factor using linear regression across the operational band.

Extracting Thermal Coefficients of Sensitivity
Thermal calibration data yields both linear and quadratic coefficients that describe sensor response. The linear temperature coefficient captures the primary sensitivity slope across nominal spans. The quadratic coefficient accounts for thermal curvature caused by incomplete degenerate screening near temperature extremes.
Standard IEC 60747-14 clause 6.2 mandates reporting thermal sensitivity coefficients over the full rated temperature span rather than relying on room temperature extrapolation.
Accurate coefficient extraction requires isolating applied mechanical strain from package-induced thermal stresses. Thermal stress originates from coefficient of thermal expansion mismatches among the silicon die, glass frit attach layers, and metal headers. Differential expansion imposes parasitic mechanical strain on the piezoresistors, obscuring the true material thermal coefficients with structural packaging artifacts.
Standard ISO 26262 part 8 clause 10.4 requires embedded sensor suppliers to document doping density stability windows to prevent unannounced silicon wafer line changes from altering safety-critical thermal offset margins.


Spread
Foundries run boron ion implantation within defined sheet resistance and dose tolerance windows that determine final transducer yields. Beam current stability, scan uniformity, and dose integration control doping distribution across 200 mm and 300 mm wafers. Variations in dose alter both baseline sheet resistance and the resulting thermal coefficients of the piezoresistors.
Wafer Lot Ion Implantation Tolerances
Production implanters typically maintain dose uniformity within plus or minus 1.5 percent across a single wafer and plus or minus 2.5 percent across lot runs. In piezoresistive sensors, a 2 percent shift in boron concentration alters the room-temperature gauge factor by up to 3 units and moves the temperature coefficient of gauge factor by 80 ppm per degree Celsius. These process spreads translate directly into sensitivity variations across manufacturing lots.
Thermal diffusion furnaces produce radial temperature gradients during activation. Wafers positioned near quartz tube ends experience minor temperature deviations relative to central zones, altering dopant activation and diffusion depths. Foundries manage these spreads using dummy buffer wafers and multi-zone heating controls.

Sensitivity Yield and Downstream Calibration Overhead
Transducer specifications set narrow full-scale output tolerances to limit downstream calibration expenses. Broad doping distributions force test lines to scrap out-of-spec parts or run extended multi-point temperature calibrations. Laser trimming of thin-film resistor networks on signal conditioning ASICs adjusts offset and gain to absorb this wafer-level process spread.
| Process Parameter | Standard Foundry Tolerance | Tightened Target Window | Wafer Unit Cost Impact (%) | Uncalibrated Module Yield (%) |
|---|---|---|---|---|
| Implantation Dose | ±2.5% | ±0.8% | +18 | 94.2 |
| Anneal Peak Temp | ±5.0 °C | ±1.5 °C | +12 | 91.8 |
| Junction Depth xj | ±8.0% | ±3.0% | +15 | 88.5 |
| Sheet Resistance Rs | ±5.0% | ±1.5% | +22 | 96.0 |
Procurement balances front-end wafer costs against module test and calibration overhead. Purchasing wafers with tighter process windows increases substrate costs, but lowers dwell times in environmental test chambers during final product calibration.
Whether emerging atomic layer dopant deposition techniques can reduce sheet resistance variance below one percent without increasing thermal annealing defect density remains a question for next-generation MEMS fabrication lines.