Closed Loop Inertial Sensor Noise Parameters in Allan Variance Methodologies
Closed-loop inertial noise extraction isolates actuator drive noise, quantization limits, and thermal flicker through overlapping Allan variance integration bins.
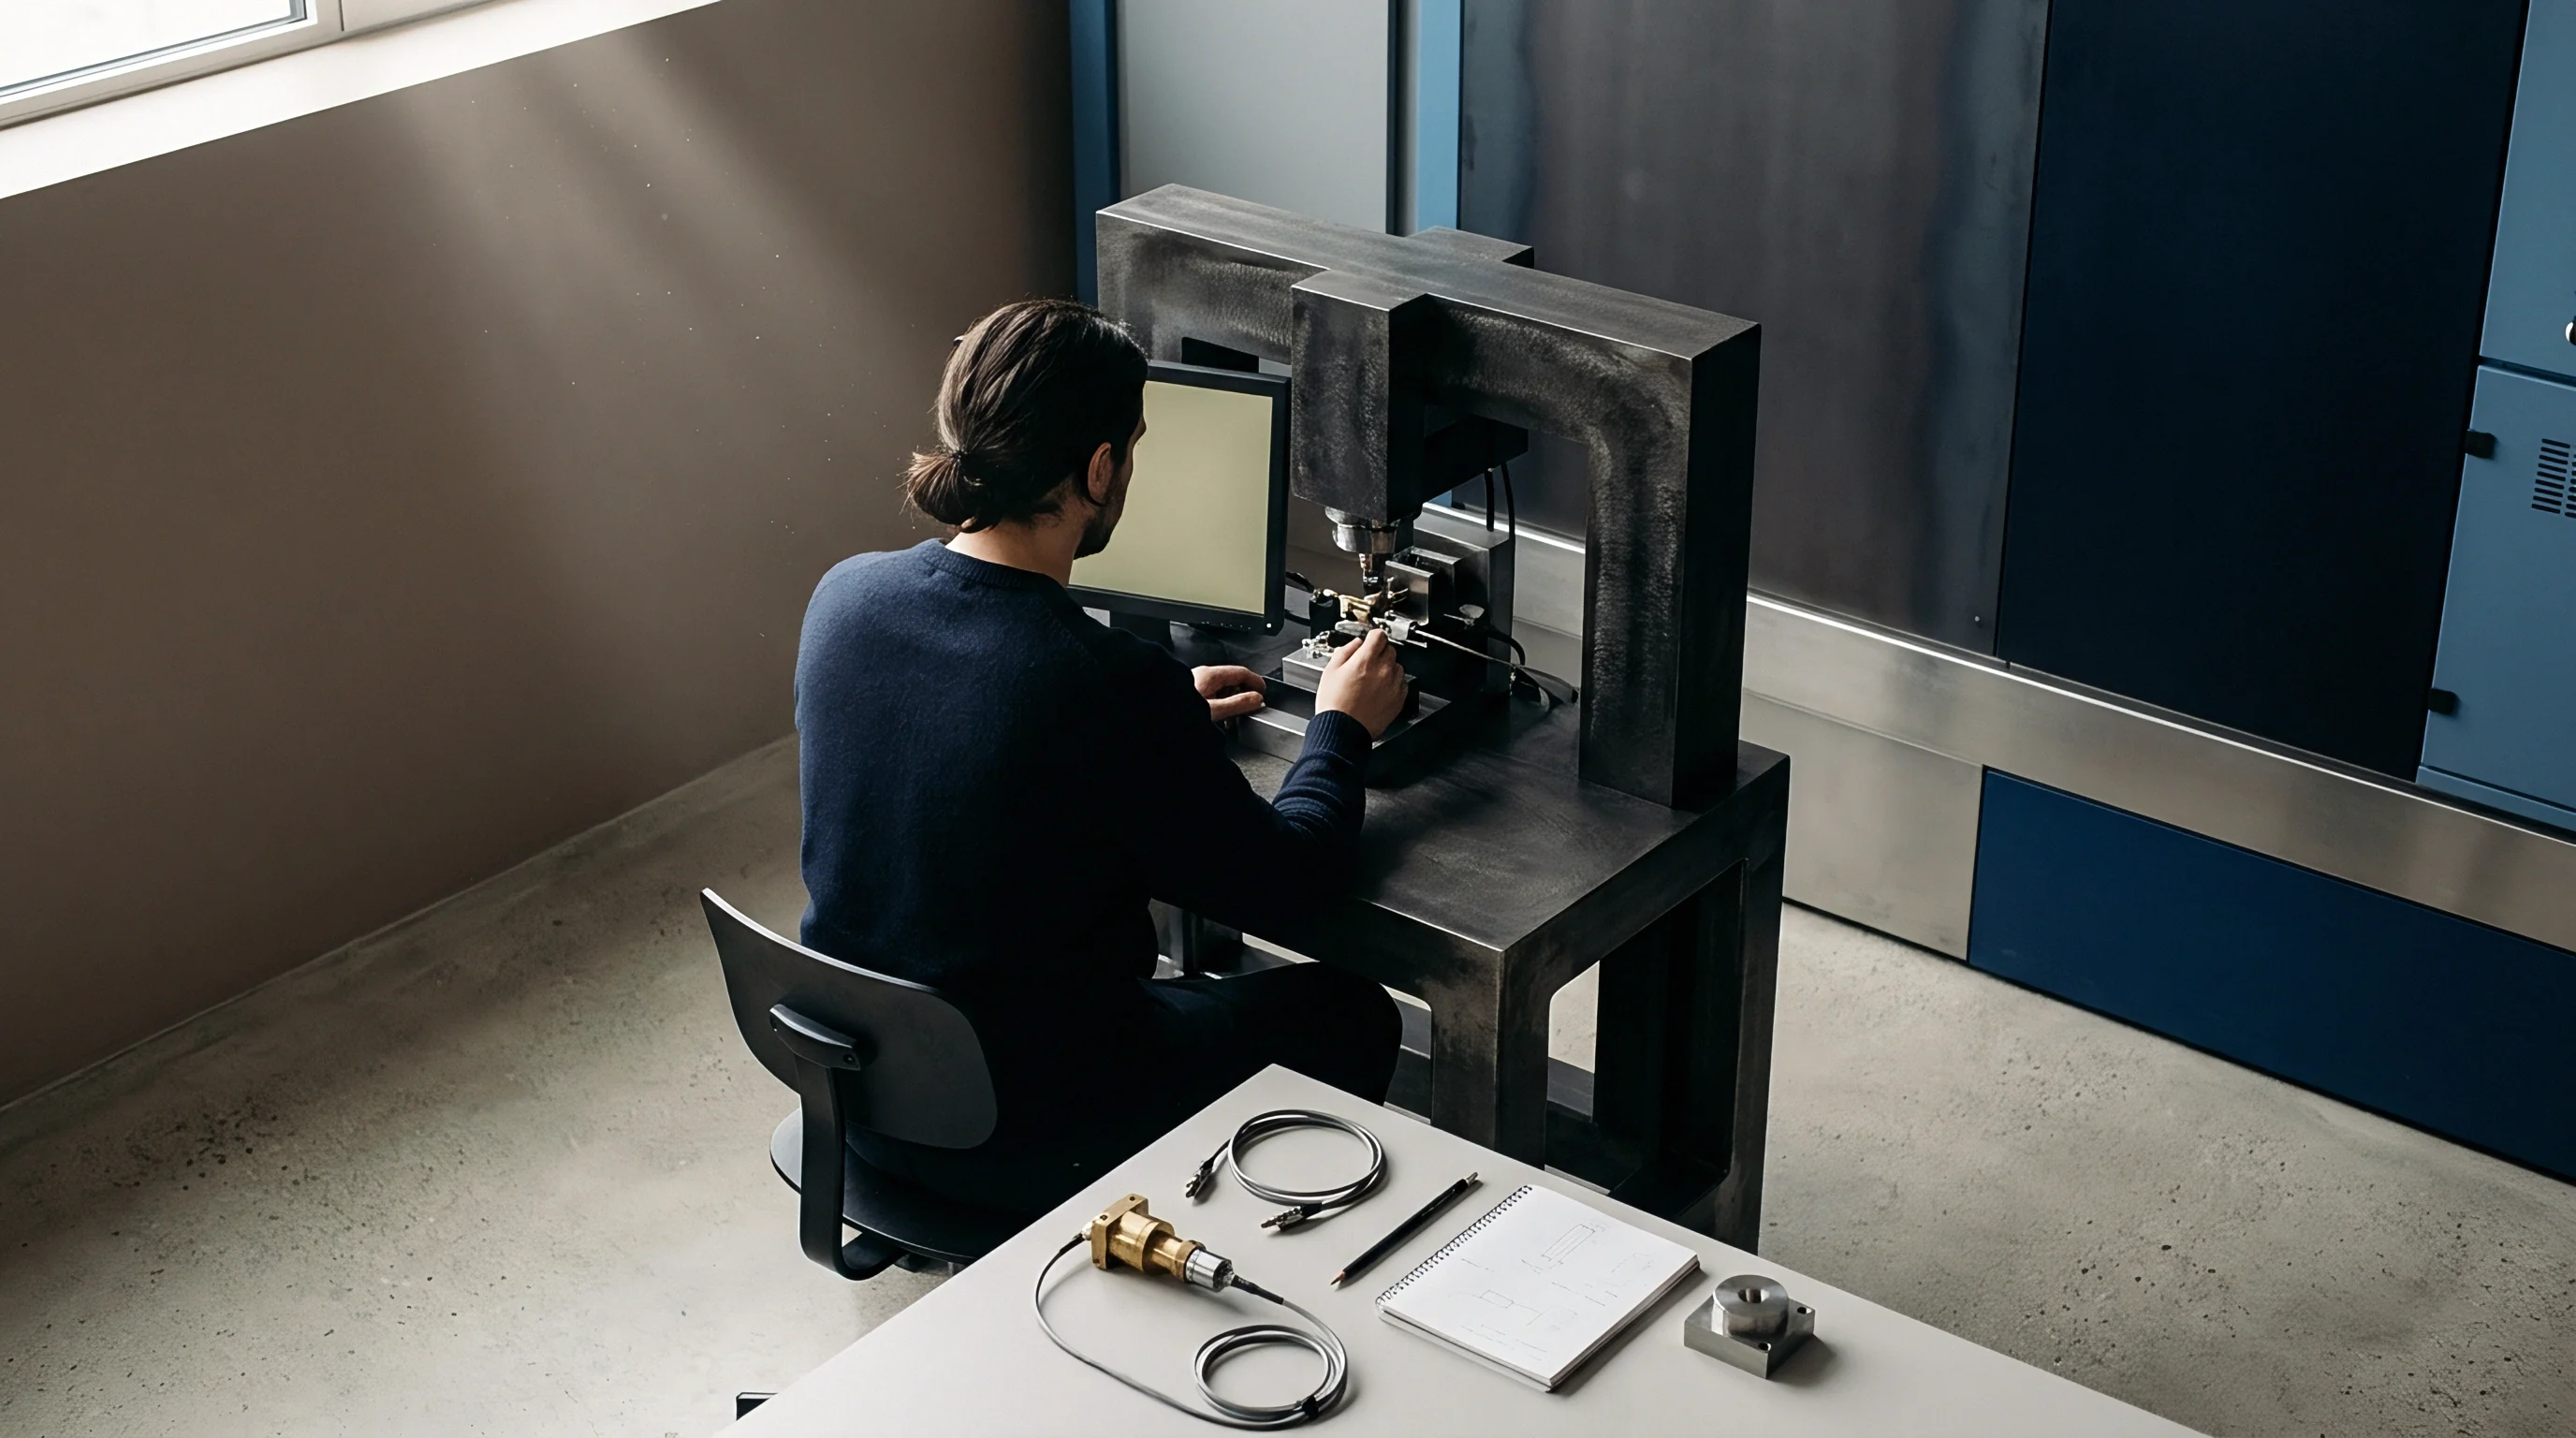
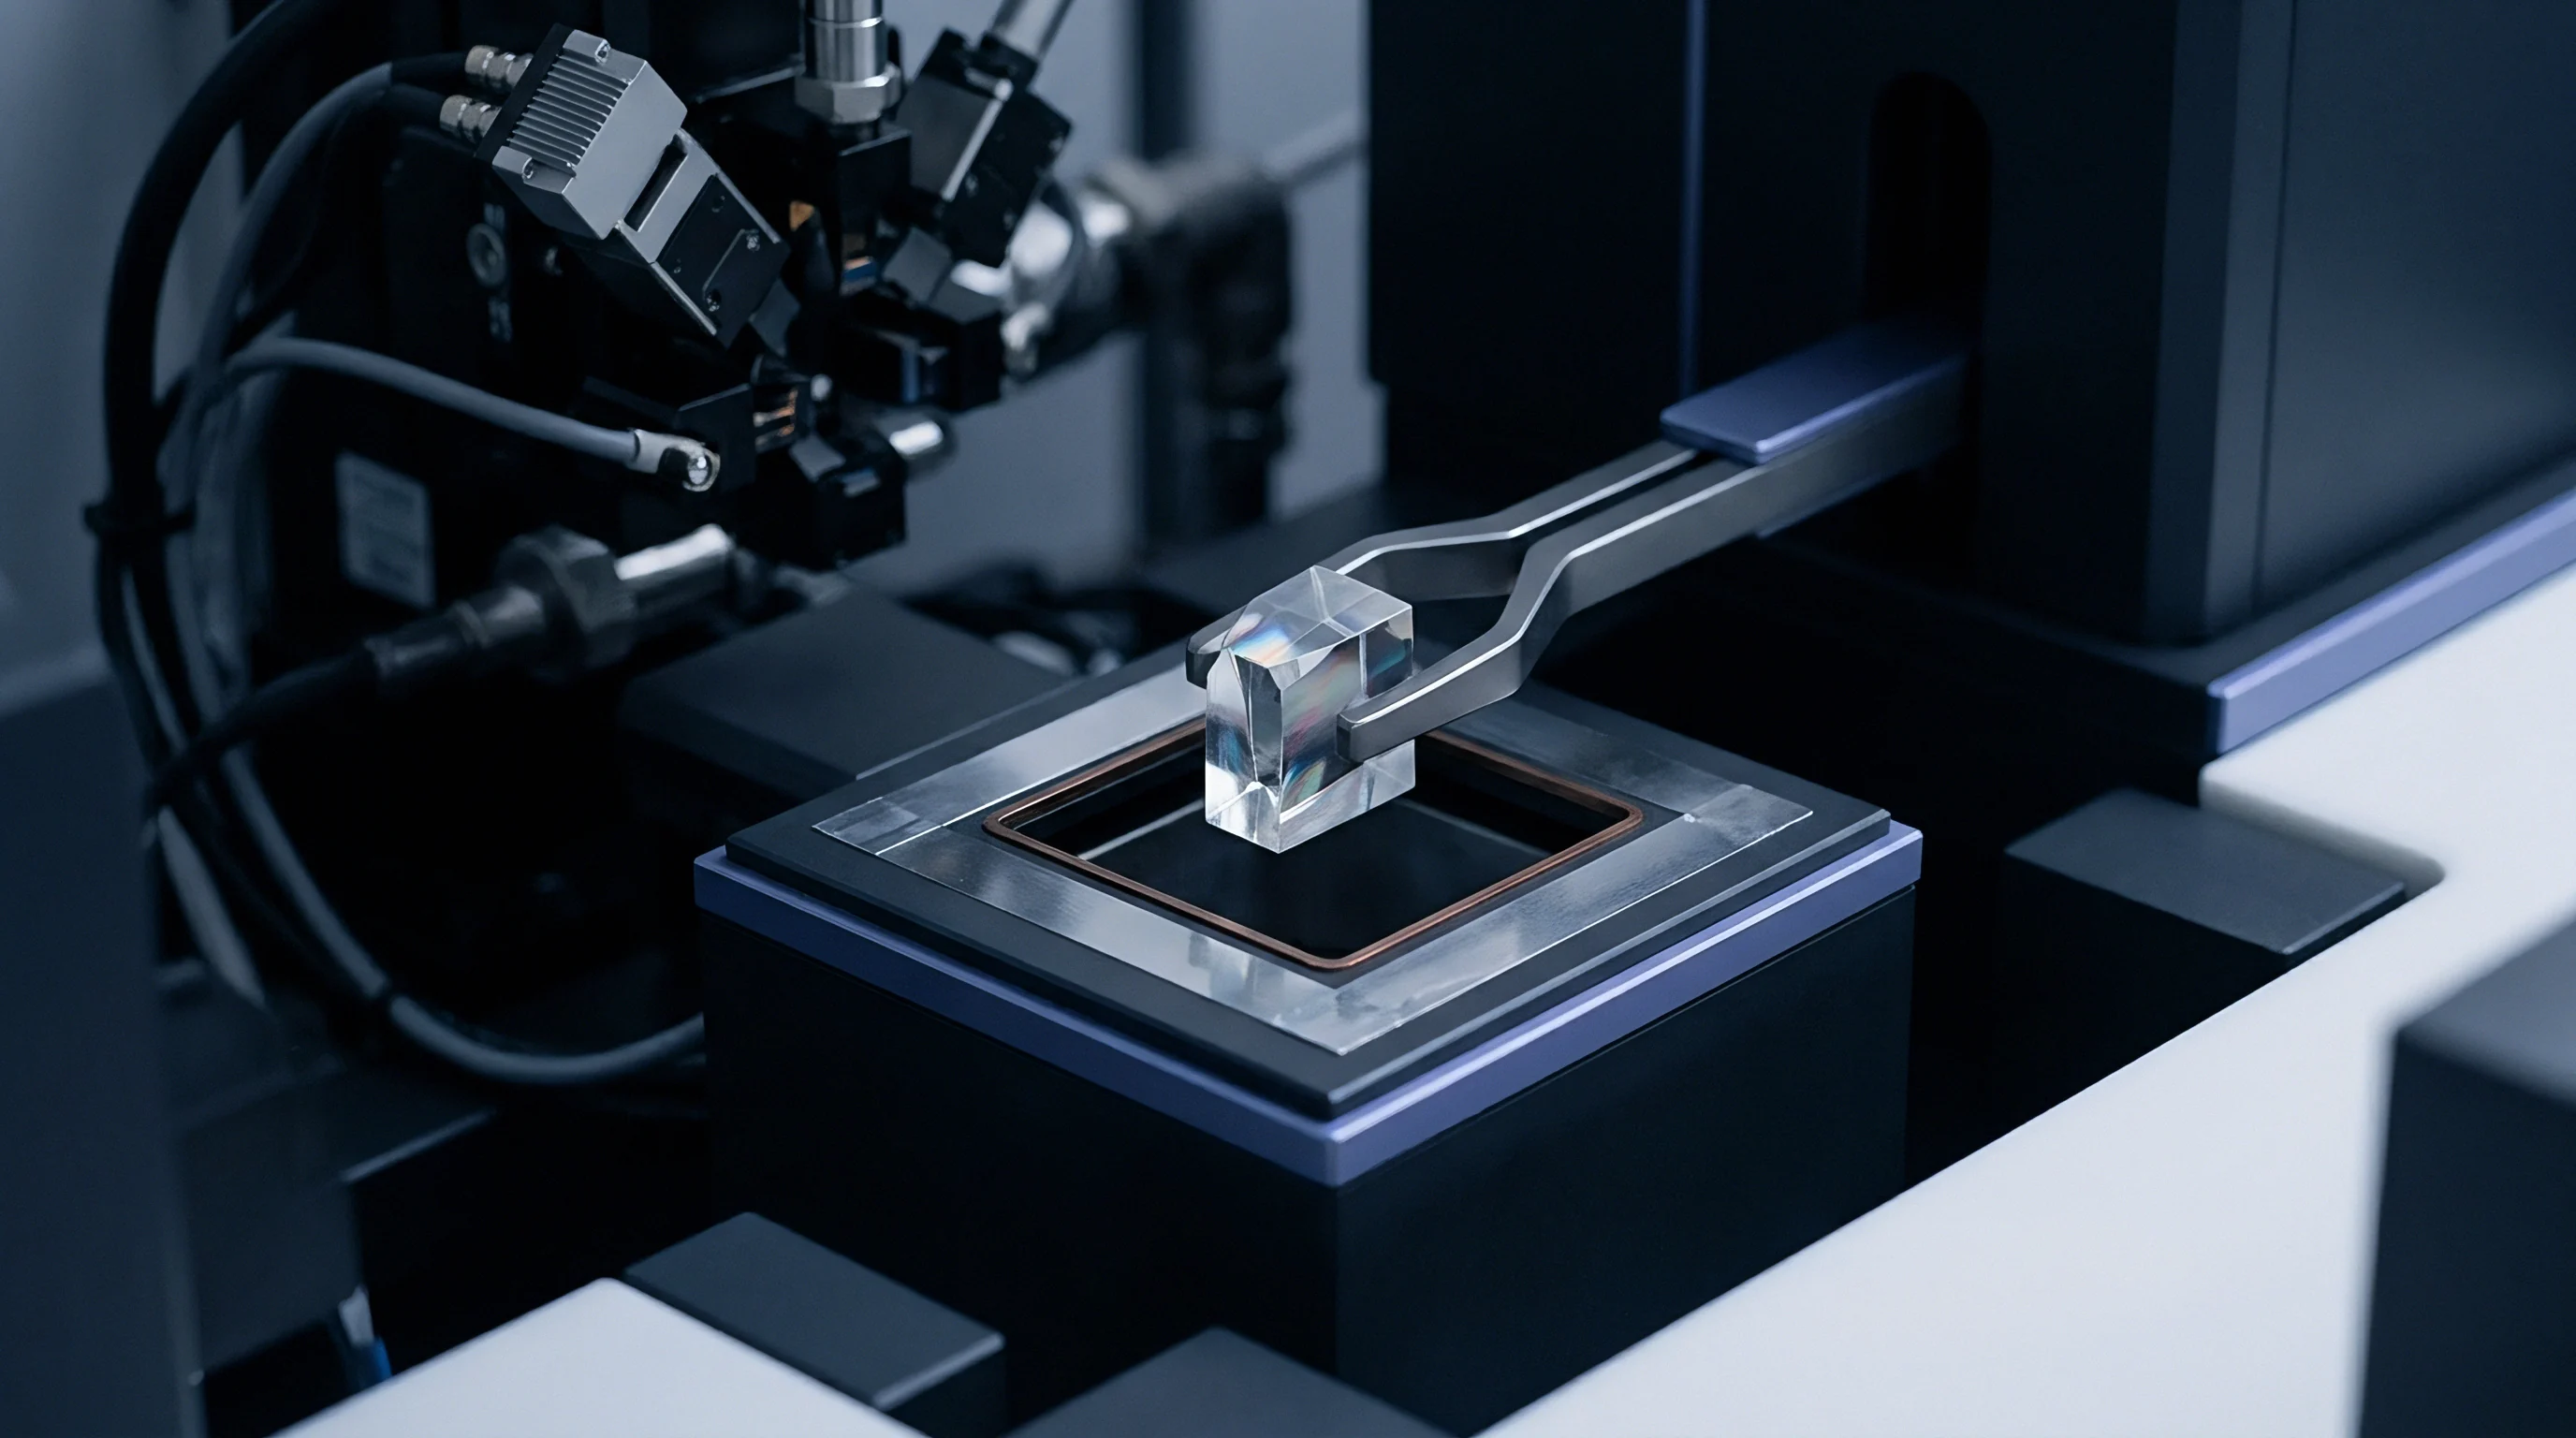
Coil
A quartz flexure accelerometer operating on a 1000 Hz digital feedback loop reports a noise density of 1.8 micro-g per square-root hertz at 25.0 degrees Celsius, yet registers 4.2 micro-g per square-root hertz when the pickoff excitation shifts ten millivolts off resonance. Restoring force applied through a magnetic or electrostatic actuator suppresses mass displacement, keeping mechanical compliance non-linearities out of the signal chain. Displacement suppression shifts the burden of sensor noise from mechanical spring hystereses directly into the feedback drive electronics.
The reported acceleration or angular rate is the exact current, voltage, or pulse stream feeding the rebalance actuator. Noise entering the measurement originates in the feedback drive amplifier, reference voltage source, pickoff demodulator, and actuator thermal dissipation.
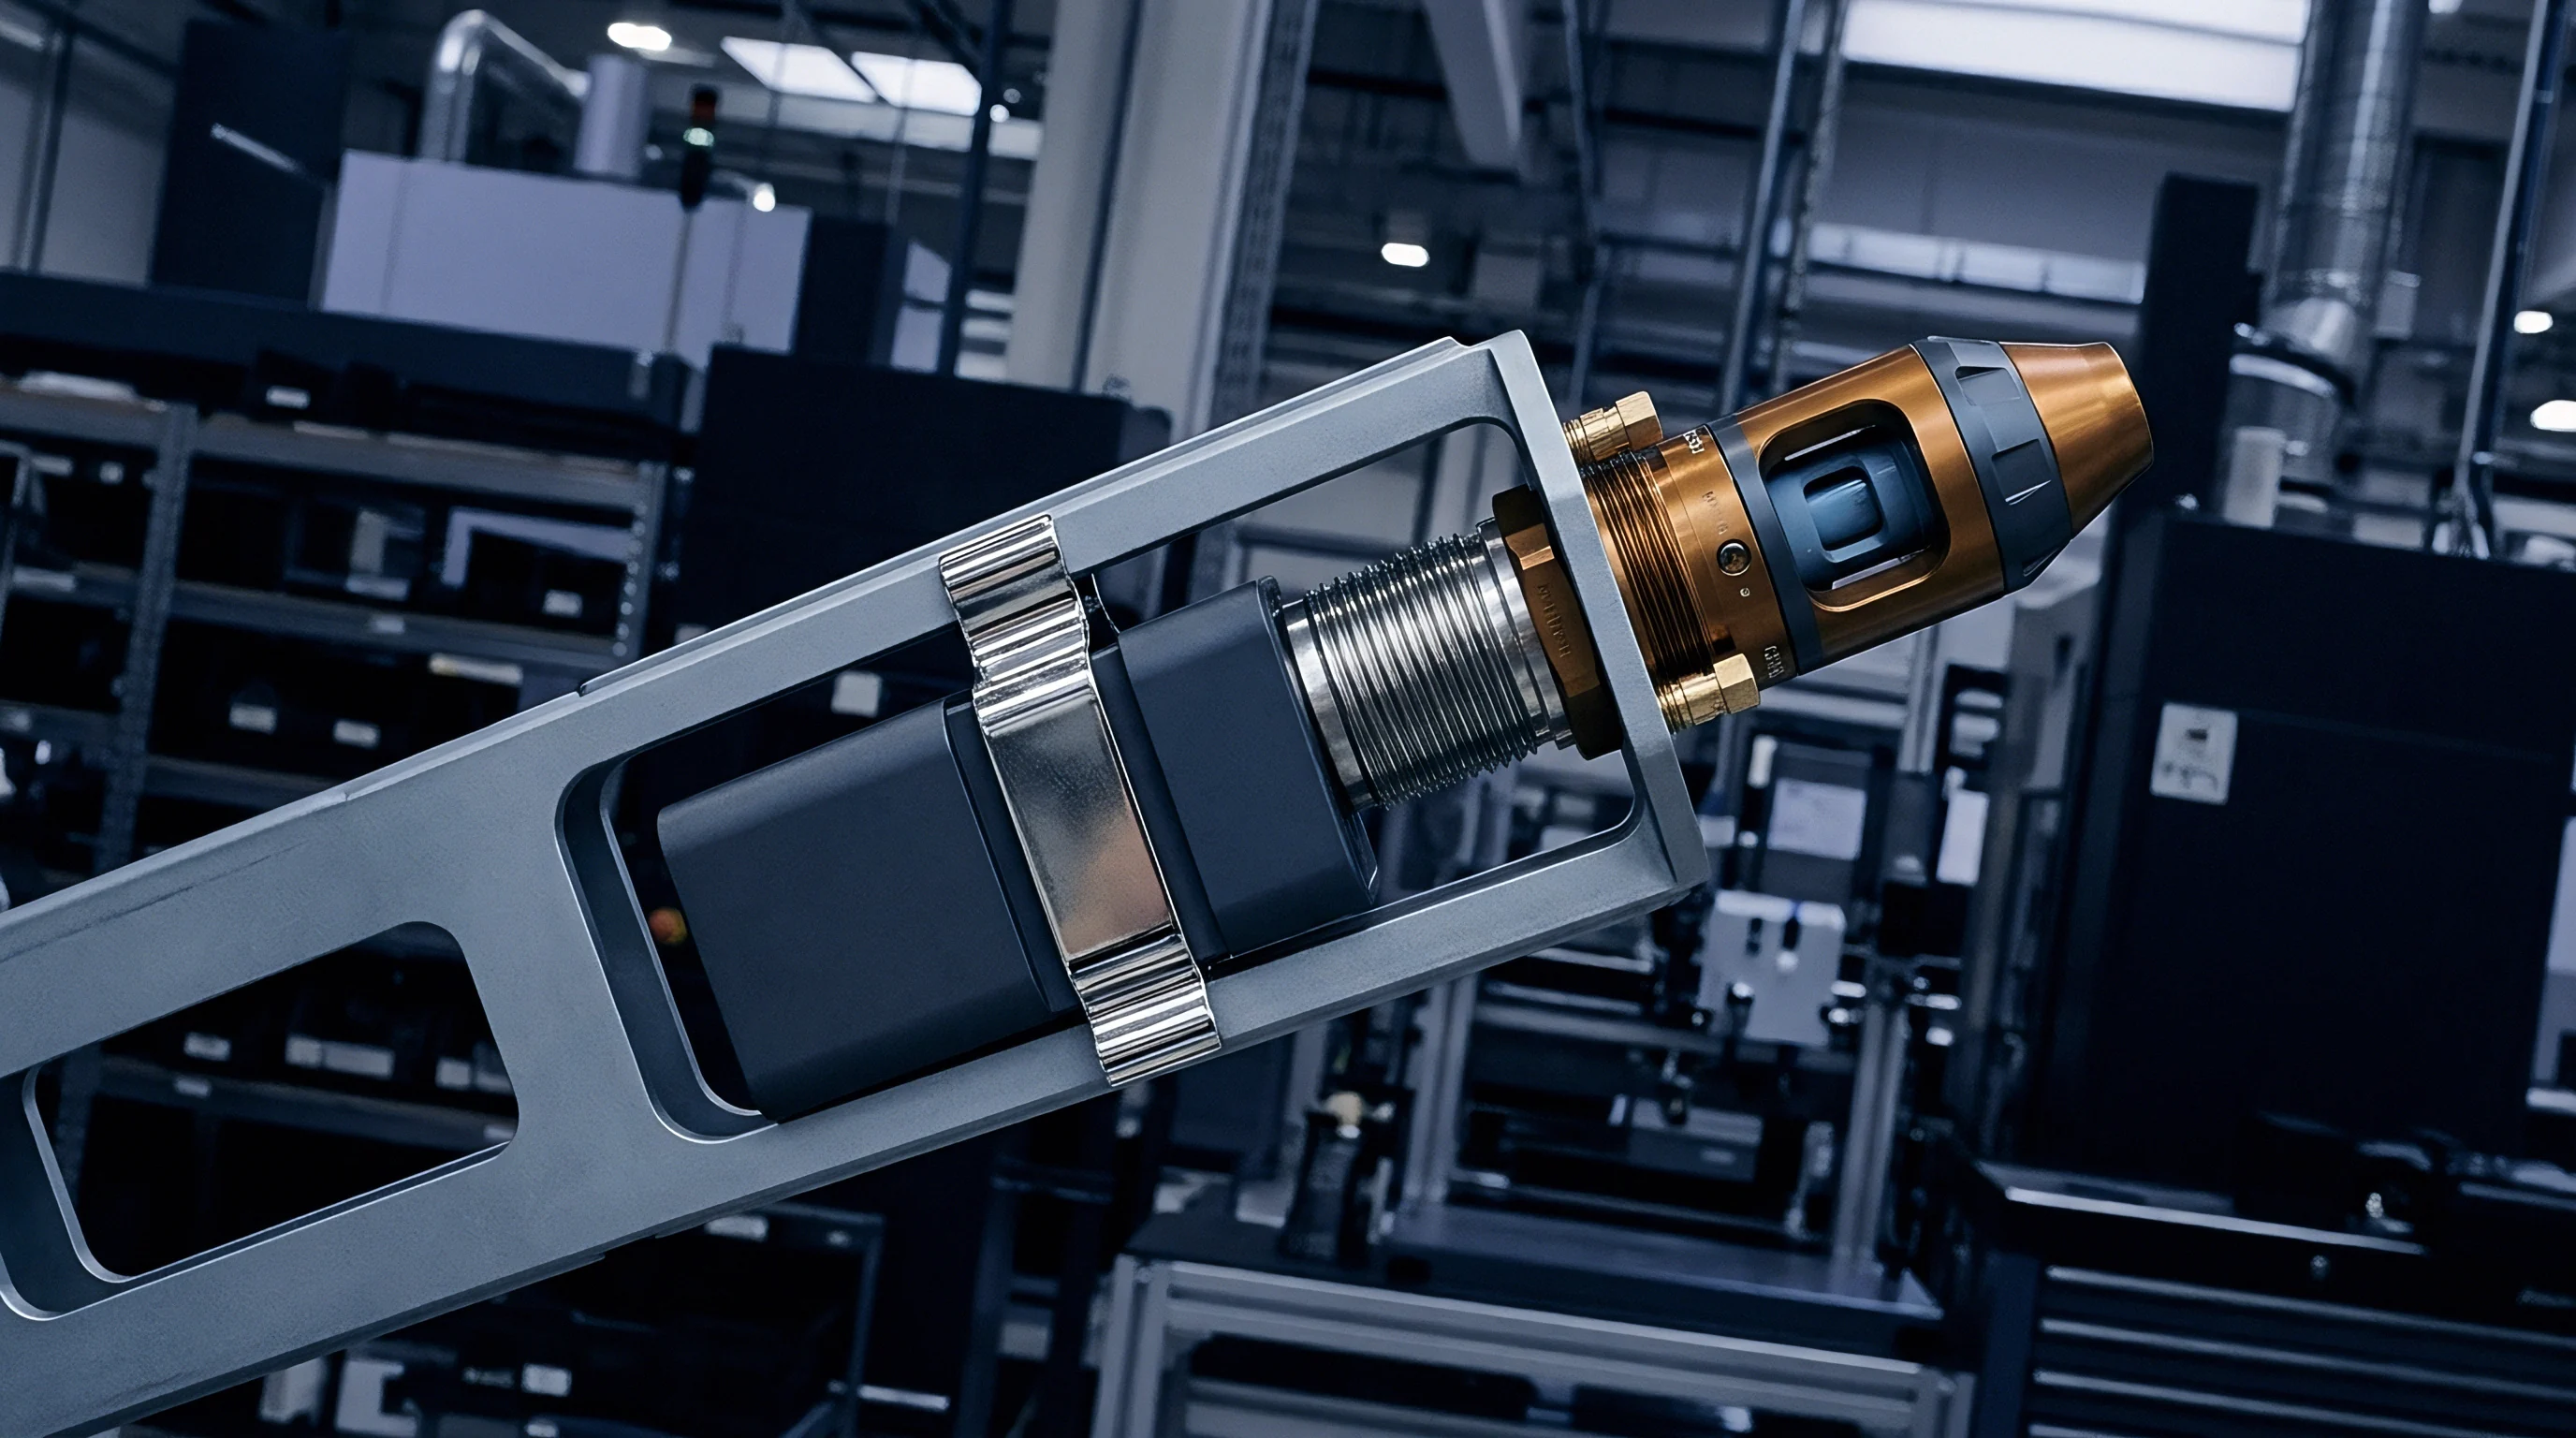
Electromechanical Force Rebalance Dynamics
Torque motors and electrostatic comb arrays maintain proof masses at an electrical null position. In an open-loop sensor, external motion deflects a spring-suspended proof mass, and capacitive or optical pickoffs translate that displacement into an output signal. Closed-loop instruments sense the minute initial deflection and route an error signal through a proportional-integral-lead controller to drive a counteracting force.
Actuation balances the inertial force directly, as shown by the Lorentz force equation F = B L I in electromagnetic units, or F = 0.5 (dC/dx) V^2 in electrostatic configurations. Keeping the mass pinned eliminates mechanical suspension fatigue, cross-axis coupling, and scale-factor non-linearities caused by large physical deflections.
Feedback current generates Joule heating. Actuator current passing through copper coils at three milliamperes produces localized thermal gradients across the flexure mounting pads. These gradients alter spring constants and shift capacitive pickoff gaps.
A closed-loop architecture exchanges mechanical displacement errors for electronic and thermal noise mechanisms. The noise floor reflects the noise of the rebalance loop rather than the Brownian noise of the proof mass itself.
Coil heating shifts mechanical null positions across long integration intervals.
The feedback loop alters the physical noise distribution across frequency bands. High open-loop forward gain pushes the closed-loop mechanical bandwidth from ten hertz out to several hundred hertz. Wide bandwidth exposes high-frequency pickoff noise, which the rebalance controller feeds back into the actuator as physical force fluctuations.
The proof mass translates electronic amplifier noise back into real physical agitation. Below twenty hertz, the loop holds the proof mass stable, and pickoff voltage noise maps directly into equivalent inertial noise.
Transduction elements inside the feedback loop introduce distinct stochastic signatures:
- Capacitive Pickoff Noise injects wideband white voltage fluctuations through differential sense amplifiers, creating white angular or velocity noise at short cluster durations.
- Actuator Reference Fluctuations introduce low-frequency flicker noise into the feedback current path, establishing the irreducible bias instability plateau of the instrument.
- Suspension Anchor Dissipation generates mechanical thermal agitation that couples directly into the proof mass, setting the ultimate physical limit for Brownian motion.
- Drive Amplifier Shot Noise feeds high-frequency current ripples into the magnetic rebalancing coils, broadening short-term velocity random walk.
Nulling motion changes thermal dissipation. When the instrument operates near zero input, coil current remains minimal. When sustained input acceleration holds the actuator against full scale, coil dissipation rises with the square of the applied load.
Temperature differences between inner proof mass suspensions and outer hermetic housings cause structural bowing. Sourcing engineers evaluating closed-loop inertial instruments must account for these internal electro-thermal feedback loops when reading manufacturer noise figures.
Thermal stability inside the housing dictates instrument bias retention far more reliably than raw pickoff sensitivity.
Cluster
Data streams acquired from closed-loop sensors require structured time-domain averaging to decouple fast feedback loop actions from slow environmental drifts. Allan variance, standardized in IEEE Std 952 and IEEE Std 1293, groups consecutive sensor outputs into finite time bins known as cluster times, designated by tau. Computing the variance between adjacent time clusters as a function of cluster duration isolates individual stochastic noise processes.
Standard Allan variance divides N total samples into non-overlapping blocks of length M, computing one mean value per block and determining the variance of adjacent block differences. Overlapping Allan variance shifts the averaging window by a single sample period rather than an entire cluster interval, multiplying the available degrees of freedom without extending physical test durations.
Overlapping Bin Mechanics
Given a total continuous record of N discrete samples taken at sample interval tau_zero, the sensor output can be represented as an accumulated phase or velocity array Y_k. The overlapping Allan variance for any cluster duration tau = m tau_zero is calculated using all possible sample pairs separated by m intervals:
sigma^2(m tau_zero) = (1 / (2 m^2 (N – 2 m) tau_zero^2)) sum_{k=1}^{N-2 m} (Y_{k+2 m} – 2 Y_{k+m} + Y_k)^2
The proof mass remains stationary. The data processing pipeline forms overlapping clusters, maximizing the statistical reliability of the computed variance. At long cluster intervals approaching ten percent of the total run duration, non-overlapping Allan variance yields wide confidence bands due to sparse cluster counts.
Overlapping cluster processing tightens confidence intervals by thirty to fifty percent for equivalent run lengths, permitting shorter continuous chamber dwells during incoming qualification.
A continuous 36-hour test duration yields a confidence interval of plus or minus twelve percent on bias instability at an integration tau of one thousand seconds.
Sample rate dictates the floor. Digitizers operating at 1000 Hz yield millions of data points over a 24-hour baseline test. Decimating raw outputs down to 100 Hz suppresses wideband electronic noise before Allan variance processing, but masks high-frequency loop dynamics.
Decimation replaces genuine wideband feedback ripple with digital filter passband droop and alias spurs.
| Integration Tau (s) | Minimum Record Length (h) | Total Clusters (Overlapping) | Relative Confidence Band (%) | Targeted Noise Identification |
|---|---|---|---|---|
| 0.01 | 1.0 | 359,900 | 0.2 | Quantization Noise, Feedback Ripple |
| 1.0 | 4.0 | 14,390 | 1.2 | Angle / Velocity Random Walk |
| 100.0 | 24.0 | 863 | 4.8 | Flicker Bias Instability Floor |
| 1,000.0 | 72.0 | 258 | 8.8 | Rate Random Walk, Actuator Drift |
| 10,000.0 | 240.0 | 85 | 15.4 | Rate Ramp, Thermal Gradient Drift |
| Values assume continuous sampling at 100 Hz under stable chamber conditions with temperature fluctuations below 0.05 degrees Celsius. | ||||
Long runs demand thermal chambers. When an unjacketed sensor sits on a test pier for forty-eight hours, building diurnal thermal cycles introduce a pseudo-sinusoidal drift that registers in the Allan deviation plot as an artificial rate random walk. Valid parameter extraction demands environmental chambers controlled to within 0.05 degrees Celsius per hour, or simultaneous multi-channel recording of internal temperature sensors for post-test polynomial residual stripping.
Data streams parsed into overlapping bins yield clean variance estimates across six decades of integration time, revealing where rebalance dynamics give way to sensor drift.

Slope
Plotting overlapping Allan deviation sigma(tau) against cluster duration tau on logarithmic axes produces distinct geometric gradients. Each noise process displays a characteristic power spectral density slope that translates into a specific gradient on the Allan deviation curve. In closed-loop instruments, these gradients reflect both sensor physics and feedback loop filters.
The standard noise categories defined by IEEE Std 952 include Quantization Noise, Angle or Velocity Random Walk, Bias Instability, Rate Random Walk, and Rate Ramp.

Five Parameter Extraction Regimes
Logarithmic slopes define the mathematical parameters required for Kalman filter covariance profiles. Slope identification demands graphical rigor.
- Quantization Noise (Q) displays a slope of minus one on the Allan deviation curve, originating from digital-to-analog converter resolution boundaries and pulse rebalance switching edges.
- Random Walk (N) presents a slope of minus one-half, driven by white broadband noise in the pickoff preamplifier and actuator current references.
- Bias Instability (B) forms a flat line with a slope of zero at the curve minimum, reflecting low-frequency flicker noise in the analog electronics and feedback references.
- Rate Random Walk (K) exhibits a slope of plus one-half, produced by continuous random wander in the mechanical null and thermal distribution within the suspension.
- Rate Ramp (R) climbs at a slope of plus one, representing deterministic linear drift caused by structural stress relaxation or steady temperature shifts.
Averaging suppresses uncorrelated broadband noise. As tau expands, white noise averages down along the minus one-half slope line until the sensor reaches its bias instability floor. The flat region at slope zero represents the optimal averaging interval tau_b for the instrument.
Integrating the sensor output beyond tau_b degrades navigation accuracy, as positive-slope noise processes begin to dominate.
The minimum point of the Allan deviation curve marks the absolute temporal limit of beneficial averaging.
| Noise Parameter | Curve Slope | Conversion Formula | Standard Units (Rate Gyro) | Standard Units (Accelerometer) |
|---|---|---|---|---|
| Quantization Noise (Q) | -1 | Q = sigma(tau) tau / sqrt(3) | arcsec | m / s |
| Random Walk (N) | -1/2 | N = sigma(1) | deg / sqrt(h) | m / s / sqrt(h) |
| Bias Instability (B) | 0 | B = sigma(tau_b) / 0.6643 | deg / h | micro-g |
| Rate Random Walk (K) | +1/2 | K = sigma(3) sqrt(3) | deg / h^(3/2) | m / s^2 / sqrt(h) |
| Rate Ramp (R) | +1 | R = sigma(sqrt(2)) sqrt(2) | deg / h^2 | micro-g / h |
What Modulates Angle Random Walk in Force Rebalance?
Wideband noise in closed-loop instruments depends on the balance between loop damping and pickoff gain. In an open-loop sensor, Brownian motion sets the white noise limit. In a closed-loop system, increasing the loop bandwidth to 200 Hz injects broad-spectrum electronic noise directly into the rebalance coil.
High-frequency pickoff noise, when fed through phase-lead compensation networks, amplifies white noise at tau values between 0.01 and 1.0 seconds.
Consider a closed-loop force-rebalance accelerometer sampled at 1000 Hz across a 36-hour continuous baseline dwell at 25.0 degrees Celsius. The raw Allan deviation curve reveals:
At tau = 0.003 seconds, sigma(tau) is 6.8 micro-g. Evaluating the quantization noise conversion Q = sigma(tau) tau / sqrt(3) gives Q = 6.8 0.003 / 1.732 = 0.0118 micro-g-seconds.
At tau = 1.0 second, along the minus one-half slope, sigma(1) measures 1.2 micro-g. The velocity random walk is N = 1.2 micro-g per square-root hertz, equivalent to 0.0071 meters per second per square-root hour.
The curve reaches its minimum flat floor between tau = 80 seconds and tau = 240 seconds, where sigma(tau) drops to 0.38 micro-g. Applying the IEEE standard coefficient, B = 0.38 / 0.6643 = 0.572 micro-g.
Beyond tau = 500 seconds, the curve climbs along a plus one-half slope, reaching 1.1 micro-g at tau = 3000 seconds. Calculating rate random walk K = sigma(3000) sqrt(3 / 3000) yields K = 1.1 sqrt(0.001) = 0.0348 micro-g per square-root second.
Flicker noise resists time averaging. How loop phase margins interact with thermal settling to fix the absolute bias instability floor remains an active dispute between sensor design teams and navigation analysts.
Spur
Pulse-width modulation and pulse-density modulation rebalance schemes inject discrete frequency spikes into the output spectrum. Open-loop sensors generate smooth broadband noise spectra, while closed-loop digital feedback architectures exhibit deterministic limit cycles. A limit cycle occurs when a high-gain digital rebalance loop oscillates between adjacent quantization states at a frequency determined by loop delay and proof mass inertia.
These oscillations produce distinct harmonic peaks in the power spectral density. On the log-log Allan deviation plot, a single sinusoidal spur does not present a single point, but appears as a broad hump spanning more than a decade of cluster time.
Which Mechanisms Distort Bias Instability Minima?
Interference spikes shift the true minimum of the Allan variance curve upwards, leading engineers to report pessimistic bias instability figures. When a digital pulse-density rebalance clock runs at 100 kHz and the pickoff demodulator operates at an unsynchronized 98 kHz, a 2 kHz beat tone circulates through the feedback loop. This beat frequency acts as a deterministic dither signal, exciting high-order dynamics and elevating the noise floor across intermediate averaging times.
Control loop non-linearities distort extracted Allan variance parameters through several verified pathways:
- Limit Cycle Oscillations generate apparent quantization humps that elevate short-term tau variance curves, mimicking broadband white noise.
- Clock Jitter in Rebalance Switching broadens discrete tonal spikes into sidebands, artificially raising the apparent velocity random walk parameter.
- Demodulator Aliasing folds high-frequency feedback carrier ripple into baseband measurement bands, distorting the minus one-half slope.
- Thermal Actuator Ringing introduces low-frequency damped oscillations that distort the transition region between white noise and flicker floors.
Limit cycles generate persistent spurs. Actuator saturation destroys loop stability. Quantization steps inject artificial variance.
Thermal gradients shift physical null. When these dynamic effects interact, the calculated bias instability point can shift by a factor of three depending on whether the cluster time matches or bridges the limit cycle period.
Bypassing synchronized demodulation clocks risks introducing persistent cyclic tones that corrupt long-term inertial navigation integration filters.

Contract
Procurement agreements for tactical and navigation grade inertial units turn on parameter extraction methods that suppliers choose to publish. A vendor datasheet claiming a bias instability of 0.05 degrees per hour often conceals that the figure was obtained using dynamic Allan variance with optimal temperature compensation post-processed in software, rather than raw operational output. Commercial disputes arise when an incoming inspection audit on a 48-hour dwell test yields an overlapping Allan deviation floor of 0.22 degrees per hour because the vendor used non-overlapping bins with smoothing filters applied prior to calculation.
Datasheet Ambiguities and Incoming Audit
Test duration dictates commercial compliance. Suppliers seeking to minimize production test costs often truncate dwell cycles to four hours. Four hours of continuous collection provides statistical validity only up to a cluster time of 144 seconds, entirely missing the long-term rate random walk and thermal relaxation slopes that manifest past one thousand seconds.
An instrument certified on a four-hour test run provides zero statistical assurance regarding navigation performance over multi-hour operational missions.
Procurement agreements govern test durations. Incoming inspection screens production batches. Stationarity assumptions collapse over days.
Chamber cycling introduces spurious drift. When testing spans seventy-two hours, building vibrations and laboratory thermal cycles inevitably corrupt sensor outputs unless isolated on seismic test blocks inside climate chambers.
| Parameter | Datasheet Practice (Aggressive) | IEEE 952/1293 Compliant Requirement | Commercial Risk Exposure |
|---|---|---|---|
| Random Walk (N) | Sampled at 10 kHz, decimated with FIR | Raw output at rated control bandwidth | Masks high-frequency loop instability |
| Bias Instability (B) | Smoothed point minimum, short dwell | 0.6643 factor on overlapping minimum | Understates actual in-run drift by 2x to 3x |
| Test Duration | 2 to 4 hours per axis | Minimum 36 to 72 hours per axis | Fails to detect long-term thermal walk |
| Data Processing | Non-overlapping bins, 3-point smoothing | Overlapping Allan variance, no smoothing | Generates artificially narrow confidence bounds |
| Temperature Control | Post-processed thermal modeling | Raw sensor output at constant chamber setpoint | Hides physical thermal gradient sensitivity |
IEEE Std 952 requires reporting the exact time cluster tau_b corresponding to the bias instability minimum alongside the numerical variance value.
Sourcing contracts must explicitly bind vendor qualification to IEEE Std 952 Annex C for gyroscopes and IEEE Std 1293 for accelerometers. The contract statement must specify the minimum test run duration, the data decimation boundary, and the mandatory use of overlapping Allan variance routines without mathematical smoothing or thermal post-filtering.
Section 8.2 of standard procurement contract template ARP-NAV-04 specifies that any reported bias instability parameter must be accompanied by the raw overlapping Allan deviation log-log plot, the exact cluster duration at the minimum point, and an unbroken continuous test log of at least thirty-six hours taken on an isolated seismic pier.