Acoustic Microscopy Detection Limits for Interfacial Microcracks in Power Modules
Phase-inversion acoustic microscopy detects sub-micron interfacial microcracks down to 35 nanometer gaps by tracking negative RF reflection polarity.


Echo
Ultrasonic pulse behavior at bonded material boundaries depends on mechanical stiffness contrast. Sound wave propagation through power electronic modules encounters multiple solid-to-solid interfaces, including semiconductor dies, attachment layers, ceramic isolation substrates, and heavy copper baseplates. High-frequency acoustic energy transmitted through a coupling fluid hits these material boundaries, where variations in density and longitudinal acoustic velocity govern the ratio of reflected to transmitted wave amplitude.
Acoustic impedance, defined as the product of mass density and longitudinal sound velocity (Z = ρ·c), dictates boundary behavior. Intact interfaces between dense materials transmit sound energy across the joint. Copper paired with aluminum nitride exhibits an impedance mismatch that allows substantial transmission.
Air or vacuum trapped inside an interfacial crack exhibits near-zero acoustic impedance. Sound waves striking a solid-to-air boundary reflect completely due to the extreme impedance differential.

Interfacial Acoustic Reflection and Boundary Mismatch
When ultrasonic energy strikes an intact joint between copper and aluminum nitride, sound waves traverse the boundary with minimal scattering. Reflected signal amplitude scales directly with the reflection coefficient equation R = (Z2 – Z1) / (Z2 + Z1). Intact metallurgical and ceramic bonds display low reflection coefficients, yielding minimal signal amplitude in the returning time-domain waveform.
Interfacial microcracks disrupt continuous mechanical contact, creating a solid-to-gas boundary where acoustic impedance drops from tens of MegaRayls down to approximately 400 Rayls.
| Material Interface | Density 1 / Density 2 (g/cm³) | Velocity 1 / Velocity 2 (m/s) | Impedance Z1 / Z2 (MRayl) | Calculated Reflection Coefficient (R) |
|---|---|---|---|---|
| Silicon to SAC305 Solder | 2.33 / 7.36 | 8430 / 4700 | 19.6 / 34.6 | 0.276 |
| Silicon Carbide to Silver Sinter | 3.21 / 8.50 | 11800 / 3900 | 37.9 / 33.2 | -0.066 |
| Copper to Aluminum Nitride (AlN) | 8.96 / 3.26 | 4660 / 11000 | 41.8 / 35.9 | -0.076 |
| Copper to Silicon Nitride (Si3N4) | 8.96 / 3.20 | 4660 / 11100 | 41.8 / 35.5 | -0.081 |
| Copper to Microcrack Air Gap | 8.96 / 0.0012 | 4660 / 343 | 41.8 / 0.0004 | -0.999 |
Sound speed sets depth calibration. Total reflection occurs when sound encounters air voids. An air-filled separation yields a reflection coefficient magnitude near 1.0.
Negative signs indicate a 180-degree phase reversal relative to the incident wave phase. Phase reversal distinguishes actual physical separation from dense inclusions or secondary material phases. High-contrast reflection makes ultrasonic microscopy capable of identifying planar separations far thinner than the focal spot beam width.
Acoustic impedance contrast across an intact interface governs energy transmission while air-filled voids mirror nearly all incident sound.
Physical crack opening displacement frequently falls below one micrometer in power electronic packages. Detecting sub-micron air gaps relies on stress-free surface wave mechanics rather than classical beam obscuration. Ultrasonic waves interact with thin air gaps through destructive interference of reflections from the top and bottom crack surfaces.
When gap thickness drops below one-tenth of the acoustic wavelength in the medium, acoustic wave reflection amplitude scales with gap width due to mechanical wave tunneling.

Sub-Wavelength Gap Resolution Mechanics
Acoustic waves reflect off microcracks even when the separation gap is two orders of magnitude smaller than the acoustic wavelength. A 100 MHz ultrasonic pulse propagating through copper has a wavelength of approximately 46.6 micrometers. A microcrack with an air gap of 50 nanometers represents less than 0.0011 acoustic wavelengths.
Stress-free boundary conditions force sound wave reflections because air cannot support transverse or longitudinal shear stress transfer across the gap.
- Transducer Excitation ~ A high-voltage spike excites the piezoelectric element, generating a broadband ultrasonic plane wave that propagates through fluid coupling into the device package.
- Bulk Media Attenuation ~ Sound traverses top metallization and semiconductor die layers, absorbing higher-frequency spectral components according to material damping coefficients.
- Interfacial Scattering ~ Sound strikes the sub-micron crack gap, where zero acoustic stiffness forces complete reflection accompanied by phase inversion.
- Signal Capture ~ The reflected wave returns to the transducer surface, generating an RF voltage trace captured by high-speed digitizers.
Interfacial microcrack detection fails when compressive residual stress closes the crack surfaces together. Mechanical contact across crack faces permits acoustic wave transmission, masking the defect during un-stressed inspection. Crack opening displacement must exceed tens of nanometers to break acoustic coupling completely.
Applied thermal or mechanical bias during scanning opens tight cracks, re-establishing high-contrast reflection signals.
Acoustic impedance governs reflected energy.


Transducer
Piezoelectric elements made of zinc oxide or polyvinylidene fluoride generate ultrasonic signals when driven by high-voltage excitation pulses. Ultrasonic scanning systems rely on focused acoustic transducers to concentrate energy at specific depth planes within multi-layer power assemblies. Selecting transducer center frequency, focal length, and lens aperture balances the physical trade-off between lateral spatial resolution and signal attenuation through packaging materials.
Attenuative losses scale exponentially with transducer center frequency and beam propagation depth. Silicon dies, direct bonded copper layers, and thick baseplates absorb sound energy. High frequencies yield tight focal spot diameters but suffer rapid signal decay.
Deep package inspection demands lower excitation frequencies to reach buried interfaces, reducing spatial detail capability.

Frequency Selection and Attenuation Trade-Offs
Operating parameters balancing penetration depth against lateral spot size dictate component selection for non-destructive testing. A 15 MHz transducer penetrates ten millimeters of copper baseplate and molded encapsulation, but produces a lateral beam diameter exceeding 300 micrometers. A 230 MHz ultra-high-frequency transducer achieves lateral spatial resolution below 15 micrometers, but acoustic attenuation limits effective penetration depth to less than one millimeter of silicon.
| Center Frequency (MHz) | Focal Length in Water (mm) | Theoretical Spot Size (μm) | Max Penetration Depth in Cu (mm) | Minimum Detectable Void Area (μm²) |
|---|---|---|---|---|
| 15 | 12.7 | 310 | 12.0 | 75,000 |
| 30 | 12.7 | 155 | 8.0 | 18,500 |
| 50 | 12.7 | 93 | 5.0 | 6,800 |
| 100 | 6.35 | 23 | 2.2 | 420 |
| 230 | 3.18 | 10 | 0.6 | 80 |
Attenuation caps usable frequency range. Molded power modules exhibit acoustic absorption exceeding 3 dB/mm at 50 MHz. Water path length adjustments maintain acoustic focus on target interfaces.
Signal amplification compensates for attenuation, but excessive receiver gain introduces amplifier noise floor artifacts, obscuring low-amplitude boundary reflections.
At 100 MHz central frequency with a 12 mm focal length transducer in 22 degree Celsius water, lateral spatial spot size reaches 23 micrometers.
Lens geometry determines beam waist dimensions inside the package layers. Spherical acoustic lenses converge parallel acoustic waves to a focal point characterized by depth of field and beam diameter. The F-number, calculated as focal length divided by lens element diameter (F = f / D), determines energy convergence speed.
Low F-number lenses focus tightly, optimizing lateral spatial resolution at the exact focal plane while narrowing axial depth of field.
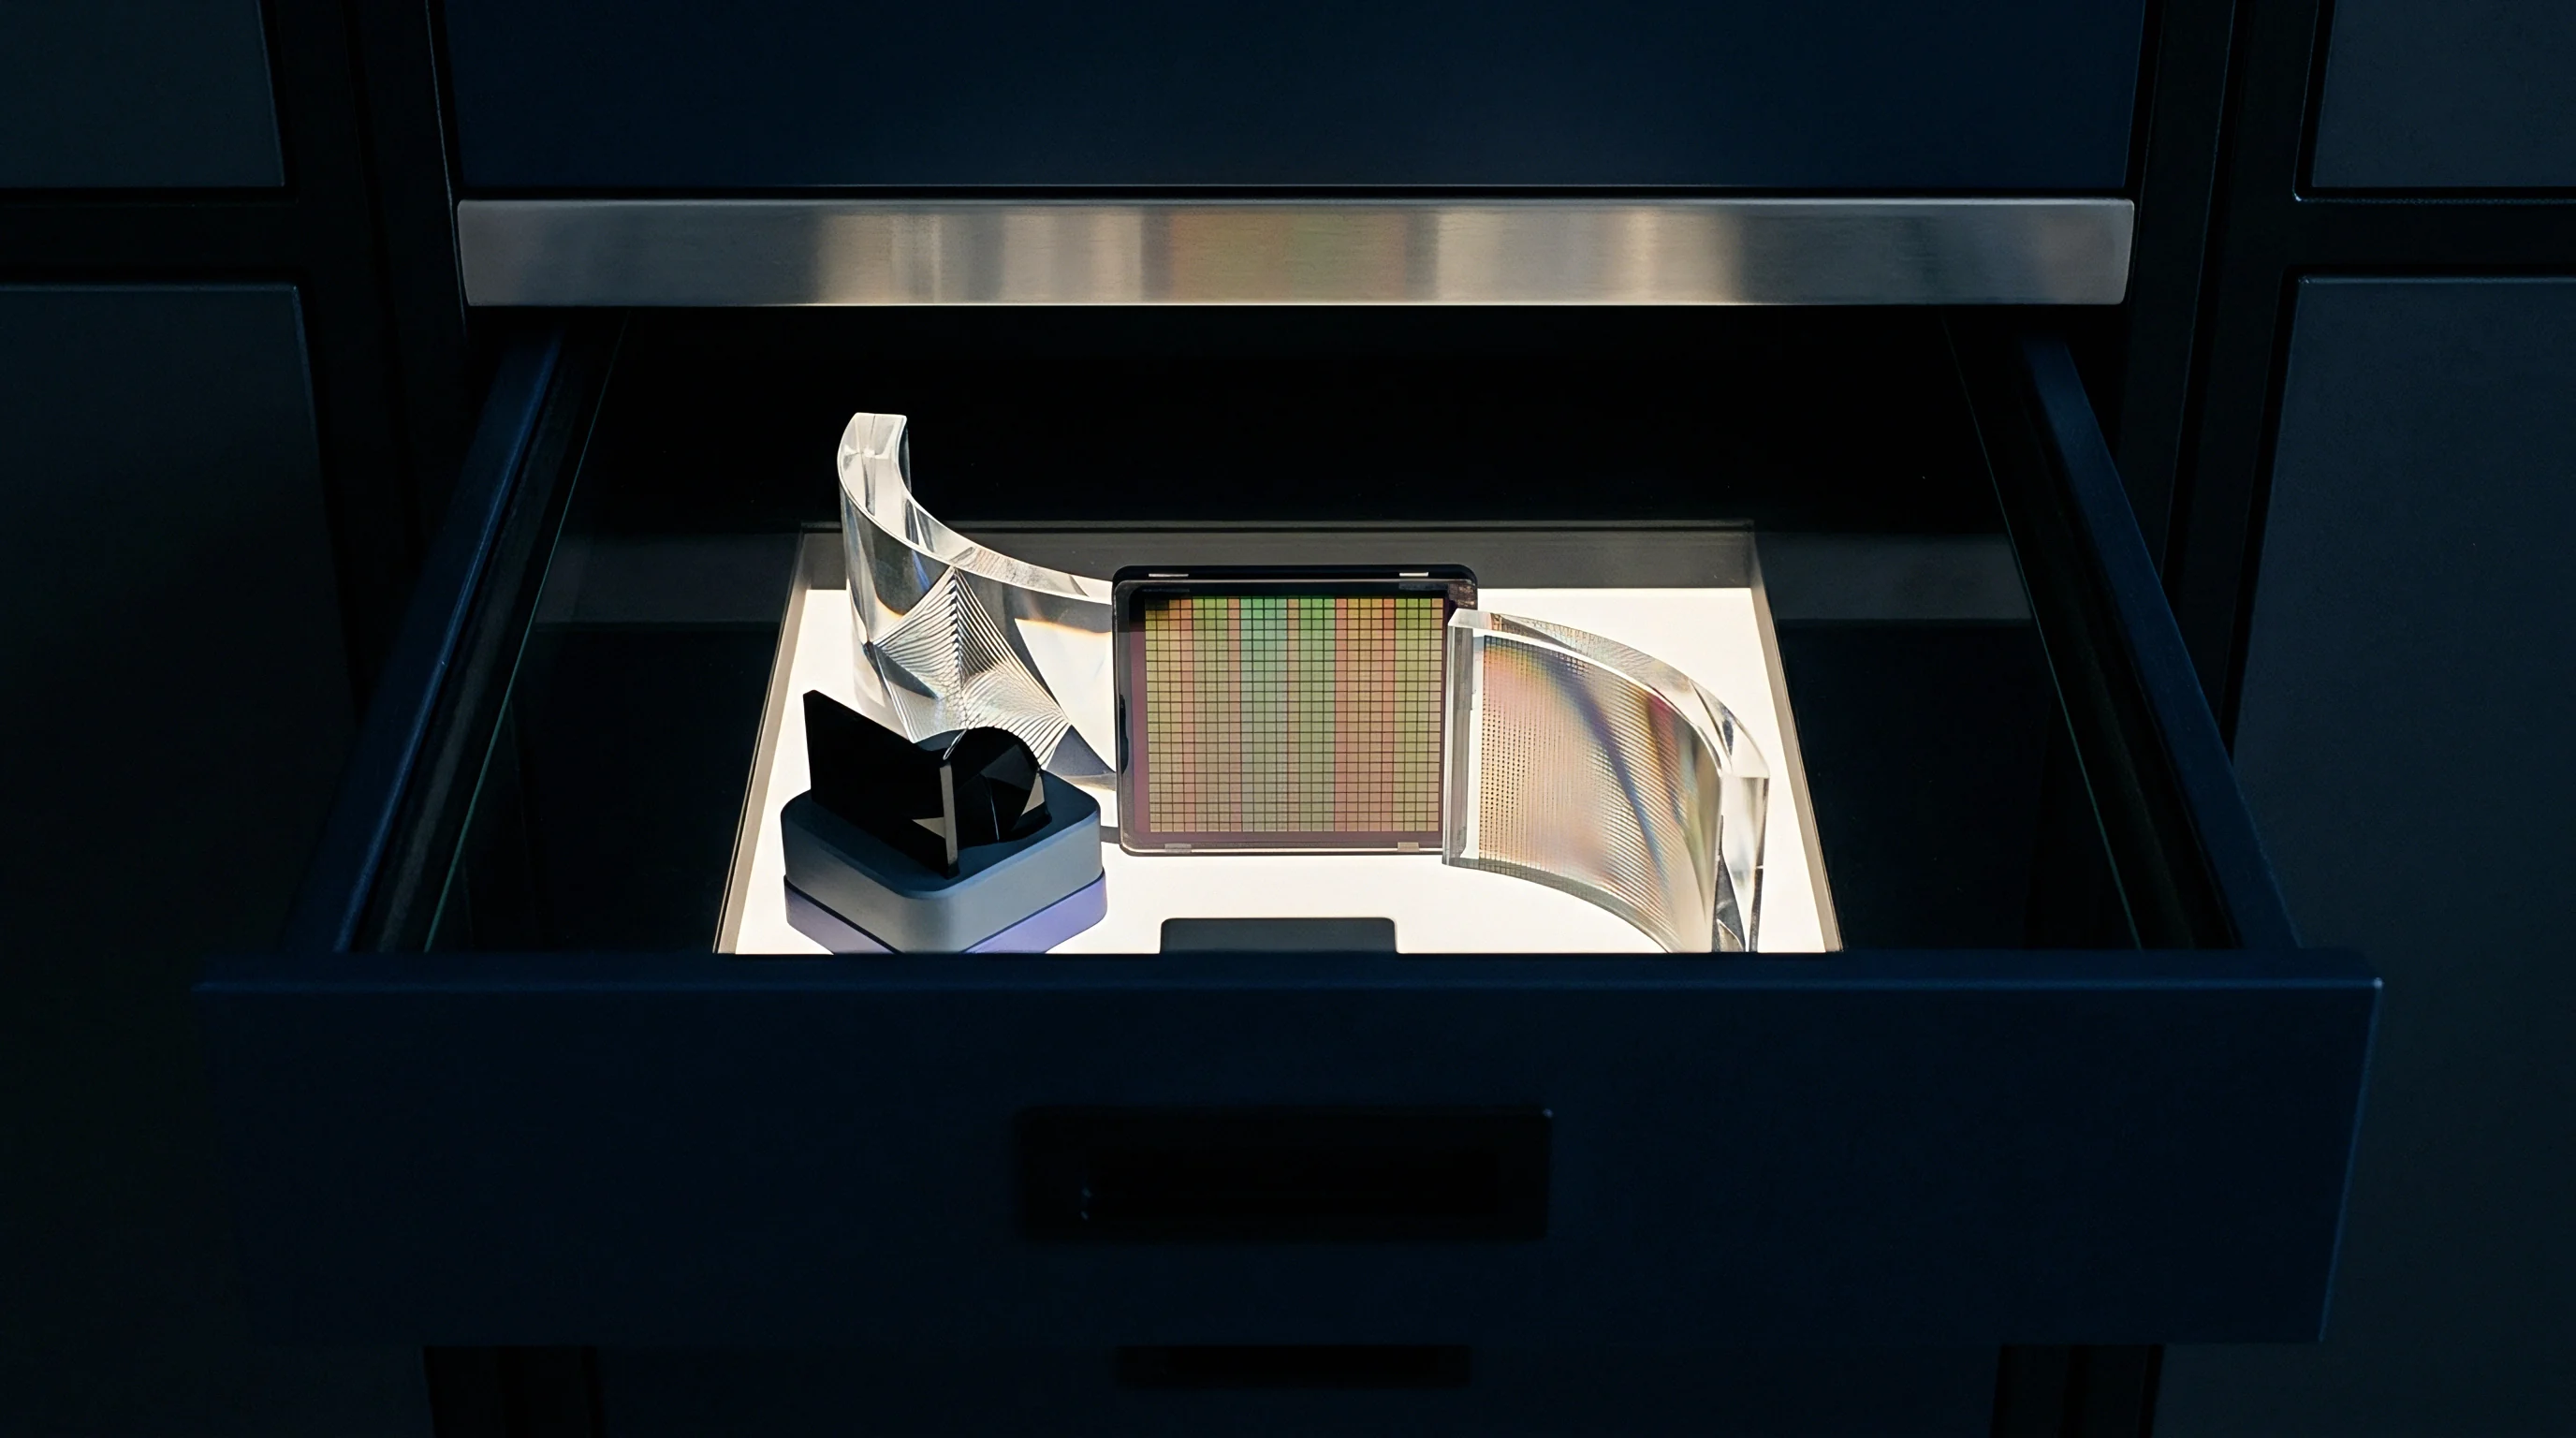
Focal Length and Numerical Aperture Configuration
High numerical aperture lenses maximize spatial resolution at chip attachment interfaces. Narrow focal zones require exact vertical stage alignment to prevent defocusing errors. Inspecting multi-level interfaces across stacked power die structures demands sequential vertical focal scans or multi-transducer array systems.
- Refraction Defocusing ~ Acoustic refraction at fluid-to-solid interfaces shifts the actual focal point deeper than predicted by water path geometric calculations.
- Spherical Aberration ~ High-curvature lens geometry causes peripheral acoustic rays to focus closer to the lens than axial rays, widening the spot size.
- Mode Conversion ~ Non-normal incident beam components convert longitudinal acoustic waves into transverse shear waves at material interfaces, generating parasitic signal artifacts.
- Attenuative Low-Pass Filtering ~ Bulk packaging media acts as a low-pass filter, shifting the acoustic wave spectrum toward lower frequencies and broadening the focal waist.
Thick copper degrades beam focus. Gel immersion attenuates high frequencies. Transducer manufacturers often state theoretical diffraction-limited spatial resolution based on room-temperature water velocity without accounting for high acoustic attenuation inside metal-matrix composites or solder alloys.

Detection
Converting ultrasonic RF returns into quantifiable spatial maps demands continuous analog sampling and high-speed digital processing. RF signal processing extracts acoustic amplitude, phase, and time-of-flight data from raw acoustic transients. Spatial mapping algorithms convert time-gated voltage waveforms into two-dimensional gray-scale image arrays representing microcrack networks.
Time-domain gating isolates specific material interfaces by selecting target time windows in the reflected RF signal trace. Reflections returning from upper and lower interfaces must be separated temporally. When packaging layers become extremely thin, reflected pulses overlap, requiring mathematical deconvolution algorithms to extract true interfacial amplitude and phase polarity.

Time-Domain Gating and Signal Conditioning
Isolating target interfaces within complex packaging stacks relies on precise temporal filtering. Interface gate windows align with reflected echo arrival times. Gate width must match acoustic pulse duration to prevent inclusion of adjacent layer returns.
Variable gain amplifiers apply time-gain compensation (TGC), amplifying deeper acoustic echoes to maintain signal uniformity across thick power electronic stacks.
Gate timing controls signal isolation. Analog-to-digital converters (ADC) digitizing RF signals require sampling rates exceeding four times the transducer center frequency. Inspecting at 100 MHz requires ADC sampling speeds of at least 500 Mega-samples per second to capture phase transitions accurately.
Phase preservation allows software algorithms to separate solid phase boundaries from air-filled microcracks.

What Interfacial Gap Thickness Triggers Phase Inversion?
Reflected waveform polarities flip when sound encounters air voids thicker than tens of nanometers. Standard solid-to-solid boundaries maintain incident wave phase when acoustic impedance increases across the joint. Microcracks present an acoustic impedance drop, turning positive voltage peaks into negative troughs in the RF trace.
Phase inversion confirms interface detachment.
Consider a 100 MHz transducer interrogating a 35 nanometer silver sinter crack gap. Incident acoustic pressure P_i striking the solid-to-air interface generates a reflected wave P_r. Acoustic impedance of silver sinter Z_s equals 33.2 MRayl, while air Z_a equals 0.0004 MRayl.
The acoustic reflection coefficient computes as follows:
R = (0.0004 – 33.2) / (0.0004 + 33.2) = -0.999976
Negative magnitude confirms complete phase reversal. Pulse overlapping occurs when sinter layer thickness drops below 20 micrometers, causing front-surface and back-surface echoes to merge. High-frequency digitizers resolve overlapped signals using minimum mean square error deconvolution.
Signal-to-noise ratio (SNR) decays as attenuation reduces peak voltage. Minimum acceptable RF signal-to-noise ratio for phase inversion detection sits at 12 dB.
Per IPC-A-610 qualification standards for high-reliability assemblies, any interfacial voiding exceeding fifteen percent of total chip area invalidates thermal performance warranties.
High gain introduces structural noise. Signal processing algorithms use phase-sensitive cross-correlation to trace crack boundaries automatically.
- Hardware Delay Line Calibration ~ Adjusting trigger offsets aligns temporal gate windows with physical packaging depth, compensating for thermal drift in coupling fluids.
- Bandpass Frequency Filtering ~ Digital FIR filters eliminate out-of-band electronic amplifier noise and high-frequency scattering from bulk material grains.
- Phase-Inversion Mapping ~ Binary classification logic tags pixels exhibiting 180-degree phase shifts as microcrack separations while ignoring amplitude-only drops.
- Analytic Signal Hilbert Transformation ~ Converting real RF traces into complex analytic signals provides envelope amplitude maps independent of phase cross-overs.
The remaining uncertainty centers on whether acoustic microscope digital signal processing can reliably distinguish between sub-micron delamination and unbonded mechanical contact under zero-load conditions.


Substrate
Direct bonded ceramic structures in high-power modules experience severe thermal-mechanical shear stresses during thermal cycling. Material property mismatches drive failure mechanisms across multi-layer substrate stacks. Wide bandgap semiconductors, such as silicon carbide and gallium nitride, operate at high power densities, accelerating thermal fatigue at ceramic and metal interfaces.
Thermal expansion mismatches generate cyclic shear stresses at copper-to-ceramic boundaries. Copper exhibits a coefficient of thermal expansion (CTE) of approximately 16.5 ppm/K, whereas aluminum nitride displays a CTE of 4.5 ppm/K. Repeated thermal excursions initiate microcracks at substrate corners, which propagate inward along interfacial planes.

Direct Bonded Copper Thermal Stress Delamination
Differential coefficients of thermal expansion between copper cladding and dielectric ceramic cores drive microcrack initiation. DBC substrates using alumina (Al2O3) or aluminum nitride (AlN) show shear strain accumulation at outer copper edges. Acoustic inspection reveals microcracking as localized amplitude increases accompanied by phase inversion.
Early-stage microcracking presents as discontinuous, fringe-pattern reflections prior to forming continuous delamination fronts.
| Substrate Stack Architecture | Top Layer / Bottom Layer Thickness (mm) | Optimal Transducer Frequency (MHz) | Lateral Spatial Limit (μm) | Dominant Failure Mode |
|---|---|---|---|---|
| DBC Al2O3 (Cu-Al2O3-Cu) | 0.30 / 0.38 / 0.30 | 50 – 100 | 35 | Copper-ceramic edge delamination |
| DBC AlN (Cu-AlN-Cu) | 0.30 / 0.63 / 0.30 | 50 – 100 | 30 | Ceramic substrate horizontal cracking |
| DBA Si3N4 (Al-Si3N4-Al) | 0.40 / 0.32 / 0.40 | 75 – 140 | 20 | Aluminum matrix shear yield |
| Ag Sintered SiC on DBC | 0.10 / 0.04 / 0.30 | 100 – 230 | 12 | Sinter layer porous shear tearing |
| Cu Sintered SiC on DBA | 0.10 / 0.03 / 0.40 | 100 – 230 | 10 | Interfacial micro-void coalescence |
DBC cracks spread along boundaries. Silicon nitride (Si3N4) direct bonded active substrates offer fracture toughness exceeding 6.5 MPa·m&sup0;·&supb5;, significantly reducing ceramic cracking compared to aluminum nitride. Higher mechanical strength allows thinner ceramic layers, improving thermal resistance while altering acoustic transit times across the stack.
Silver sinter degradation manifests as intergranular microcracking long before complete delamination triggers thermal runaway.
Microporosity in pressureless metal die attach layers creates tortuous crack propagation paths. Sintered silver joints possess ten to thirty percent initial volumetric porosity. Microcracks propagate by linking adjacent micro-voids under thermal mechanical fatigue.
Distinguishing distributed porosity from active microcracking requires ultra-high acoustic frequencies combined with high-density spatial sampling grids.

Silver Sintering Microcrack Topologies
Sintered joint failure analysis requires separating manufacturing voiding from service-induced microcracks. Initial manufacturing voids exhibit rounded acoustic scattering geometries with stable dimensions under stress. Fatigue microcracks exhibit planar topology, generating sharp reflection boundaries and phase reversal signals.
Sinter voids alter reflection phase.
- Mount the power module assembly securely on the acoustic microscope stage to eliminate lateral vibration.
- Level the package surface using three-point micrometer alignment stages to maintain constant acoustic focal distance across the scan area.
- Fill the acoustic coupling tank with de-gassed, de-ionized water maintained at a constant 22 degrees Celsius temperature.
- Select a 100 MHz focused transducer and adjust vertical stage height to place the acoustic focal waist at the die-attach interface plane.
- Set time-domain gate parameters to capture the die-attach reflection pulse while excluding top-silicon surface returns.
- Execute a raster scan using a ten-micrometer grid pitch to acquire spatial acoustic RF amplitude and phase datasets.
Solder fatigue initiates at corners. Delamination yields total signal inversion. Skipping acoustic verification during module thermal qualification allows microcracked substrate lots to enter vehicle assemblies, resulting in field failures when operating thermal cycles widen interfacial separations, triggering die overheating and catastrophic gate dielectric breakdown.

Resolution
Quantitative identification of sub-micron separation layers requires strict calibration of acoustic velocity and focus geometry. Spatial resolution defines the minimum lateral separation between two adjacent microcracks that can be identified as distinct features. Detection limits define the absolute smallest crack opening displacement that returns a measurable acoustic reflection signal above system noise floors.
Lateral spatial resolution d_l scales with acoustic wavelength λ and optical geometry according to d_l = 1.02 · λ · (f / D). High central frequency decreases wavelength, sharpening lateral resolution. Axial resolution d_a governs temporal depth isolation, scaling with acoustic pulse duration τ as d_a = (c · τ) / 2.
Broad bandwidth transducers produce short temporal pulses, resolving thin layer interfaces.

Screening Limits and Verification Throughput
Production line qualification balancing scan velocity against defect detectability governs quality control economics. Scanning a 100 mm x 100 mm power module using a 10-micrometer step size generates one hundred million discrete data points. High spatial density ensures detection of early-stage microcracks, but extends scan duration to tens of minutes per module.
Industrial screening applies variable sampling grids, using fast low-resolution scans for screening and dense high-frequency scans over high-stress chip edges.
| Inspection Parameter | Datasheet Claimed Value | Bench Verified Limit | Measurement Condition / Constraint |
|---|---|---|---|
| Max Lateral Spatial Resolution | 5 μm | 12 μm | 230 MHz transducer, Si die surface, 22°C water |
| Minimum Detectable Crack Opening | 10 nm | 35 nm | Phase inversion threshold, 12 dB SNR floor |
| Maximum Scanning Speed | 500 mm/s | 180 mm/s | Spatial jitter below 2 μm, linear motor drive |
| Axial Layer Isolation Thickness | 5 μm | 18 μm | Deconvolution active, 100 MHz broad-bandwidth RF |
Water temp alters focal distance. Focal depth dictates spot geometry. Machine vision integration automates defect detection by processing phase-inverted C-scan image matrices.
Thresholding software highlights microcrack boundaries, calculating total un-bonded area percentages against automated pass-fail criteria.

Acoustic Inspection Specification Parameters
Defining contract quality gates demands absolute clarity on wave propagation criteria. Purchase agreements for high-power inverter modules must state non-destructive test methods, including transducer frequency, sampling pitch, gate window duration, and acoustic coupling fluid temperature. Standardizing acceptance testing eliminates disputes over void size measurement discrepancies between module suppliers and system integrators.
Per MIL-STD-883 Method 2030 non-destructive inspection criteria, any interfacial microcrack or void network bridging more than 50 percent of the distance between die edge and active transistor cells constitutes mandatory lot rejection.