Recalibration Intervals Costed across a Five Year Service Fleet
Risk-adjusted calibration cycles combined with quarterly field verification reduce 5-year fleet costs by 23 percent while holding out-of-tolerance risk below 2.5 percent.

Fleet
Deployment Density and Baseline Interval Selection
Managing five hundred temperature and pressure sensors across a chemical processing plant requires balancing measurement uncertainty against ongoing service costs. Instrument engineers often default to a twelve-month recalibration interval during commissioning simply because it is standard industry practice. In practice, that twelve-month choice acts as a temporary placeholder rather than a tailored strategy.
Running five hundred nodes on an arbitrary annual schedule creates a continuous maintenance burden that drains labor and lab availability.
Baseline selection needs to reflect sensor density, process criticality, and loop redundancy. Installing dual or triple redundant sensors in safety-critical loops alters how much drift an individual device can afford. A single sensor in a core control loop demands tight uncertainty bounds, whereas voting architectures handle moderate drift without compromising safety.
Setting recalibration cycles purely by calendar time ignores physical operating reality. Sensors running continuously near full-scale limits face mechanical and thermal stresses that speed up performance loss compared to idle or light-duty units.
Measurement accuracy steadily drifts over time under continuous operating conditions.
Reviewing historical calibration records for identical sensor models shows clear differences in how drift develops. Instrument populations typically follow non-linear aging curves, with the sharpest parameter shifts occurring during the first six months in the field. Once this initial burn-in period stabilizes the sensing elements, drift rates generally settle into a predictable linear trend.
Applying a blanket twelve-month cycle across an entire inventory ignores this burn-in behavior, leading to unnecessary servicing of stable units while leaving rapidly drifting sensors at risk of slipping out of spec.

Operating Environment Stressors
Thermal stress gradually alters transducer performance and signal output over time.
Environmental conditions drive drift far more directly than elapsed time on a calendar. Temperature swings, high humidity, vibration, and chemical exposure wear down sensor housing seals and internal reference components. Pressure transmitters subjected to continuous thermal cycling develop diaphragm fatigue and oil-fill expansion that shift the zero point.
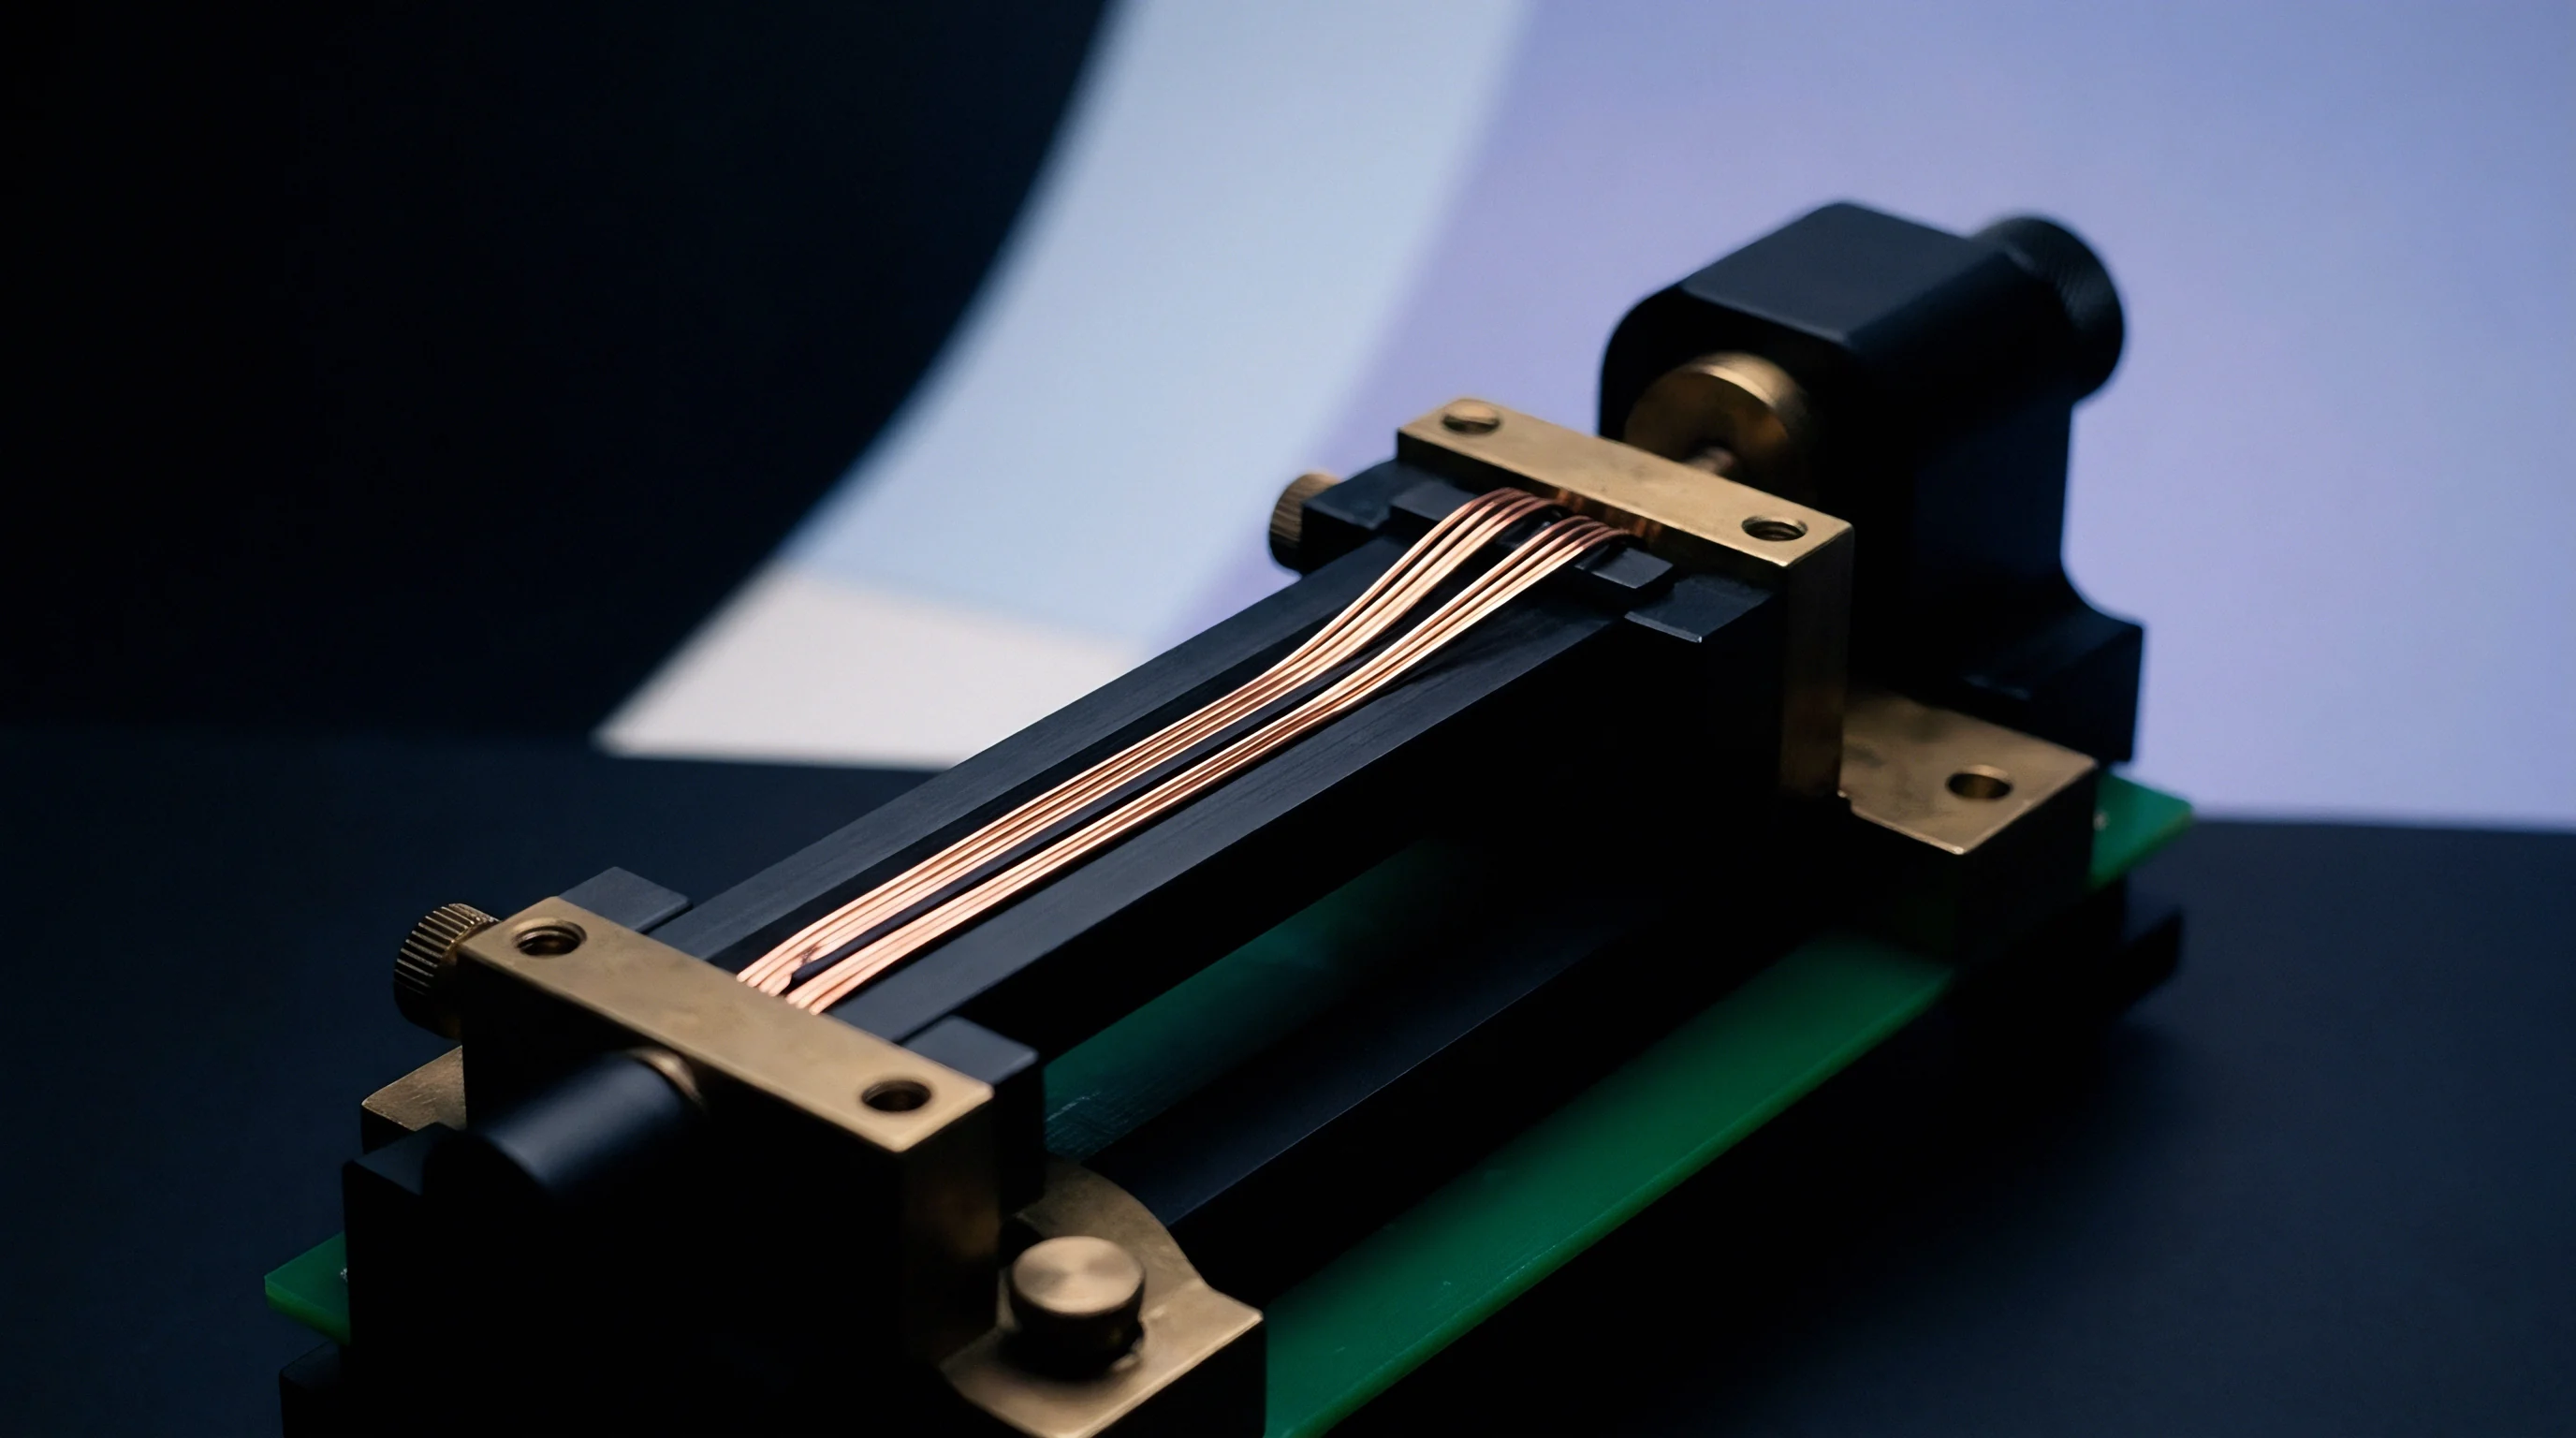
Piezoresistive strain gauges bonded to diaphragms with specialized adhesives also experience micro-creep under high heat, resulting in persistent offset drift.
Moisture ingress is another major driver of field degradation. Polymer capacitive humidity sensors absorb chemical contaminants along with water vapor, permanently shifting their dielectric baseline. Thermocouples running in oxidizing or reducing atmospheres suffer alloy contamination, altering thermoelectric voltage output and introducing permanent temperature errors.
In practice, sensors in climate-controlled indoor spaces retain calibration up to four times longer than identical units mounted on outdoor process equipment exposed to weather extremes.
A 100-sensor industrial pressure fleet operating at 60 degrees Celsius incurs 3.4 times higher recalibration transport costs when serviced at fixed 12-month intervals compared to a risk-adjusted 24-month cycle anchored by quarterly field checks.
Vibration from pumps, compressors, and fluid turbulence stresses electronic assemblies and surface-mount solder joints. Over time, constant vibration creates micro-cracks in ceramic pressure-sensor substrates, causing signal intermittent issues and zero drift. Mapping these location-specific stressors allows maintenance teams to group instruments into targeted calibration intervals instead of applying one rigid schedule across the facility.
Failure Modes across Five Years
Over a five-year lifecycle, sensor fleets show distinct failure patterns that should shape calibration strategy. Early failures show up in the first ninety days from manufacturing flaws or installation errors. Mid-life issues usually stem from environmental wear and process contamination, while late-life failures reflect mechanical wear, material fatigue, and component aging.
Field return data from processing plants points to several main physical degradation paths that push sensors out of tolerance:
- Zero offset shift caused by mechanical overpressure events, diaphragm deformation, or strain gauge adhesive relaxation over prolonged operating cycles.
- Span error accumulation resulting from reference voltage drift, amplifier gain changes, or permanent changes in sensing element elasticity.
- Non-linearity distortion arising from non-uniform sensor element degradation, thermal hysteresis, or mechanical hysteresis within mechanical linkages.
- Insulation resistance loss driven by moisture intrusion into terminal housings, compromised cable glands, or internal seal failure under pressure cycling.
- Signal response attenuation caused by process fouling, sensor head scaling, or protective thermowell thermochemical degradation.
Comparing three distinct interval strategies across a five-year deployment window highlights the financial and operational trade-offs. Shifting from a rigid twelve-month schedule to a dynamic interval based on environmental exposure and loop criticality cuts total calibration events by thirty-eight percent without raising out-of-tolerance risk.
| Recalibration Strategy | Calibration Interval | 5-Year Interventions | Annual Risk Exposure | 5-Year Direct Service Cost |
|---|---|---|---|---|
| Fixed Calendar Interval | 6 Months | 1000 | Low (1.2%) | $225,000 |
| Standard Industry Default | 12 Months | 500 | Moderate (4.8%) | $112,500 |
| Extended Calendar Interval | 24 Months | 250 | Elevated (12.4%) | $56,250 |
| Risk-Adjusted Hybrid Cycle | Dynamic (12-36 Mos) | 310 | Controlled (2.1%) | $78,800 |
| Direct service costs include laboratory calibration fees, transport packaging, courier transit, and technician labor per intervention. | ||||
Setting recalibration cycles without accounting for local operating conditions leads to unexpected drift failures, higher product scrap, and unbudgeted emergency lab costs.

Physics
Mechanisms of Sensor Drift over Time
Solid-state and electromechanical transducers undergo gradual shifts in zero offset and full-scale output as structural changes occur at the molecular level within sensing elements. In platinum resistance thermometers, exposure to high heat encourages grain boundary growth in the platinum wire, altering its electrical resistance properties. This structural shift moves the resistance-to-temperature response away from standard IEC 60751 reference tables, resulting in a persistent measurement bias that builds up over time.
Piezoresistive pressure sensors feature doped silicon resistors diffused into a silicon diaphragm. Repeated mechanical strain cycles cause micro-dislocations in the silicon lattice to shift and multiply. Over thousands of pressure cycles, these accumulated dislocations alter the material’s piezoresistive coefficient, causing zero offset drift and process instability.
Direct bench testing verifies true calibration state under controlled baseline conditions.
Capacitive pressure cells rely on thin ceramic or metal diaphragms held under tension. Over extended service periods, slight relaxation along the tensioned diaphragm edge seals changes the zero-pressure capacitance baseline. This mechanical relaxation follows a logarithmic curve, starting with faster initial movement before tapering into slow, long-term drift.
Understanding these physical mechanisms allows metrologists to build realistic calibration decay models.

Are Three-Point Field Check Protocols Sufficient to Detect Span Drift?
In-situ verifications use portable calibrators to test installed sensors directly in line without breaking process piping. Running a three-point check at zero, fifty, and one hundred percent of scale confirms basic operation and flags noticeable zero shifts. These field checks work well as an early detection step, though they do not replace full laboratory calibration.
Handheld pressure pumps and dry-block calibrators carry higher measurement uncertainty than stationary lab standards. Their uncertainty margins often approach one-third of the target sensor tolerance, which limits the test uncertainty ratio. While field checks reliably catch zero drift and major gain errors, they routinely miss subtle non-linearity issues or minor thermal hysteresis.
ISO/IEC 17025 Clause 7.8.4.3 prohibits laboratories from recommending recalibration intervals on test certificates unless explicit written authorization exists within the customer specification.
Allowing out-of-tolerance instruments to remain in service introduces hidden process risks and quality issues.
Adding intermediate field checks between lab calibrations makes it safer to extend service intervals. A sensor checked quarterly with a calibrated reference stays reliable in service while enabling lab cycles to stretch from twelve months to twenty-four or thirty-six. This combined approach minimizes thread and connector wear from repeated removals while maintaining solid measurement traceability.
Criteria for Extending Service Intervals
Extending calibration cycles requires documented historical drift data and statistical proof of stability. Quality management systems prohibit interval extensions without supporting empirical data, making objective statistical criteria necessary during reviews.
Evaluating an instrument fleet for extended cycles involves reviewing consecutive calibration certificates across multiple service turns. Maintenance teams check historical records against specific physical and statistical benchmarks before adjusting intervals:
- Historical drift stability demonstrated by three consecutive recalibration records showing parameter drift below fifty percent of maximum allowable error.
- Environmental containment verifying operating temperatures, ambient humidity, and mechanical vibration remain strictly within manufacturer reference limits.
- Process criticality assignment establishing that measurement errors do not directly impact human safety, environmental compliance, or major product quality parameters.
- In-situ verification coverage providing secondary intermediate checks between laboratory recalibrations to detect sudden instrument failure.
- Overpressure protection history confirming the instrument experienced zero hydraulic shock, water hammer, or severe thermal excursion events during the preceding operational period.
Routine bench verifications help protect overall product quality and yield consistency.
Stated accuracy limits apply strictly to benign bench environments rather than real-world plant conditions.


Arithmetic
Financial Architecture of Calibration Cycles
Calculating the true lifetime cost of an instrument fleet requires looking beyond vendor lab fees to account for freight, technician labor, spare parts inventory, and out-of-tolerance process exposure. Third-party bench calibration fees are usually just a fraction of the total expense. Pulling a sensor from a process line takes technician time, isolation safety permits, physical blinding, and work order administration.
Logistics overhead adds up quickly over multi-year operating windows. Shipping sensitive instruments to accredited facilities requires custom packaging, hazardous material clearance for process-wetted parts, and insured express freight. Transit vibration also carries a real risk of unsettling calibrated components on the return trip, occasionally compromising a calibration certificate before the unit even goes back into storage.
Stretching calibration intervals too far expands financial exposure from unnoticed measurement drift.
Keeping an active spare float ensures operations continue smoothly during calibration cycles, but purchasing that inventory ties up capital. A facility running five hundred sensors typically maintains a ten percent float, adding fifty spare units to capital assets. Storing, maintaining, and periodically checking those spares adds a steady baseline expense to operating budgets.
Worked Five Year Cost Model for Five Hundred Sensors
Evaluating total outlay requires a realistic model comparing traditional twelve-month bench calibration against an optimized risk-adjusted strategy over a five-year service life. The model follows a fleet of five hundred pressure transmitters installed in a continuous processing facility.
Baseline cost estimates based on typical industry rates include:
- External laboratory fee set at $180 per unit for ISO/IEC 17025 accredited bench calibration.
- Technician removal and reinstallation labor calculated at $120 per unit based on two technician hours at $60 per hour.
- Freight and protective packaging budgeted at $45 per unit round trip.
- Spare pool capital holding cost calculated on 50 spare units purchased at $1,200 each, amortized at 8% annual cost of capital over five years.
- In-situ field verification check labor set at $30 per unit based on 0.5 technician hours using portable calibrators.
Modeling three servicing strategies across five years shows the clear cost trade-offs between strict calendar schedules and hybrid verification programs.
| Cost Component | Strategy A: Fixed 12-Month Bench | Strategy B: Fixed 24-Month Bench | Strategy C: Hybrid 24-Month Bench + Quarterly Field |
|---|---|---|---|
| Bench Calibration Fees (5 Yrs) | $450,000 | $225,000 | $225,000 |
| Field Labor (Removal/Reinstall) | $300,000 | $150,000 | $150,000 |
| Freight & Logistics Overhead | $112,500 | $56,250 | $56,250 |
| In-Situ Verification Labor | $0 | $0 | $240,000 |
| Spare Inventory Amortization | $24,000 | $24,000 | $12,000 |
| Total Five-Year Fleet Cost | $886,500 | $455,250 | $683,250 |
Strategy A follows the traditional default schedule, reaching $886,500 over five years. Strategy B cuts total spending to $455,250 but increases out-of-tolerance process liability. Strategy C offers a balanced middle ground, costing $683,250 while controlling operational risk through intermediate field checks.
Doubling the calibration interval without inline verification shifts the financial risk from controlled laboratory expenditure to unquantified field liability.
In-Situ Verification versus Bench Calibration Trade-Offs
Working through the trade-offs between field checks and full lab recalibrations requires a clear, step-by-step financial evaluation.
- Quantify baseline instrument drift rates using historical calibration certificate records across a minimum of two operating years.
- Calculate maximum allowable process measurement uncertainty boundaries for each sensor loop within the facility.
- Determine direct costs per bench calibration, including external lab fees, shipping, technician labor, and production downtime risk.
- Estimate portable reference standard procurement and annual recalibration costs required for internal field verification checks.
- Calculate field verification labor time per unit, accounting for accessibility, safety permits, and testing setup.
- Model total 5-year operational costs across varying calibration interval lengths combined with intermediate field checks.
- Select optimal calibration interval length that minimizes financial outlay while maintaining test uncertainty ratios above 4:1.
Using in-situ checks reduces physical handling, protecting process threads, seals, and wiring connections from unnecessary wear during transit.
ISO 10012 Clause 7.1.2 obligates facilities to adjust measurement confirmation intervals whenever audit records show instrument drift exceeding acceptable operational boundaries.
Laboratories
Accreditation Scopes and Measurement Uncertainty
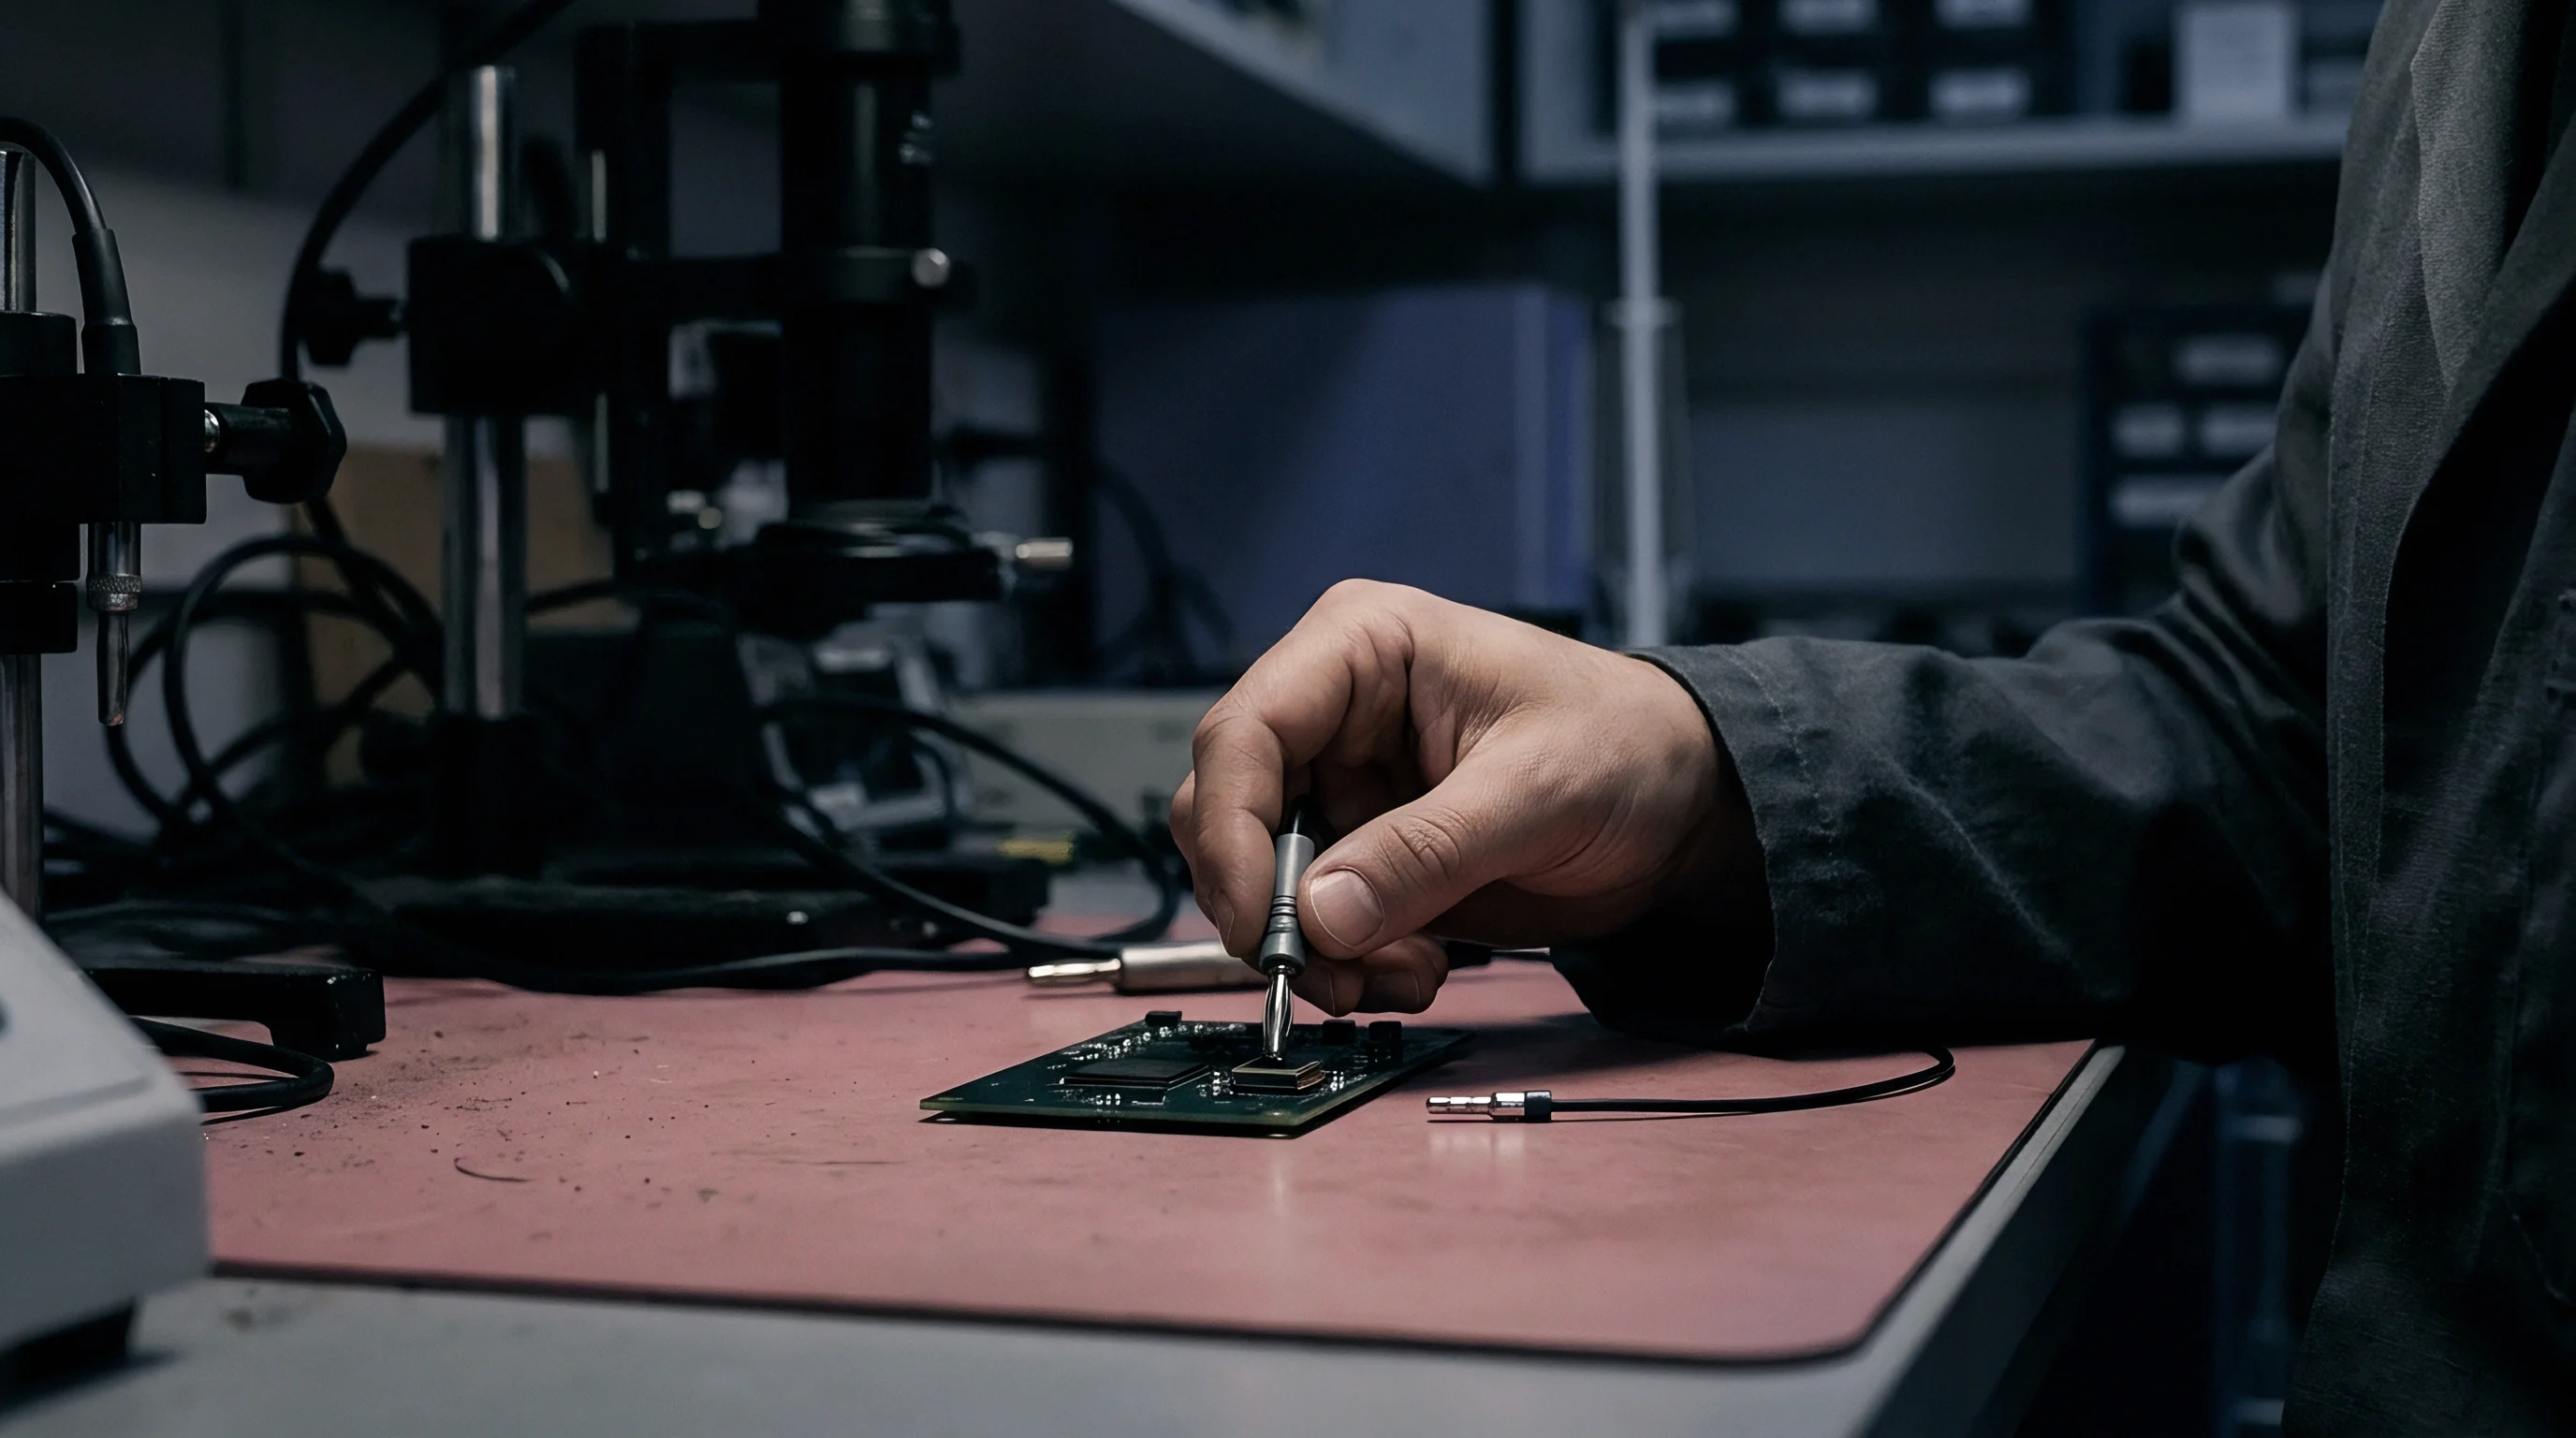
External calibration labs operate under distinct technical capabilities outlined in their formal accreditation schedules. Quality managers need to review a laboratory’s Calibration and Measurement Capability before placing service contracts. An ISO/IEC 17025 certificate alone does not ensure a lab holds the required accuracy for specialized sensors.
Scope schedules explicitly detail parameter ranges, test methods, reference standards, and expanded measurement uncertainties.
Uncalibrated or improperly referenced devices generate misleading baseline data.
Checking the Test Uncertainty Ratio ensures that calibration measurements remain valid. A minimum TUR of 4:1 ensures the laboratory reference standard’s uncertainty is at least four times smaller than the tolerance of the sensor under test. Choosing a lab with an inadequate scope uncertainty drops the TUR below 4:1, introducing false-accept risks where out-of-tolerance units pass inspection.
Uncertainty budgets published on accreditation schedules account for reference standard drift, ambient temperature swings, power stability, and test repeatability. Comparing these budgets across vendors highlights real performance gaps. Commercial labs offering low unit pricing often rely on higher-uncertainty reference equipment, yielding broader target uncertainties that may fail to meet tight process specifications.
Logistics and Turnaround Overhead
Handling and transit impacts can degrade reference accuracy before an instrument returns to service.
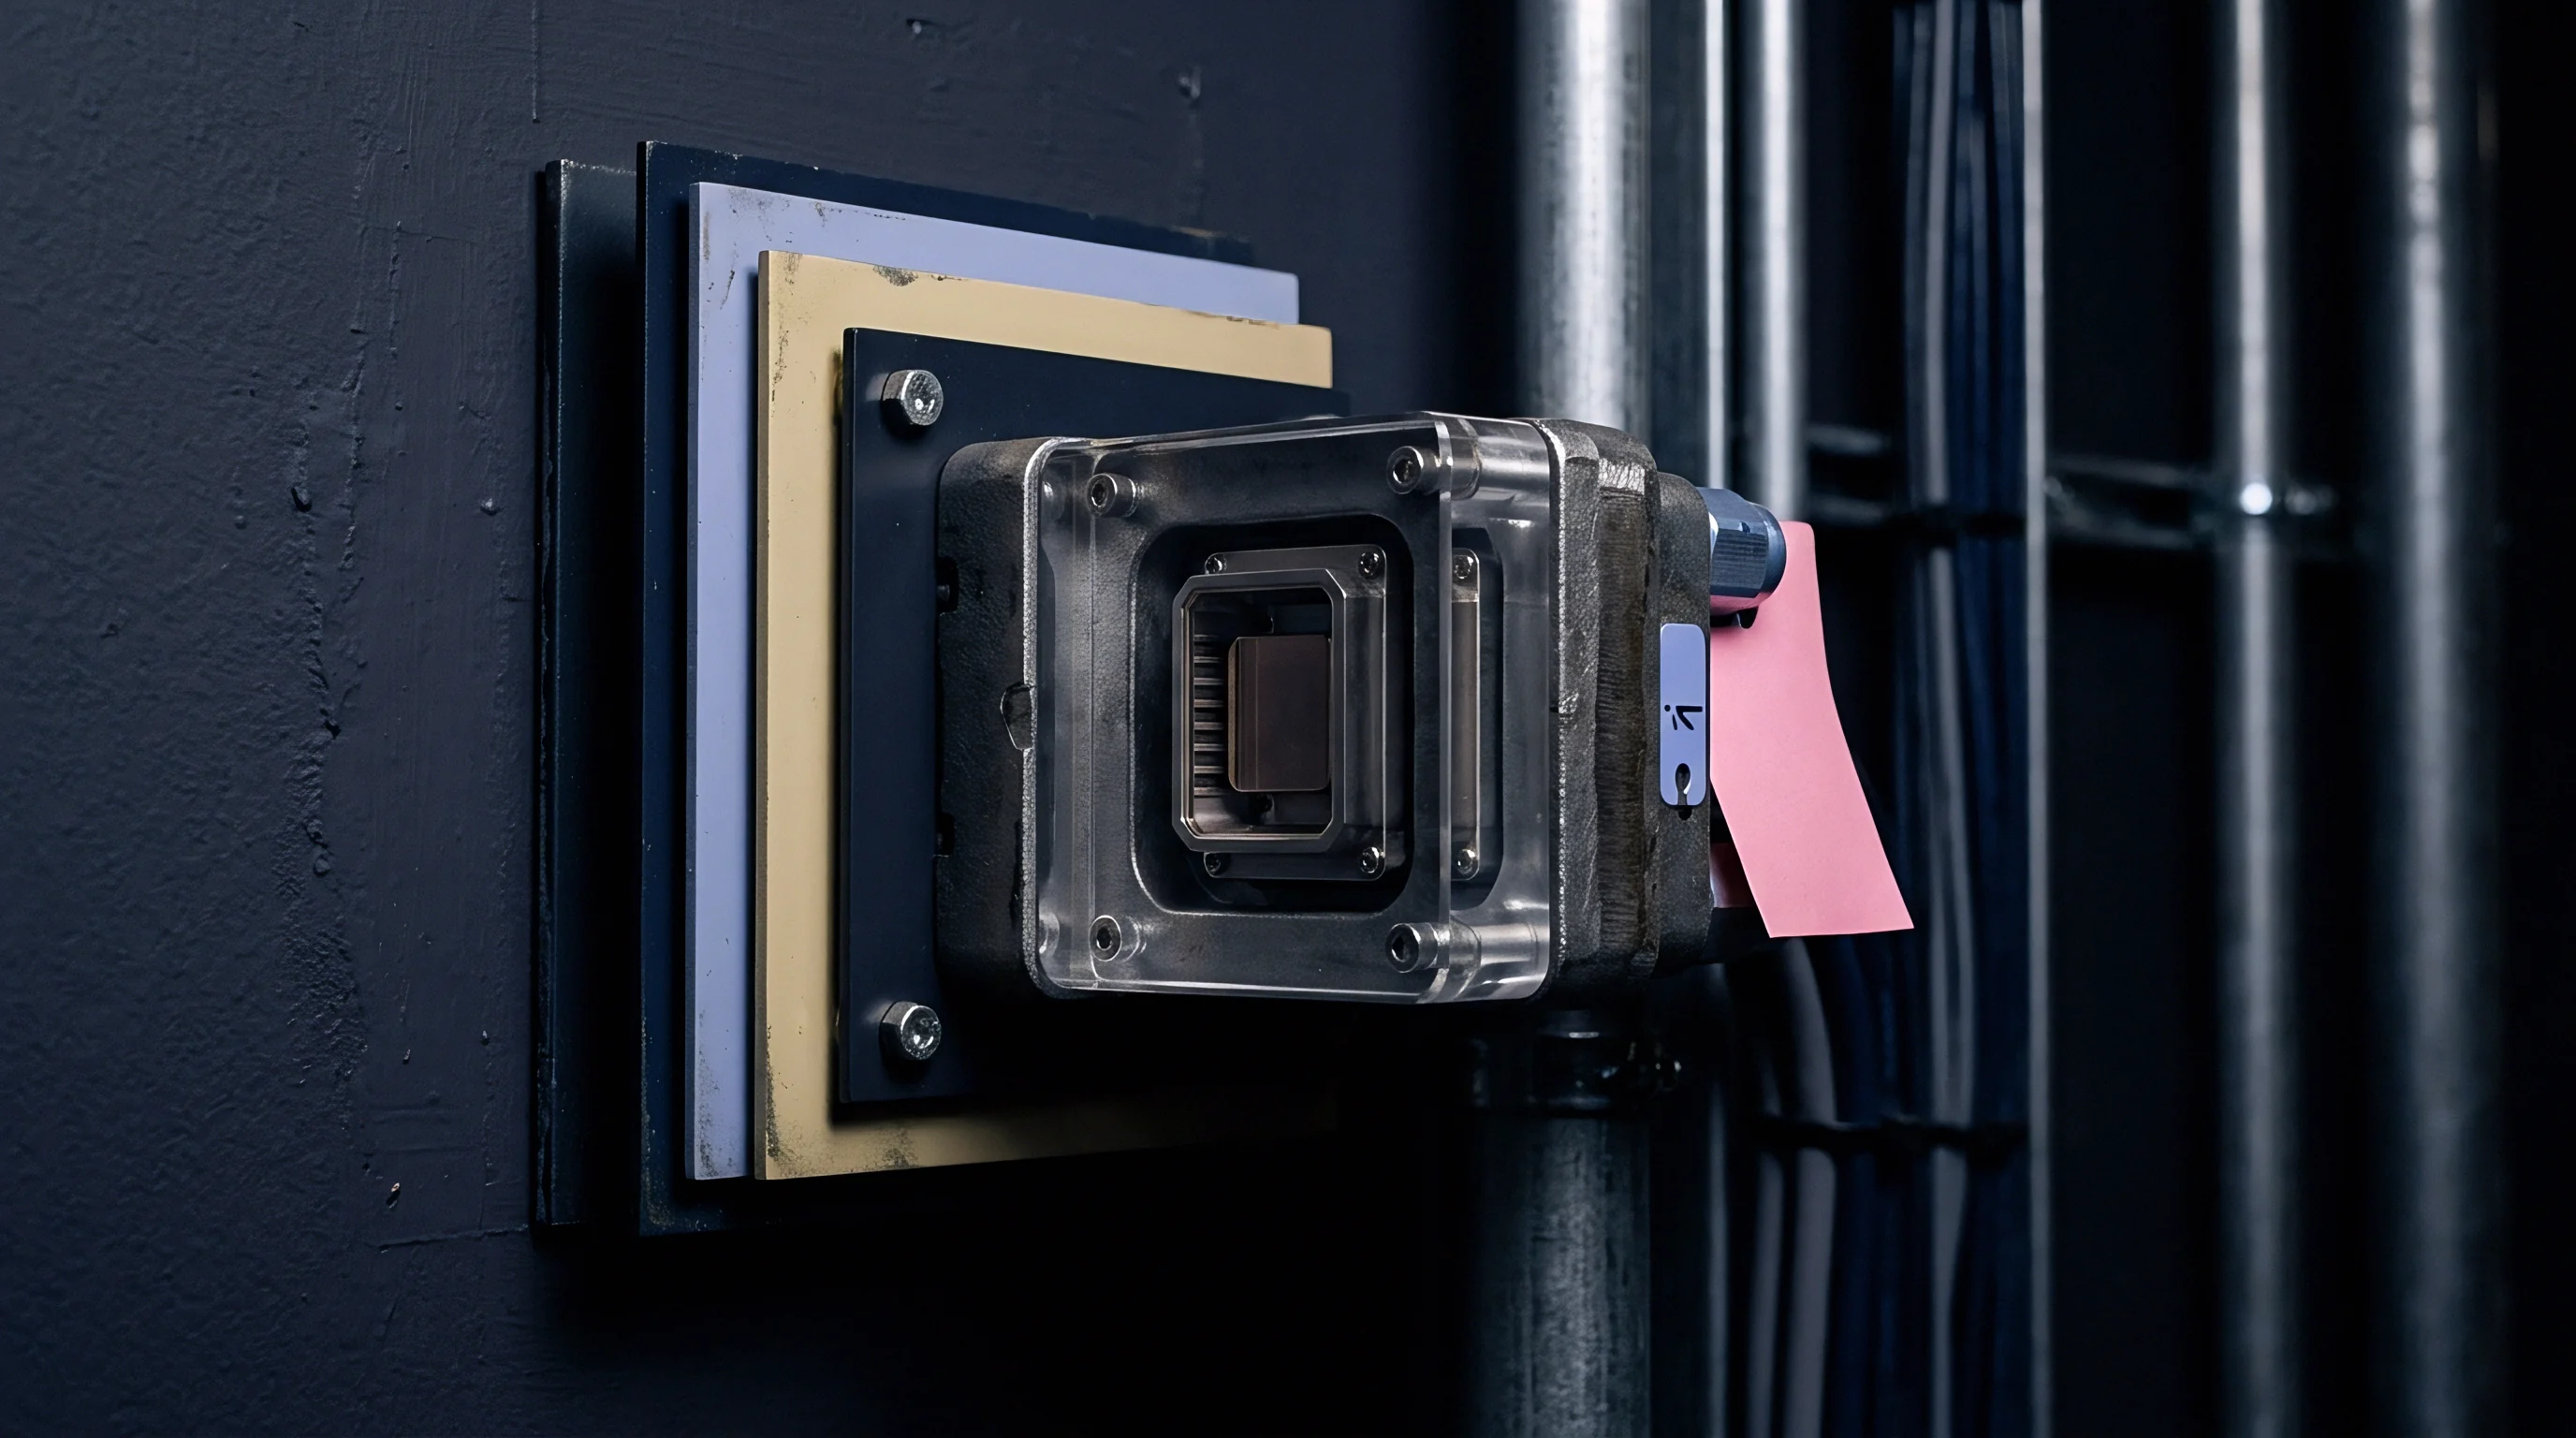
Turnaround time directly dictates spare inventory needs. Sending sensors to distant calibration centers extends transport time, stretching total out-of-service periods from three days to four weeks. Longer turnaround times force plants to hold larger spare floats to keep process lines running continuously.
Shipping delicate instruments introduces risk. Courier transit exposes hardware to impacts, temperature extremes, and moisture. Vibration during shipment can alter internal adjustments, causing zero drift before the sensor arrives back on site.
Custom shock-foam transit cases reduce damage risks, though they increase packaging bulk and shipping costs.
| Sensor Class | Target Measurement Accuracy | Laboratory CMC Uncertainty | Average Turnaround Time | Transit Risk Level |
|---|---|---|---|---|
| Industrial Pressure Transmitters | ±0.075% Span | ±0.015% Span | 5 Business Days | Low |
| Sanitary Temperature Probes (RTD) | ±0.15°C at 100°C | ±0.03°C at 100°C | 7 Business Days | Moderate |
| Coriolis Mass Flow Meters | ±0.10% Rate | ±0.025% Rate | 14 Business Days | High |
| Relative Humidity Sensors | ±1.5% RH | ±0.5% RH | 10 Business Days | Moderate |
Working with regional calibration labs shortens transit times and lowers damage risks. On-site mobile calibration vans offer another alternative by bringing standards straight to the plant. Mobile servicing eliminates transport damage and cuts turnaround to hours, though mobile vans carry higher ambient measurement uncertainty due to variable environmental controls inside service vehicles.

Audit Requirements and Chain of Custody
Valid calibration relies on unbroken metrological traceability back to national standards.
Maintaining traceability to national metrology institutes requires strict documentation and chain-of-custody tracking. Quality auditors check calibration certificates for clear traceability statements, reference standard serial numbers, environmental conditions, and expanded uncertainty claims with coverage factors.
Audit criteria require checking key quality metrics before approving external calibration vendors:
- Scope alignment verifying the calibration laboratory’s official accreditation scope covers the exact measurement range and target uncertainty of facility instruments.
- Traceability documentation confirming reference standards trace through an unbroken chain of accredited calibrations to national standards institutions.
- Out-of-tolerance reporting ensuring immediate notification procedures exist when returned instruments exhibit out-of-tolerance conditions upon arrival at the laboratory.
- Environmental logs validating laboratory ambient temperature and humidity control records during test execution windows.
- Decision rule specifications documenting whether calibration pass or fail judgments account for measurement uncertainty according to ILAC-G8 guidelines.
Evaluations of external calibration providers show that commercial laboratories frequently omit decision rule statements unless purchasers explicitly require ILAC-G8 compliance within procurement documentation.
Whether external third-party calibration laboratories can maintain target measurement uncertainties under rising global transport delays and fluctuating ambient transit temperatures remains an open operational concern for fleet operators.


Contract
Commercial Terms and Calibration Warranties
Equipment purchase agreements for high-accuracy sensors frequently overlook long-term calibration support fees, leading to unexpected operational costs down the line. Procurement teams often focus on initial unit prices while overlooking post-warranty service expenses. Negotiating fixed-rate calibration pricing during initial hardware contracts locks in long-term service costs and protects against future rate hikes.
Suppliers commonly bundle initial factory calibration certificates into hardware sales, but these certificates vary widely in detail. Standard factory sheets often confirm basic functionality without providing itemized measurement data or uncertainty claims. Requiring ISO/IEC 17025 accredited certificates with full test data during purchase adds a small upfront cost while establishing a solid baseline for future drift tracking.
Contracts need clear vendor responsibilities for when an instrument fails calibration upon arrival at an external lab. An out-of-tolerance result on incoming testing means process readings during the previous operating cycle may have been off. Agreements should require labs to issue an immediate notification and detailed out-of-tolerance report within twenty-four hours to support internal quality impact reviews.

Service Level Agreements for External Calibration
Service Level Agreements define performance expectations for external calibration labs. Setting clear metrics holds suppliers accountable for turnaround times, certificate accuracy, and safe instrument handling. SLA terms should define maximum turnaround times alongside explicit financial penalties for delays that disrupt plant maintenance schedules.
Contractual recalibration terms established during initial procurement determine total ownership expense more heavily than the original sensor unit purchase price.
Modeling long-term fleet costs under contractual fixed-rate service agreements shows total calibration expenditures drop by twenty-two percent compared to purchasing calibration services on an ad hoc purchase order basis.
Structuring vendor contracts with fixed pricing schedules, explicit turnaround guarantees, and standardized calibration data formats streamlines maintenance operations and stabilizes operational costs over a five-year service life.
Fixing recalibration pricing at the initial hardware purchase stage yields far lower lifetime expenses than negotiating routine service rates on an ad hoc basis.