Evaluating Transduction Mismatches across Secondary Silicon Wafer Foundries
Secondary fab transduction mismatches require dynamic AFE trimming and strict wafer acceptance stress limits to prevent offset drift and gain saturation.

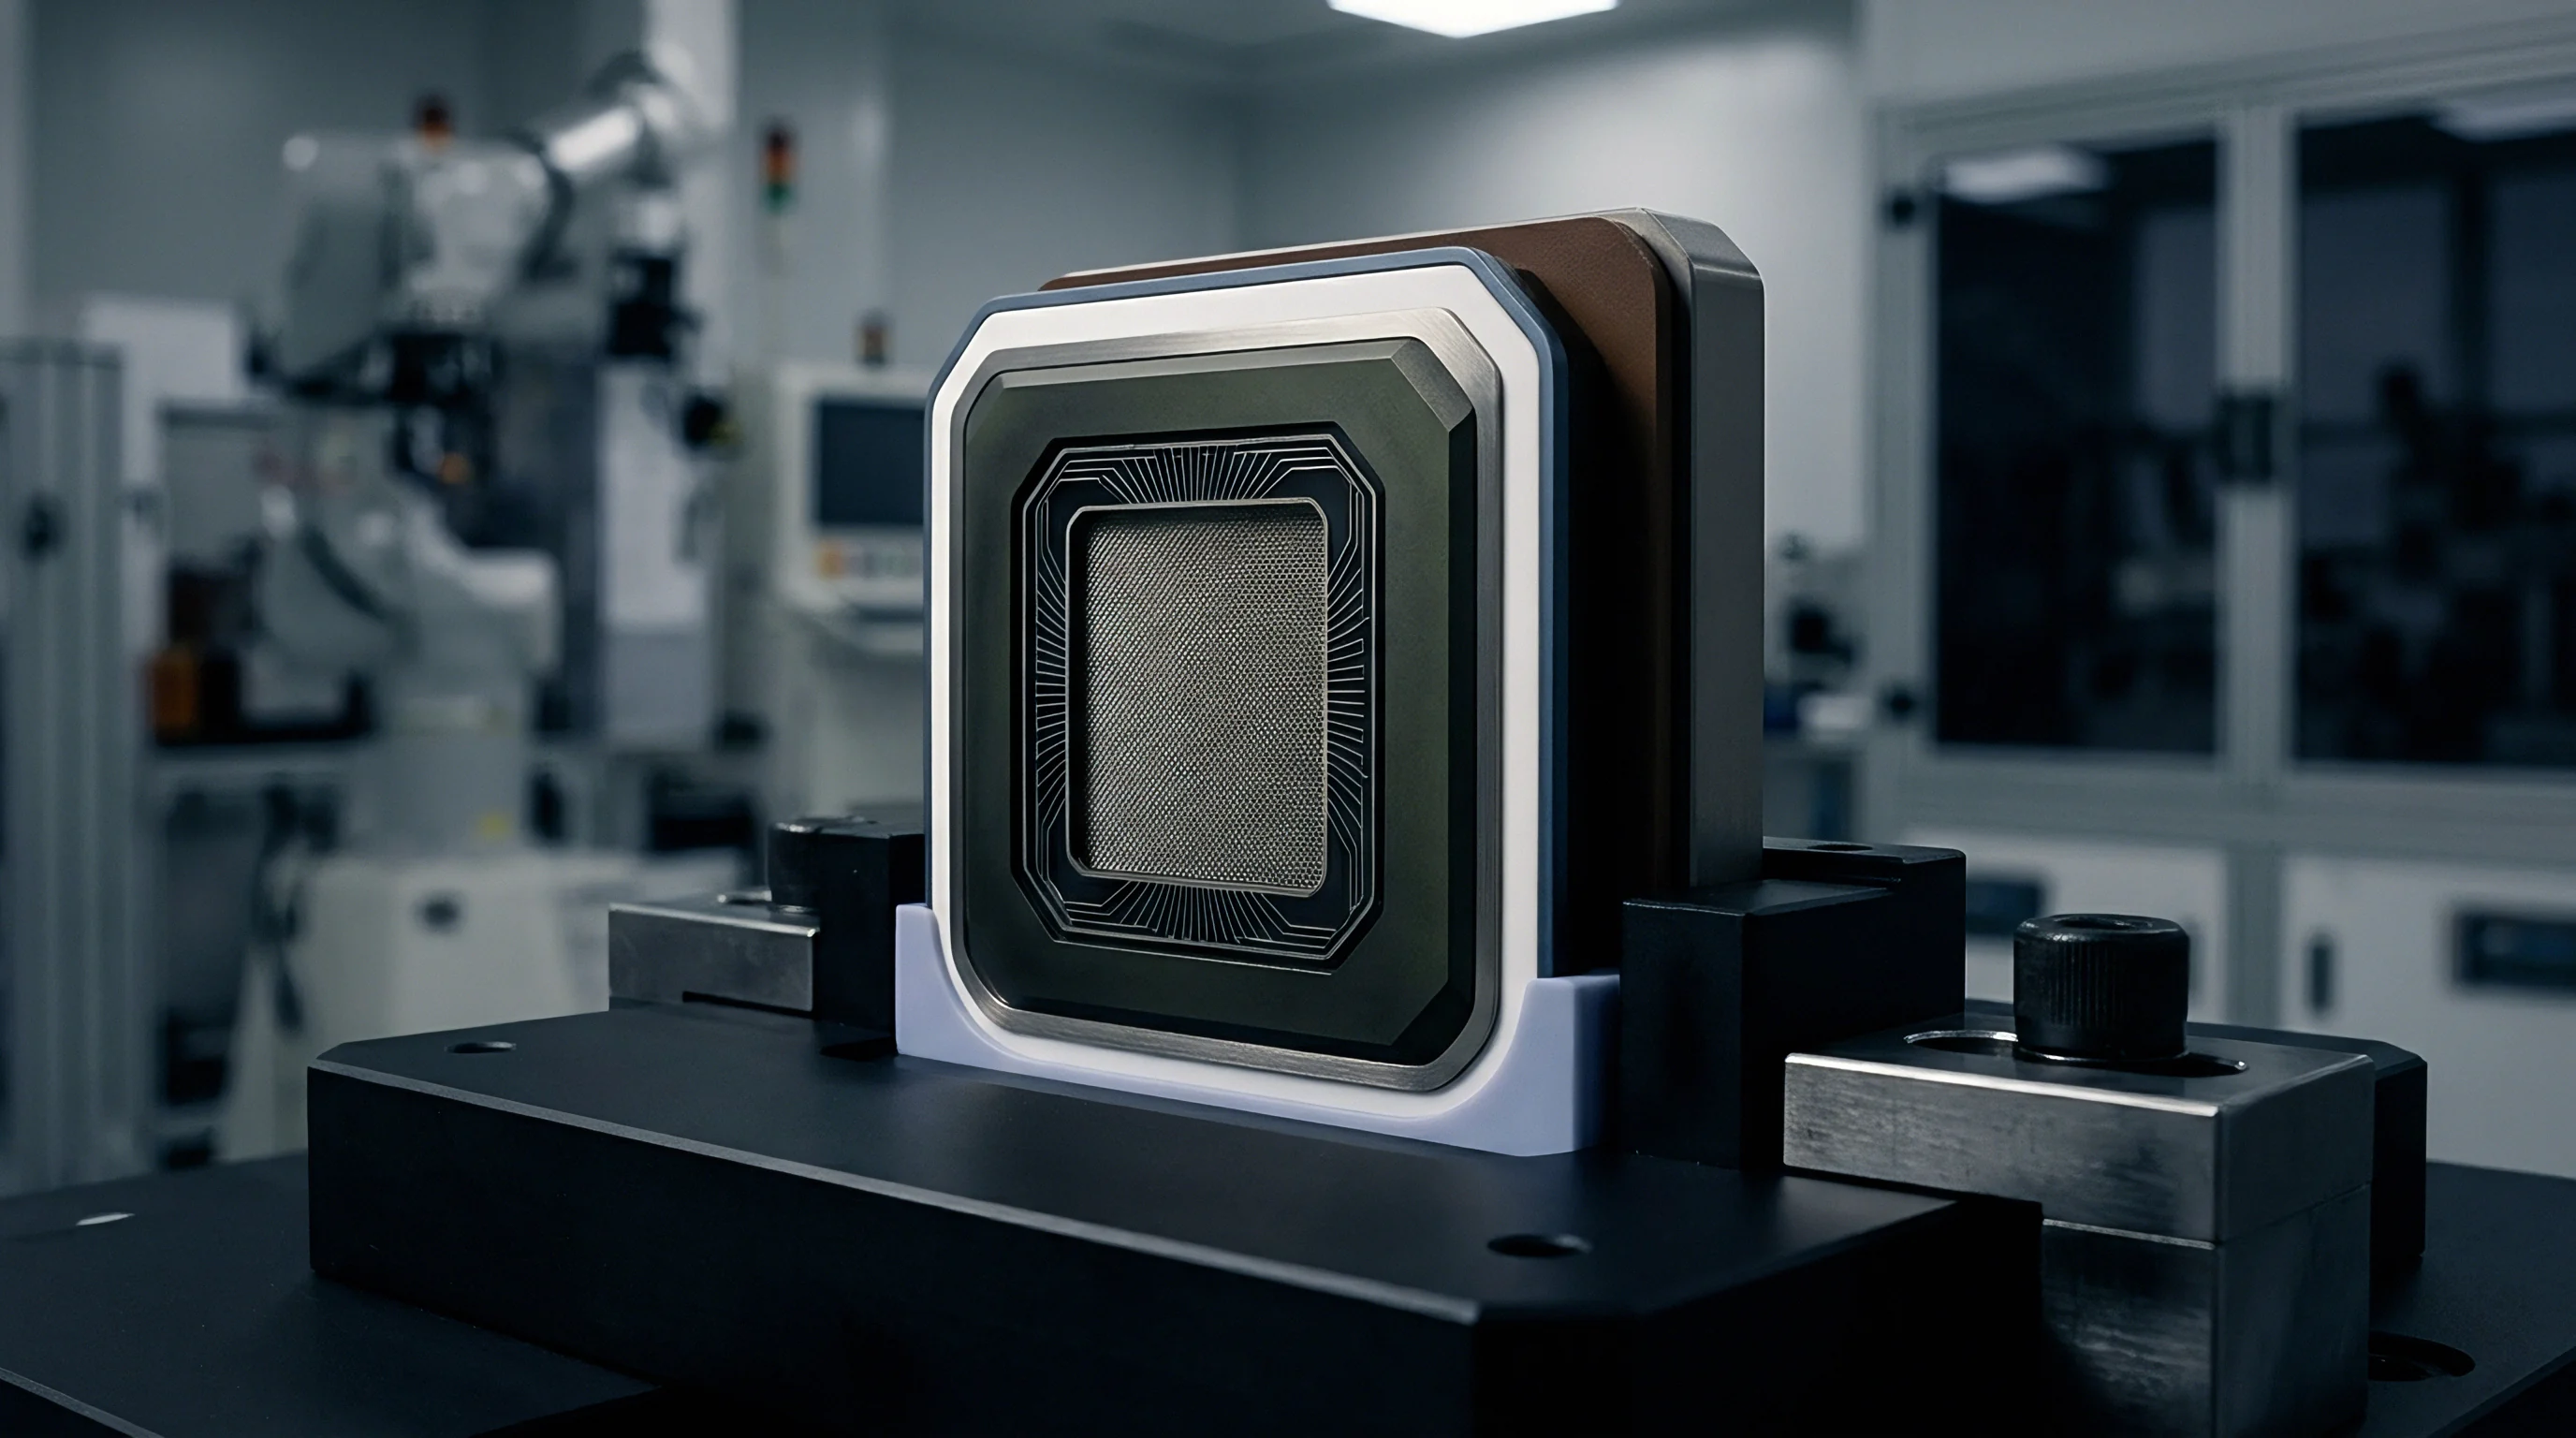
Wafer
Secondary semiconductor manufacturing lines often exhibit distinct thermal budgets and film deposition mechanics compared to high-volume primary foundries. Silicon substrates processed in secondary fabrication plants frequently utilize alternative thermal oxidation temperatures, plasma-enhanced chemical vapor deposition deposition rates, and annealing durations. These process variations alter the intrinsic stress state of silicon dioxide and silicon nitride dielectric layers grown on top of the active silicon surface.
Residual stress in dielectric films exerts mechanical strain directly on the underlying single-crystal silicon lattice. Mechanical strain changes the physical properties of sensing elements through the piezoresistive and capacitive coupling mechanisms embedded in the substrate. High-volume primary foundries maintain dielectric film stress tolerances within narrow boundaries, whereas secondary foundries operate wider process windows that introduce measurable transduction shifts across wafer lots.
Die strain alters offset.
Dielectric film stress manifests as a primary driver of baseline output mismatch when transitioning sensor designs between fabrication facilities. Tensile stress in surface passivation layers forces the underlying silicon substrate into compressive stress, modifying the localized energy band structure of the material. In piezoresistive pressure transducers, this localized stress alters the baseline resistivity of diffused or implanted resistance bridges, producing zero-point offset errors prior to the application of mechanical force.
In capacitive transducers, differential film stress induces localized curvature across suspended micro-structures, modifying the nominal plate gap and shifting the zero-measurand baseline capacitance.
A residual film stress variance of 15 megapascals alters thin-membrane zero-point offset by 4.2 millivolts per volt at 25 degrees Celsius.
Thermal history variations across secondary foundries further compound transduction divergence by altering interstitial oxygen precipitation in the silicon bulk. Bulk micro-defects act as localized stress concentration sites, causing non-uniform strain fields across the sensing diaphragm or proof mass. High-temperature process steps in secondary fabs that lack precise ramp-rate controls induce slip lines along crystallographic planes.
These structural defects reduce the mechanical quality factor of resonant transducers and increase low-frequency mechanical noise.
| Parameter | Primary Foundry Tolerance | Secondary Foundry Tolerance | Transduction Impact |
|---|---|---|---|
| Silicon Dioxide Residual Stress | ± 10 MPa | ± 35 MPa | Zero-point offset drift and membrane curvature |
| Passivation Nitride Stress | ± 15 MPa | ± 50 MPa | Sensitivity scale factor shift |
| Interstitial Oxygen Content | 14 to 16 PPM | 11 to 19 PPM | Mechanical quality factor degradation |
| Substrate Thickness Uniformity | ± 1.5 μm | ± 5.0 μm | Diaphragm compliance variability |
Film stress creates curvature.
Failure to account for film stress divergence in secondary fabs yields untrimmable offset shifts that destroy sensor yield at final test.


Microgeometry
Etch rate directional profiles and deep reactive ion processing parameters determine the mechanical dimensions of micro-electromechanical sensing elements. Secondary foundries often run older reactive ion etching equipment or alternative fluorine-based plasma chemistry profiles. Variations in plasma density and chamber pressure alter the vertical etch rate and sidewall passivation efficiency, leading to differences in feature geometry compared to primary foundry reference designs.
Aspect Ratio Dependent Etching Variations
Aspect ratio dependent etching effects occur when etch gas species penetrate narrow trenches slower than wide open areas on the wafer mask. DRIE processes in secondary fabs frequently exhibit modified etch stop timing and aspect ratio lag characteristics. Narrow capacitive gaps etched alongside broad isolation channels experience localized depth variations, altering structural stiffness and parasitic capacitive coupling across the sensor die.
Undercut alters spring rates.

Diaphragm and Suspension Feature Mismatches
Etch undercut beneath structural oxide masks reduces the effective cross-sectional area of mechanical suspension beams in accelerometers and gyroscopes. A beam width reduction of 0.2 micrometers alters mechanical stiffness as a cubic function of width, shifting resonant frequency and acceleration sensitivity beyond target electrical trim windows.
- Resonant Frequency Instability Shifts beam spring constants through dimensional undercut variations, altering natural frequencies and operational bandwidth.
- Capacitance Baseline Dispersion Modifies nominal comb finger spacing via sidewall taper angle changes, expanding baseline capacitance distributions.
- Cross-Axis Strain Sensitivity Introduces asymmetric structural cross-sections from non-uniform trench profiles, elevating off-axis acceleration response.
- Diaphragm Stiffness Asymmetry Varies etch depth profile across pressure sensor membranes, altering mechanical deflection per unit pressure.
Secondary fab engineering groups routinely attribute dimensional spread to incoming SOI substrate variations beyond their process control limits.

Piezoresistive
P-type boron ion implantation energy and thermal annealing cycles control the sensitivity of piezoresistive strain gauges embedded within silicon diaphragms. Secondary wafer foundries frequently utilize different ion implanters and rapid thermal processing equipment compared to primary facilities. These equipment differences produce altered dopant concentration profiles, altering both sheet resistance and the piezoresistive gauge factor of the embedded resistor structures.

Dopant Activation and Gauge Factor Mechanics
The longitudinal piezoresistive coefficient depends directly on surface dopant concentration and junction depth. Higher peak doping concentrations lower the piezoresistive gauge factor while reducing the temperature coefficient of resistance. Conversely, lower doping concentration increases gauge factor sensitivity at the expense of higher thermal drift.
Variations in secondary foundry drive-in furnace thermal cycles modify the final dopant profile, unbalancing piezoresistive Wheatstone bridges.
Dopant gradient shifts TCS.
Worked Offset Calculation across Foundry Transfer
Evaluating a transfer scenario illustrates the mathematical impact of dopant variance on signal chain requirements. Take a 200 mm silicon wafer line producing piezoresistive pressure sensors with a nominal bridge resistance of 5,000 ohms and a target piezoresistive gauge factor of 120. Assume the primary foundry maintains boron implant peak concentration at 1 times 10 to the 19th power per cubic centimeter with a 3 percent sheet resistance variation across the wafer.
The secondary foundry operates the same nominal mask set but exhibits a 12 percent sheet resistance variation due to alternative anneal dynamics.
For a fully active Wheatstone bridge subjected to an applied stress yielding 10 millivolts per volt nominal output, the bridge differential output voltage equals supply voltage times strain times gauge factor divided by four. A 12 percent sheet resistance imbalance across opposing bridge arms introduces a zero-pressure offset voltage given by supply voltage times sheet resistance mismatch fraction divided by four. At a 5-volt supply, the primary foundry produces a baseline offset spread of 3.75 millivolts, whereas the secondary foundry yields an offset spread of 15.0 millivolts.
The secondary fab offset consumes 30 percent of a standard 50-millivolt full-scale analog front-end dynamic range prior to pressure application.
| Dopant Parameter | Primary Process Target | Secondary Process Target | Transduction Effect |
|---|---|---|---|
| Implant Peak Concentration | 1.0 × 1019 cm-3 | 1.4 × 1019 cm-3 | 15% reduction in longitudinal gauge factor |
| Junction Depth | 0.8 μm | 1.1 μm | Increased thermal hysteresis under thermal shock |
| Sheet Resistance Uniformity | ± 3% | ± 12% | 4x expansion in zero-pressure offset dispersion |
| Temperature Coefficient of Resistance | 1,200 PPM/°C | 1,800 PPM/°C | Elevated span drift demanding higher-order DSP fit |
Adherence to AEC-Q103-002 parameter drift thresholds bounds thermal hysteresis below 0.15 percent of full-scale output across consecutive temperature cycles.
Thermal drift consumes gain.
Incorporating Section 4.2 of ISO 26262 into foundry supply contracts enforces parametric drift bounds that force secondary fabs to maintain tight dopant activation limits.


Conditioning
Integrated analog front-end circuits process raw transducer signals by amplifying bridge voltages, suppressing common-mode noise, and digitizing outputs. When raw sensor die parameters shift due to secondary foundry processing, the signal conditioning block must absorb the elevated parameter spread without degrading overall measurement bandwidth or signal-to-noise ratio. Excessive baseline offsets consume programmable gain amplifier headroom, forcing the conditioning ASIC to operate at lower gain settings that elevate the quantization noise floor.
How Does Front-End Dynamic Range Absorb Wafer Mismatches?
Amplifier dynamic range limitations define the maximum tolerable transducer mismatch before performance degradation occurs. If a secondary foundry die exhibits elevated zero-point offset, the analog front-end input stage experiences differential DC bias. High operational amplifier gain converts this differential offset into output saturation.
Reducing front-end gain restores operational margin, but forces the analog-to-digital converter to digitize a smaller voltage span, reducing the effective number of bits of the measurement system.
Dynamic range suffers first.
Analog trimming reaches limits.
Low-frequency noise spectral density increases when secondary foundry dielectric passivation layers contain elevated interface state traps. Flicker noise in secondary silicon die shifts the 1/f corner frequency higher into the signal passband, corrupting slow-moving DC measurements in tilt and pressure monitoring systems.
- Bridge Balance Verification Assesses raw zero-input differential voltage to confirm offset sits within programmable DAC trim capability.
- Programmable Gain Amplifier Headroom Evaluates maximum input voltage swing across full temperature range to prevent rail saturation.
- Noise Floor Spectral Analysis Measures low-frequency power spectral density to identify elevated 1/f noise corner frequencies.
- Digital Polynomial Order Selection Determines whether 2nd order or 3rd order temperature compensation algorithms are required for span correction.
The long-term impact of elevated substrate noise on high-resolution sigma-delta converters operating over decade-long deployments remains unresolved.
Screening
Testing transducers on the wafer-level scale isolates substrate variations before assembly into packaged components. Wafer probe stations equipped with thermal chucks apply precise environmental profiles to evaluate parametric distributions across the wafer surface. Process control monitor test structures located in wafer saw streets provide early diagnostic data regarding sheet resistance, oxide thickness, and breakdown voltages prior to probing active sensor elements.
- Apply a regulated thermal baseline across the probe station chuck at 25 degrees Celsius.
- Measure initial bridge offset resistance and parasitic leakage paths to substrate ground.
- Elevate chuck temperature to 125 degrees Celsius and record thermal shift parameters.
- Execute laser or EEPROM trim sequence to zero baseline offset errors.
- Perform high-stress mechanical pulse testing to verify diaphragm structural stability.
Thermal soak isolates strain.
Thermal soak during wafer screening isolates lattice strain from contact resistance drift before permanent package encapsulation.
Wafer maps expose defects.
Pre-conditioning wafers at elevated thermal states separates structural strain artifacts from junction leakage prior to final trimming decisions.
Sourcing
Procurement practices across secondary fabrication plants require rigorous process control agreements to maintain transducer baseline consistency. Wafer Acceptance Test documentation defines the bound between acceptable process variation and scrap conditions. Establishing tight commercial specifications on parametric monitor structures prevents secondary fabs from shipping wafer lots that meet standard CMOS rules but fail specialized electromechanical transduction requirements.

Contractual Parameter Boundaries
Commercial qualification protocols for secondary foundries require explicit parameter windows for electromechanical properties. Conventional wafer contracts enforce electrical parameters such as transistor threshold voltages and sheet resistances. Sensor procurement terms must extend these terms to cover physical parameters including film stress, etching taper angles, and temperature coefficients of sensitivity.
- Parametric Process Control Data Captures wafer-level statistical distributions for film stress, oxide thickness, and sheet resistance.
- Crystallographic Orientation Audit Reports Confirms silicon substrate cut angles remain within tight off-axis alignment tolerances.
- Etch Depth Profile Diagnostics Tracks deep reactive ion etching sidewall taper and trench bottom flatness parameters.
- Film Stress Interferometry Logs Verifies residual mechanical stress in passivation layers before wafer backside thinning operations.
Yield drops abruptly.
| WAT Parameter | Standard CMOS Limit | Sensor Transduction Requirement | Commercial Exposure |
|---|---|---|---|
| Dielectric Film Stress | ± 100 MPa | ± 20 MPa | Inability to trim baseline zero-point offset |
| Boron Implant Tolerance | ± 10% | ± 2.5% | ASIC dynamic range saturation and scale factor error |
| DRIE Etch Depth Variation | ± 8% | ± 1.5% | Resonant frequency drift and sensitivity spread |
| Substrate Resistivity | ± 20% | ± 5% | Parasitic substrate capacitance and noise elevation |
Precision costs real capital.
Contractual wafer acceptance parameter bounds establish clear financial liability for out-of-spec transduction behavior prior to packaging.