Evaluating Long-Term Packaging Stress Relaxation Mechanics on Piezoresistive Sensor Recalibration Intervals
Packaging stress relaxation drives non-linear zero drift in piezoresistive sensors, requiring early recalibration before shifting to extended intervals.
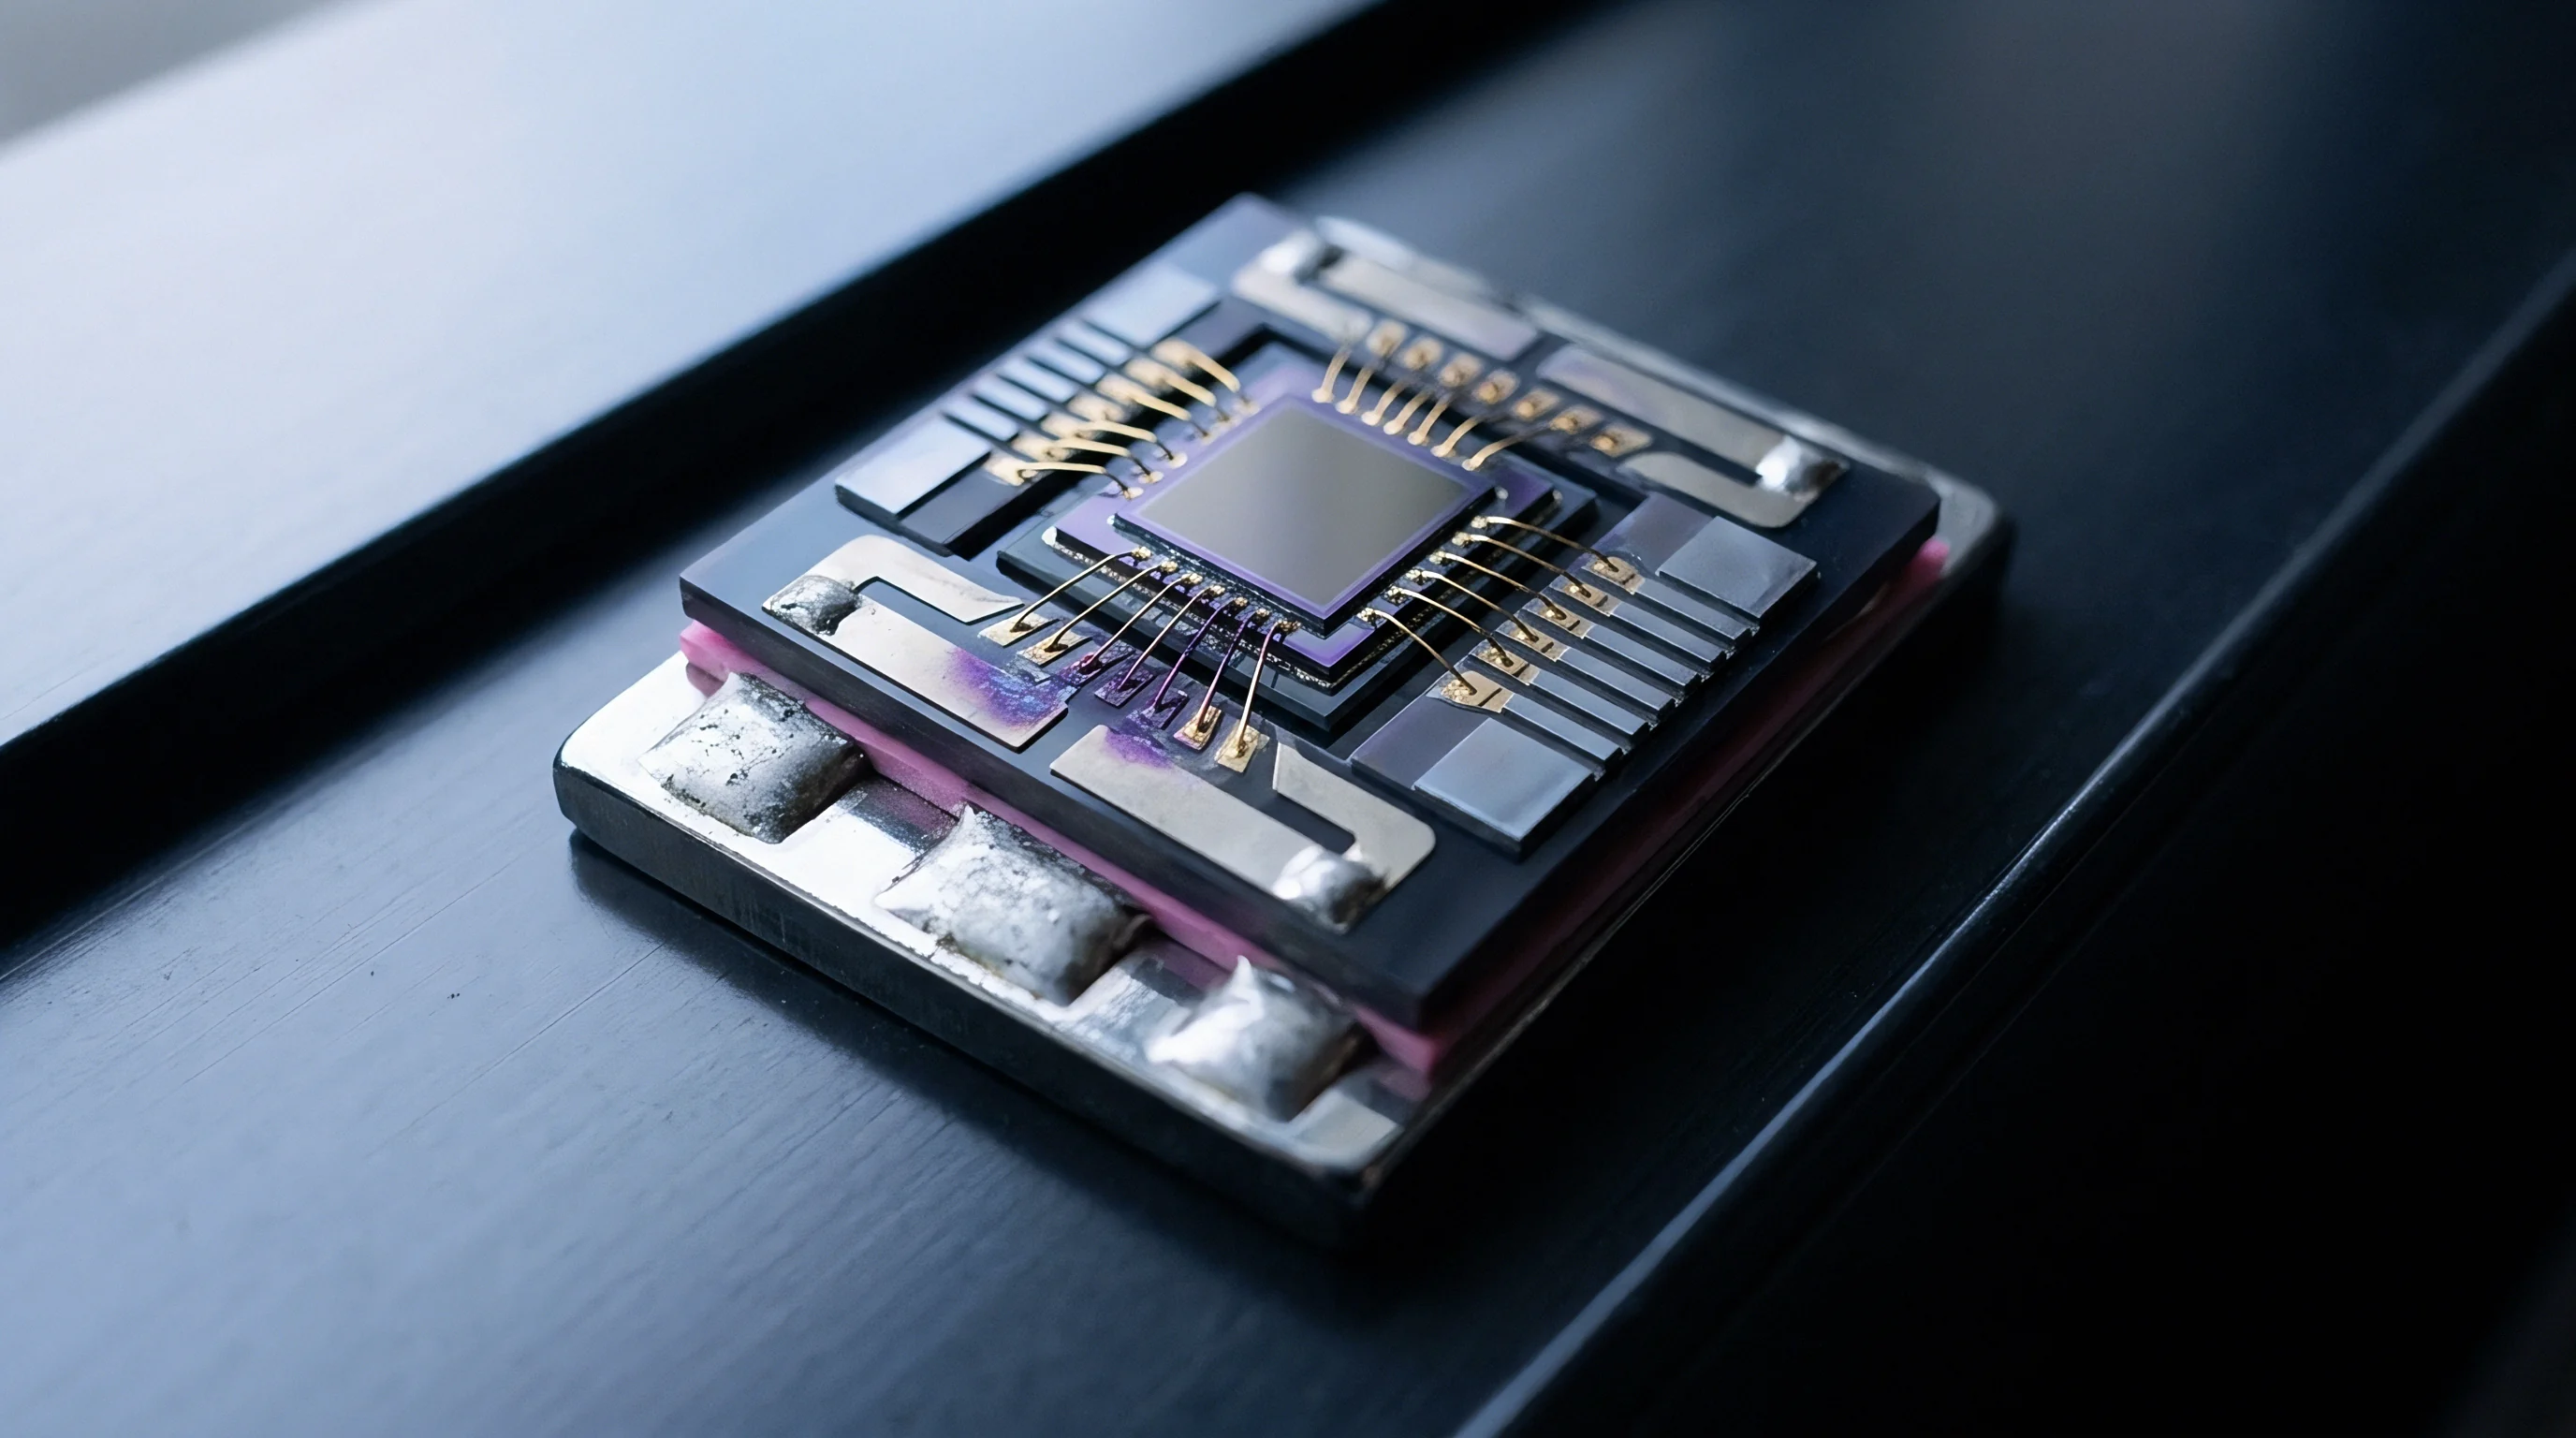

Creep
Thermal excursions during eutectic bonding and epoxy cross-linking leave silicon piezoresistive pressure dies trapped in a state of high mechanical pre-strain. A differential silicon diaphragm bonded to an alumina substrate with a standard bisphenol-A epoxy retains compressive shear stresses between 15 and 45 megapascals at room temperature. The piezoresistive coefficients of p-type silicon along the crystallographic direction convert this mechanical pre-strain directly into an electrical zero-point offset within the Wheatstone bridge.
When the polymer matrix relaxes over months of field deployment, that mechanical bias dissipates. The electrical zero wanders without any external pressure applied to the diaphragm.
Packaging stress relaxation originates in the viscoelastic nature of organic adhesives and transfer molding compounds. Polymeric die attaches, silicone protective gels, and filled epoxy encapsulants do not maintain an invariant elastic modulus over extended service durations. Macromolecular chains undergo continuous micro-Brownian motion, reorganizing under intrinsic strain to lower the free energy of the package assembly.
This molecular reconfiguration reduces packaging-induced stress according to time-dependent decay curves. The rate of relaxation tracks the ambient operating temperature relative to the glass transition temperature of the polymer system.
Silicon micromachined membranes exhibit negligible intrinsic mechanical hysteresis and virtually zero mechanical creep below 500 degrees Celsius. Packaging interfaces introduce the entire drift signature observed in commercial piezoresistive transducers. Sourcing teams frequently misdiagnose this baseline shift as sensor diaphragm fatigue or piezoresistor dopant migration.
Incoming lot inspections conducted at twenty-four hours post-assembly capture the sensor at its point of steepest mechanical decay. Calibration certificates issued during this initial window document an unstable state that degrades rapidly once the device enters storage or field operation.
Baseline offset drift in piezoresistive pressure cells stems from packaging polymer relaxation rather than silicon diaphragm degradation.
Silicone potting gels used to isolate sensing elements from corrosive process media contribute a distinct secondary relaxation mechanism. Polydimethylsiloxane compounds possess low elastic moduli, typically between 0.5 and 2.0 megapascals, yet their volumetric coefficient of thermal expansion exceeds 300 parts per million per kelvin. When confined inside rigid metallic or ceramic port cavities, these gels exert hydrostatic pressures against the micro-machined diaphragm during thermal cycling.
Enclosed air bubbles, incomplete cross-linking, and unreacted oligomers migrate toward the gel-diaphragm interface, changing local stress distributions over thousand-hour operational spans.
Suppliers routinely dismiss early zero-shift anomalies as transient bedding effects that vanish after two weeks of steady-state room-temperature storage.


Decay
Mechanical stress dissipation across polymeric die-attach layers follows a non-exponential, stretched relaxation trajectory. The instantaneous relaxation modulus of an amorphous polymer bond exhibits acute sensitivity to plasticizer extraction and cross-link density. Standard linear elastic assumptions fail to predict how residual stresses decline over multi-year deployment periods.
Characterizing this behavior requires examining the viscoelastic boundary layers connecting the silicon die to its carrier substrate.

Piezoresistive Coefficients and Mechanical Strain Transfer
Piezoresistive pressure sensors rely on the longitudinal and transverse piezoresistive coefficients, designated pi-11, pi-12, and pi-44. For p-type silicon resistors aligned along the crystal orientation of a (100) silicon wafer, the piezoresistive coefficient pi-44 dominates, reaching values near 138 times 10 to the power of negative eleven square meters per newton at 25 degrees Celsius. The relationship between mechanical stress components and relative resistance change governs signal transduction:
Delta R over R equals one-half times pi-44 times sigma-longitudinal minus sigma-transverse.
Packaging stresses apply non-uniform biaxial compression across the die plane. Asymmetrical epoxy fillet profiles produce unbalanced shear stresses across opposing bridge resistors. A net stress differential of only 250 kilopascals across orthogonal arms of a Wheatstone bridge induces an offset shift of roughly 0.15 percent of full-scale output on a 100-kilopascal pressure sensor.
As the adhesive relaxes, the magnitude of sigma-longitudinal and sigma-transverse decays unevenly, driving zero-point baseline drift.

Viscoelastic Relaxation Profiles in Packaging Materials
Structural adhesives display distinct relaxation kinetics dictated by their polymer chemistry, filler loading, and curing schedules. High filler loadings of silver flakes or silica reduce the coefficient of thermal expansion mismatch between silicon and alumina substrates. Elevated particle concentrations alter the viscoelastic relaxation spectrum by restricting polymer chain mobility near filler surfaces.
| Material Class | Glass Transition (Celsius) | Coefficient of Thermal Expansion (ppm/K) | Initial Modulus at 25C (GPa) | Stress Decay at 1000 Hours (%) | Zero Drift Equivalent (% FSO) |
|---|---|---|---|---|---|
| Silver-Filled Conductive Epoxy | 115 to 140 | 35 to 55 | 6.5 to 9.2 | 18 to 27 | 0.35 to 0.70 |
| Die-Attach Silicone Adhesive | -120 to -45 | 180 to 320 | 0.002 to 0.015 | 4 to 8 | 0.04 to 0.09 |
| Epoxy Mold Compound (Transfer) | 130 to 175 | 10 to 18 | 18.0 to 26.0 | 22 to 34 | 0.50 to 1.20 |
| Glass Frit Seal (Inorganic) | 380 to 450 | 6.5 to 8.5 | 55.0 to 70.0 | 0.1 to 0.4 | 0.01 to 0.03 |
Inorganic glass frit seals demonstrate negligible room-temperature viscoelastic decay due to their dense, cross-linked silicate structure. Silver-filled epoxies and epoxy transfer molding compounds exhibit substantial decay. Over 1000 hours of continuous operation at 85 degrees Celsius, transfer mold compounds can lose up to 34 percent of their frozen-in assembly stress.
This relaxation reconfigures the stress distribution across the active surface of the silicon die.

Strain Pathways in Sensor Assemblies
Packaging strain propagates through distinct mechanical pathways within a typical piezoresistive pressure cell assembly:
- Die Attach Boundary Layer transfers planar shear strains from the substrate directly into the inactive silicon bulk. Non-uniform adhesive bondline thickness creates tilting moments that tilt bridge balance.
- Substrate Flexure Coupling transmits external torque from process connections through header pins into the sensing cavity. Ceramic headers attenuate mounting torque more effectively than stamped leadframes.
- Molding Compound Shrinkage exerts three-dimensional compressive clamping forces over the encapsulated sensor die. Post-mold chemical shrinkage continues for hundreds of hours after demolding.
- Wire Bond Heel Stresses induce localized micro-strain fields near outer bond pads. While pad strains remain peripheral, aluminum wire bond relaxation affects low-pressure diaphragm margins.
Ignoring packaging relaxation dynamics during system design compromises industrial process safety loops, exposing facilities to unmetered batch overpressurization and costly emergency shutdown cycles.

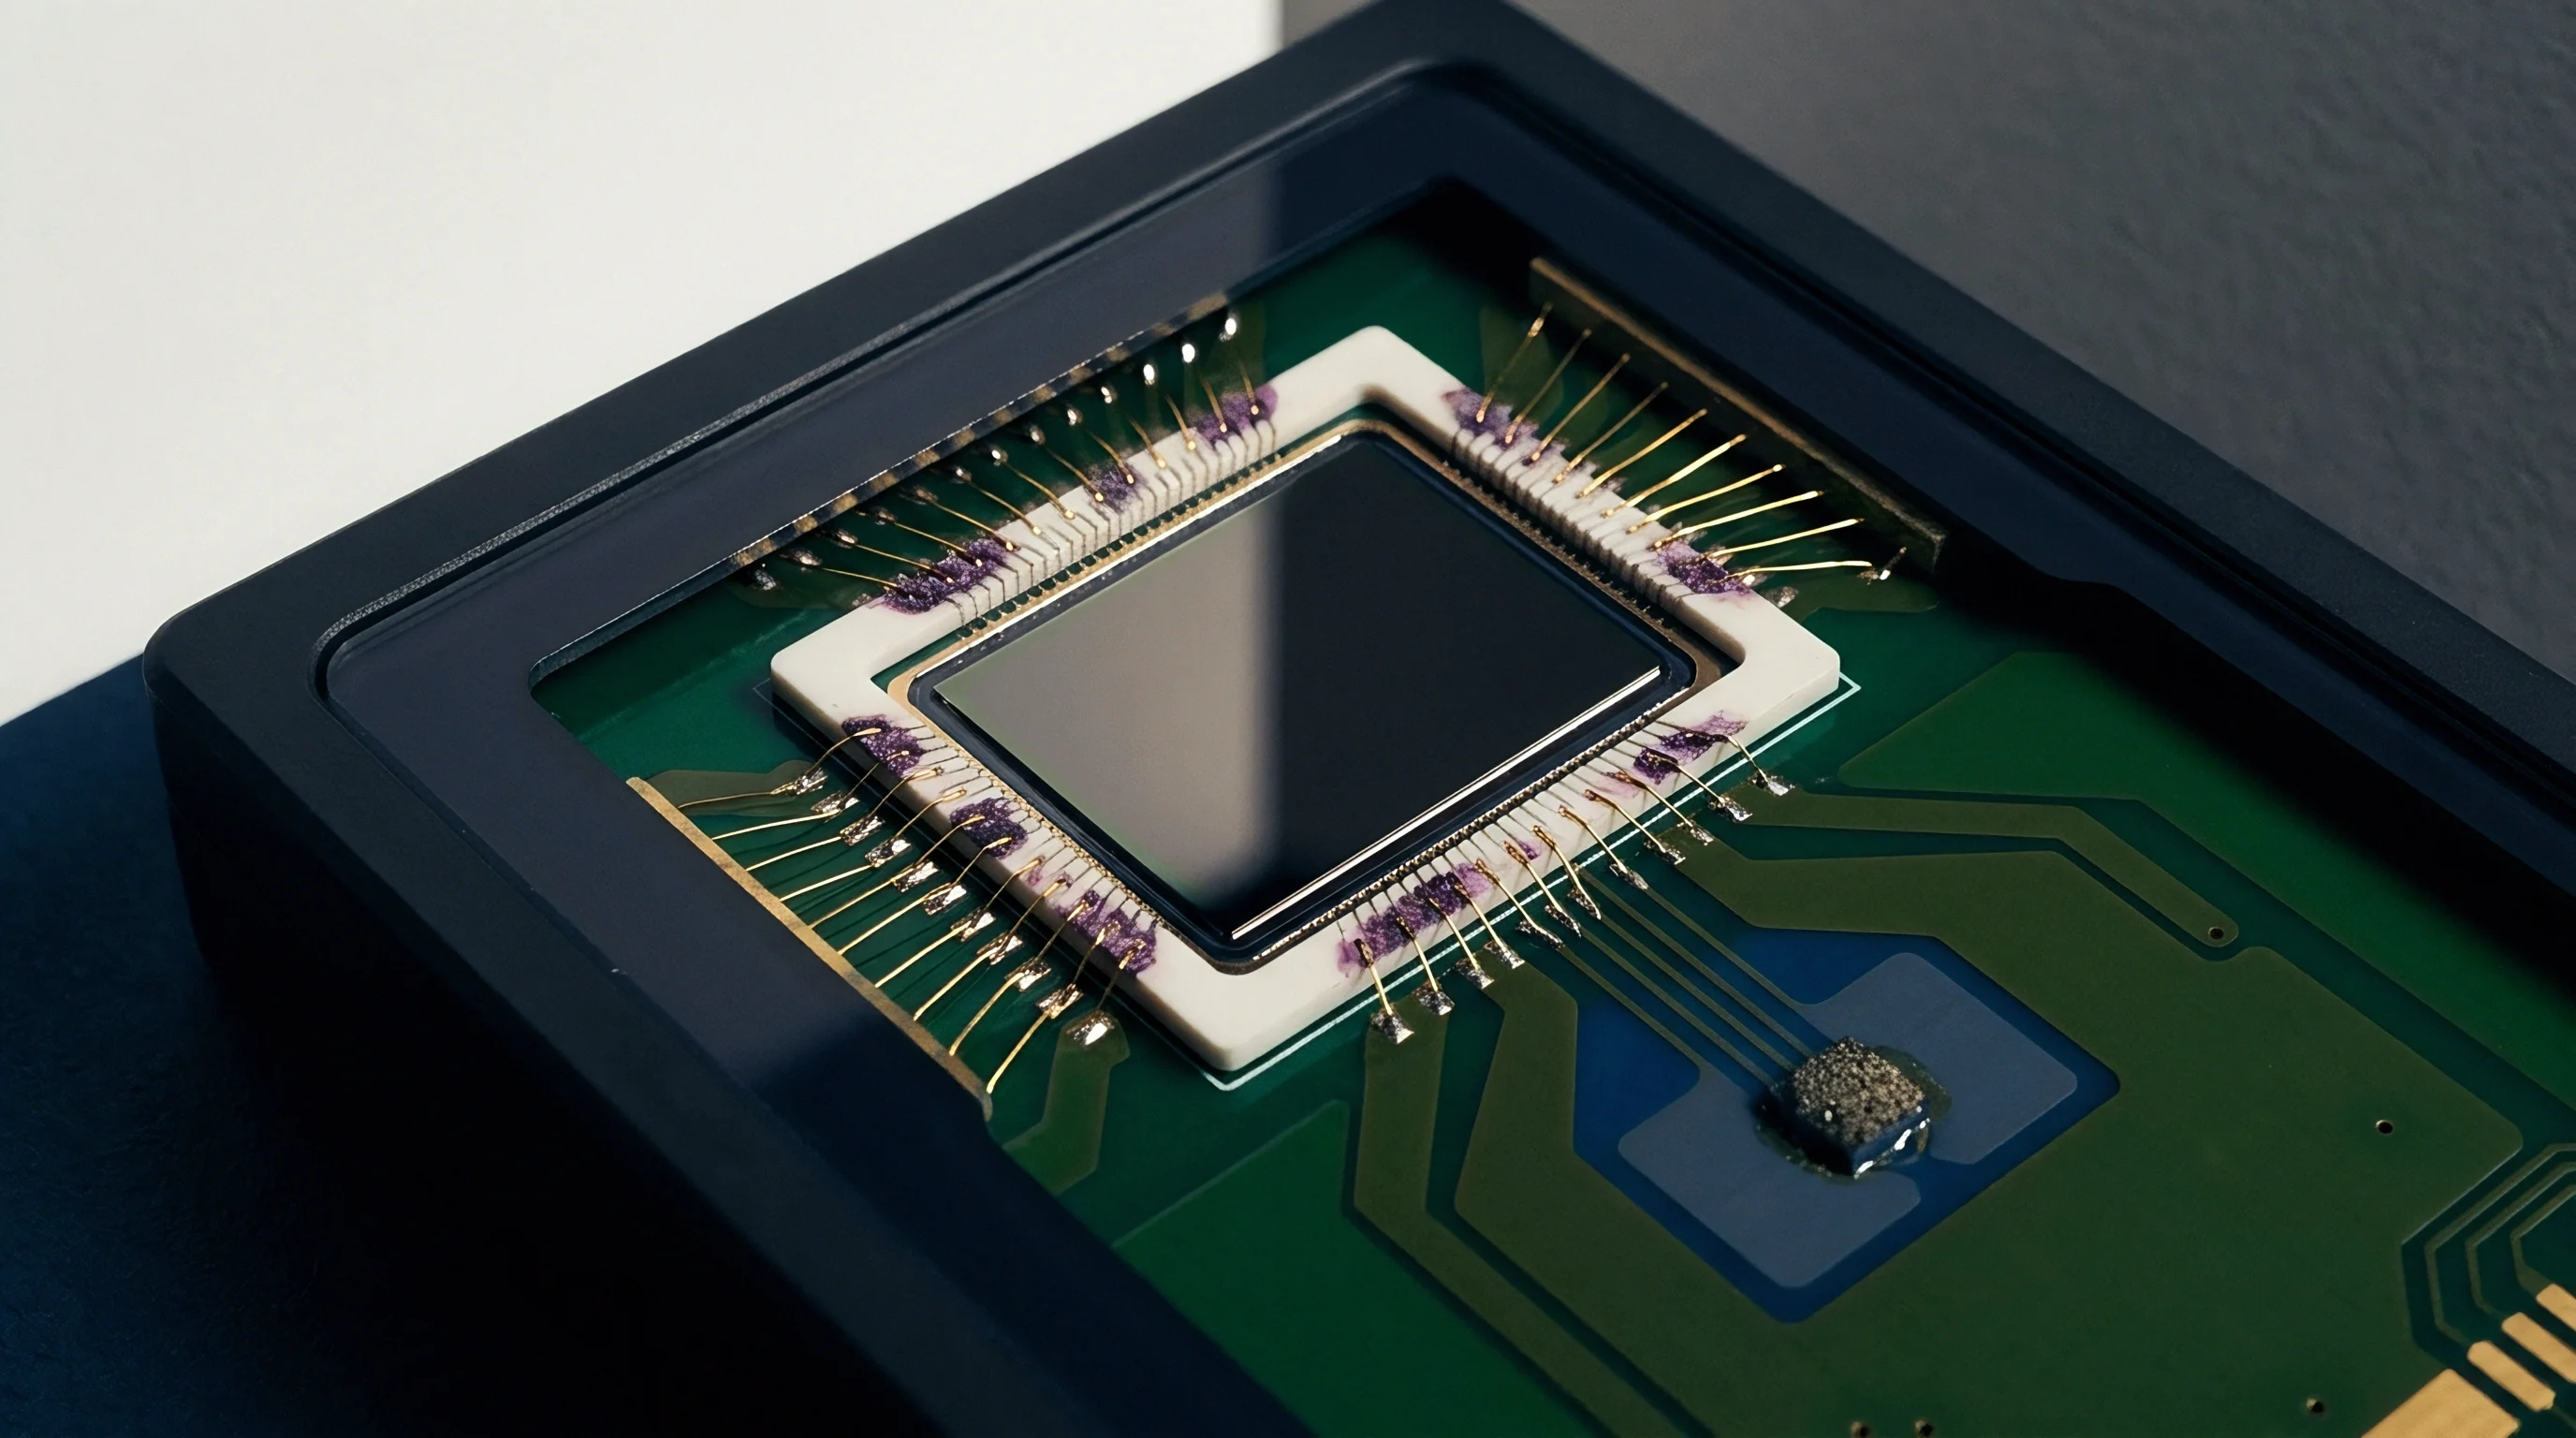
Curve
Empirical extrapolation of long-term packaging drift requires robust mathematical formulation. The Kohlrausch-Williams-Watts stretched exponential function accurately models the time-dependent relaxation modulus G of amorphous and semi-crystalline polymers across extended timelines:
G of t equals G-infinity plus G-zero minus G-infinity times the exponential of negative t divided by tau, all raised to the power of beta.
The parameter tau represents the characteristic relaxation time constant, G-zero defines the initial unrelaxed modulus, and G-infinity denotes the long-term equilibrium modulus. The stretching exponent beta falls between zero and one for disordered glassy materials. In heavily filled die-attach epoxies, beta typically settles between 0.35 and 0.55.
Lower beta values flatten the relaxation curve, extending observable drift across several operating years rather than allowing early stabilization.
A stretching exponent below one-half indicates that packaging stress relaxation will persist across years of field operation rather than stabilizing within months.
Why Do Polymer Bonds Relax under Load?
External constraints lock polymer chains into high-energy conformational states during thermal cooling from cure temperatures. Molecules attempt to restore thermodynamic equilibrium through segmental rotational transitions around chemical backbone bonds. Steric hindrance from bulky side groups and dense cross-link nodes prevents immediate mechanical equilibrium.
Relaxation proceeds along an extensive spectrum of molecular activation energies, generating the characteristic logarithmic time dependence observed on calibration test benches.
Elevated operating temperatures accelerate this molecular rearrangement. Time-temperature superposition allows engineers to shift short-term high-temperature stress decay data to predict multi-year behavior at lower operating temperatures. The empirical shift factor a-T follows the Williams-Landel-Ferry equation when the operating temperature sits near the glass transition temperature Tg:
Log a-T equals negative C-one times T minus T-ref, divided by C-two plus T minus T-ref.
For temperatures situated thirty degrees Celsius or more below the glass transition, Arrhenius kinetics provide a more dependable activation model. Die-attach epoxy relaxation activation energies typically range from 0.75 to 1.15 electron volts. Sourcing engineers using unverified activation energy values introduce errors exceeding 200 percent when projecting annual zero-point drift.

Predictive Drift Modeling and Empirical Correlation
Accelerated life testing conducted under IEC 60068-2-2 standards at 125 degrees Celsius forces rapid viscoelastic relaxation. Translating high-temperature test results to an industrial environment operating at 30 degrees Celsius reveals the steep slope of sensor drift. The table below illustrates modeled baseline offset drift across five years for a 1-megapascal industrial pressure sensor packaged with standard silver-filled conductive epoxy, assuming an activation energy of 0.88 electron volts.
| Operating Time (Hours) | Equivalent Service Life at 25C | Remaining Package Stress (%) | Cumulative Offset Shift (% FSO) | Drift Rate (% FSO / Year) |
|---|---|---|---|---|
| 168 | 1.5 Months | 91.2 | 0.18 | 1.44 |
| 1000 | 9.0 Months | 84.5 | 0.31 | 0.41 |
| 4380 | 3.3 Years | 76.8 | 0.47 | 0.14 |
| 8760 | 6.6 Years | 71.4 | 0.58 | 0.08 |
| 26280 | 20.0 Years | 63.1 | 0.75 | 0.03 |
The drift rate decays logarithmically over time. The sensor experiences greater offset drift during its first nine months than during the subsequent six years. High-grade calibration procedures that overlook this initial steep gradient force premature out-of-tolerance failures during early field deployment.
Sensors held in unpowered storage undergo identical viscoelastic relaxation as units operating under continuous bias current.
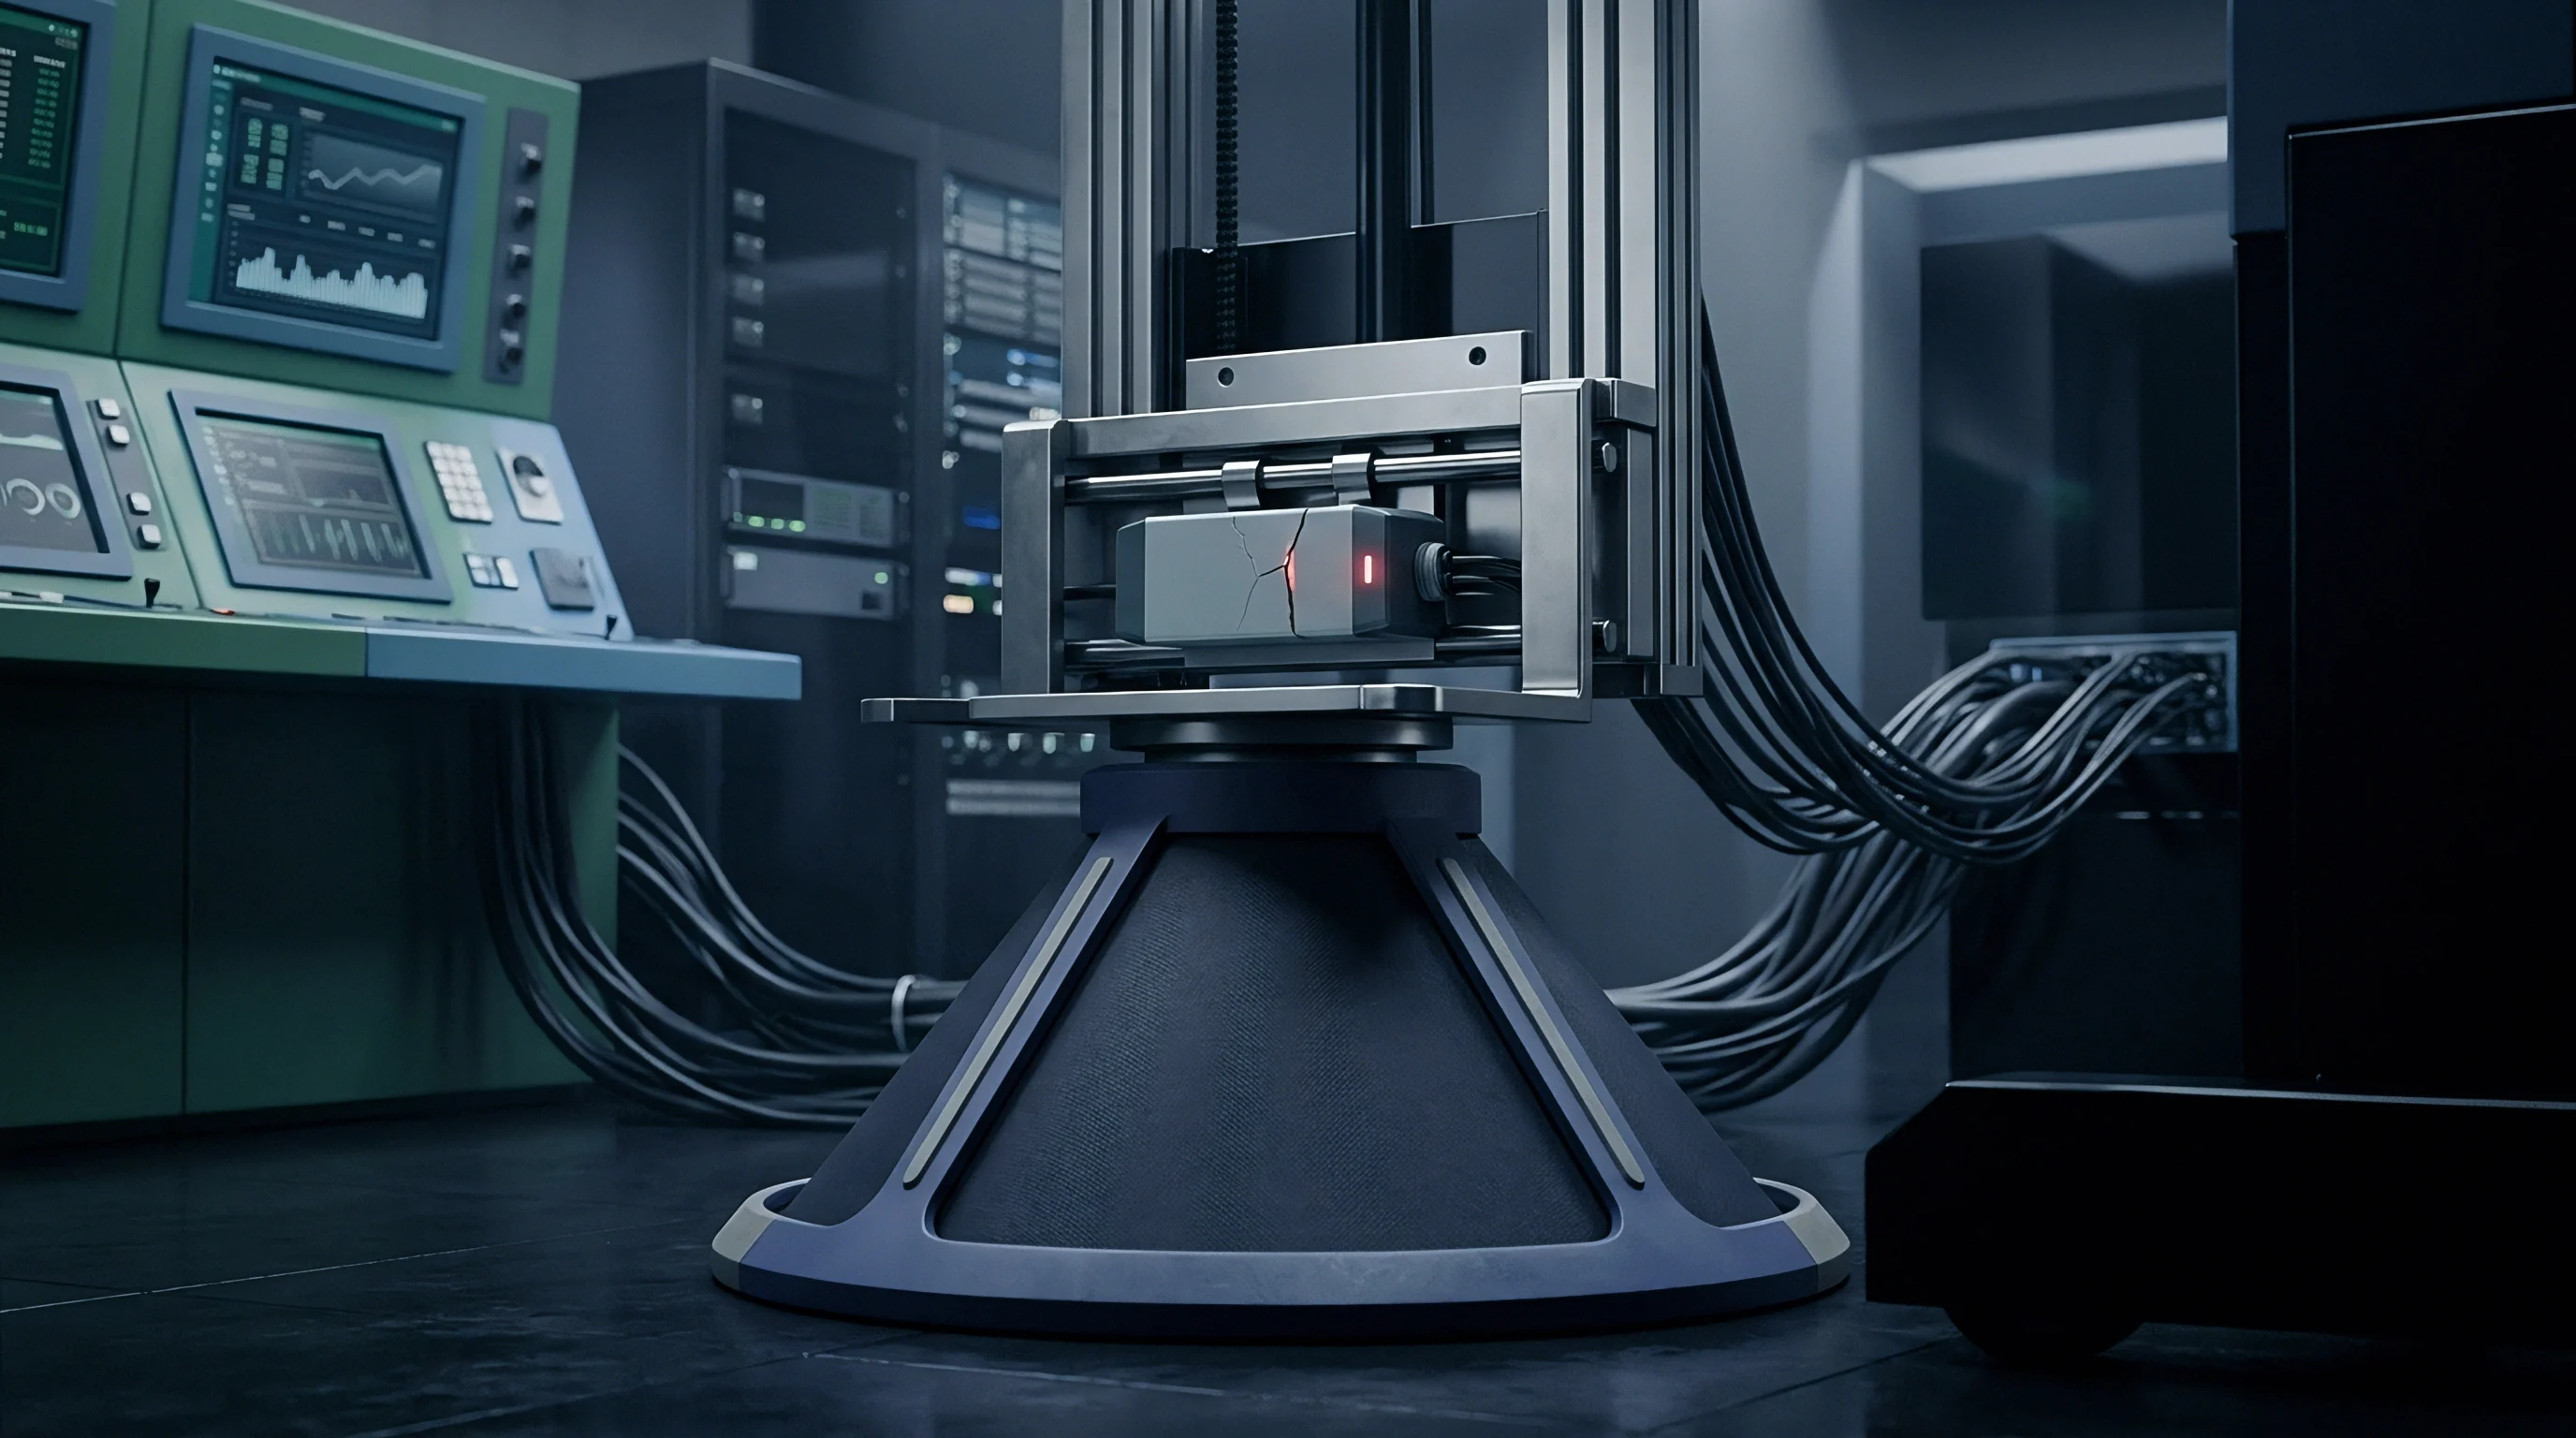
Horizon
Establishing recalibration intervals requires balancing measurement tolerance limits against modeled stress decay trajectories. When an application specifies an allowable total error band of plus or minus 0.50 percent of full scale, packaging stress relaxation consumes a defined portion of that budget. A sensor exhibiting an annual zero-drift of 0.25 percent of full scale exhausts its permissible drift margin within twelve months, independent of sensitivity shift or thermal hysteresis errors.
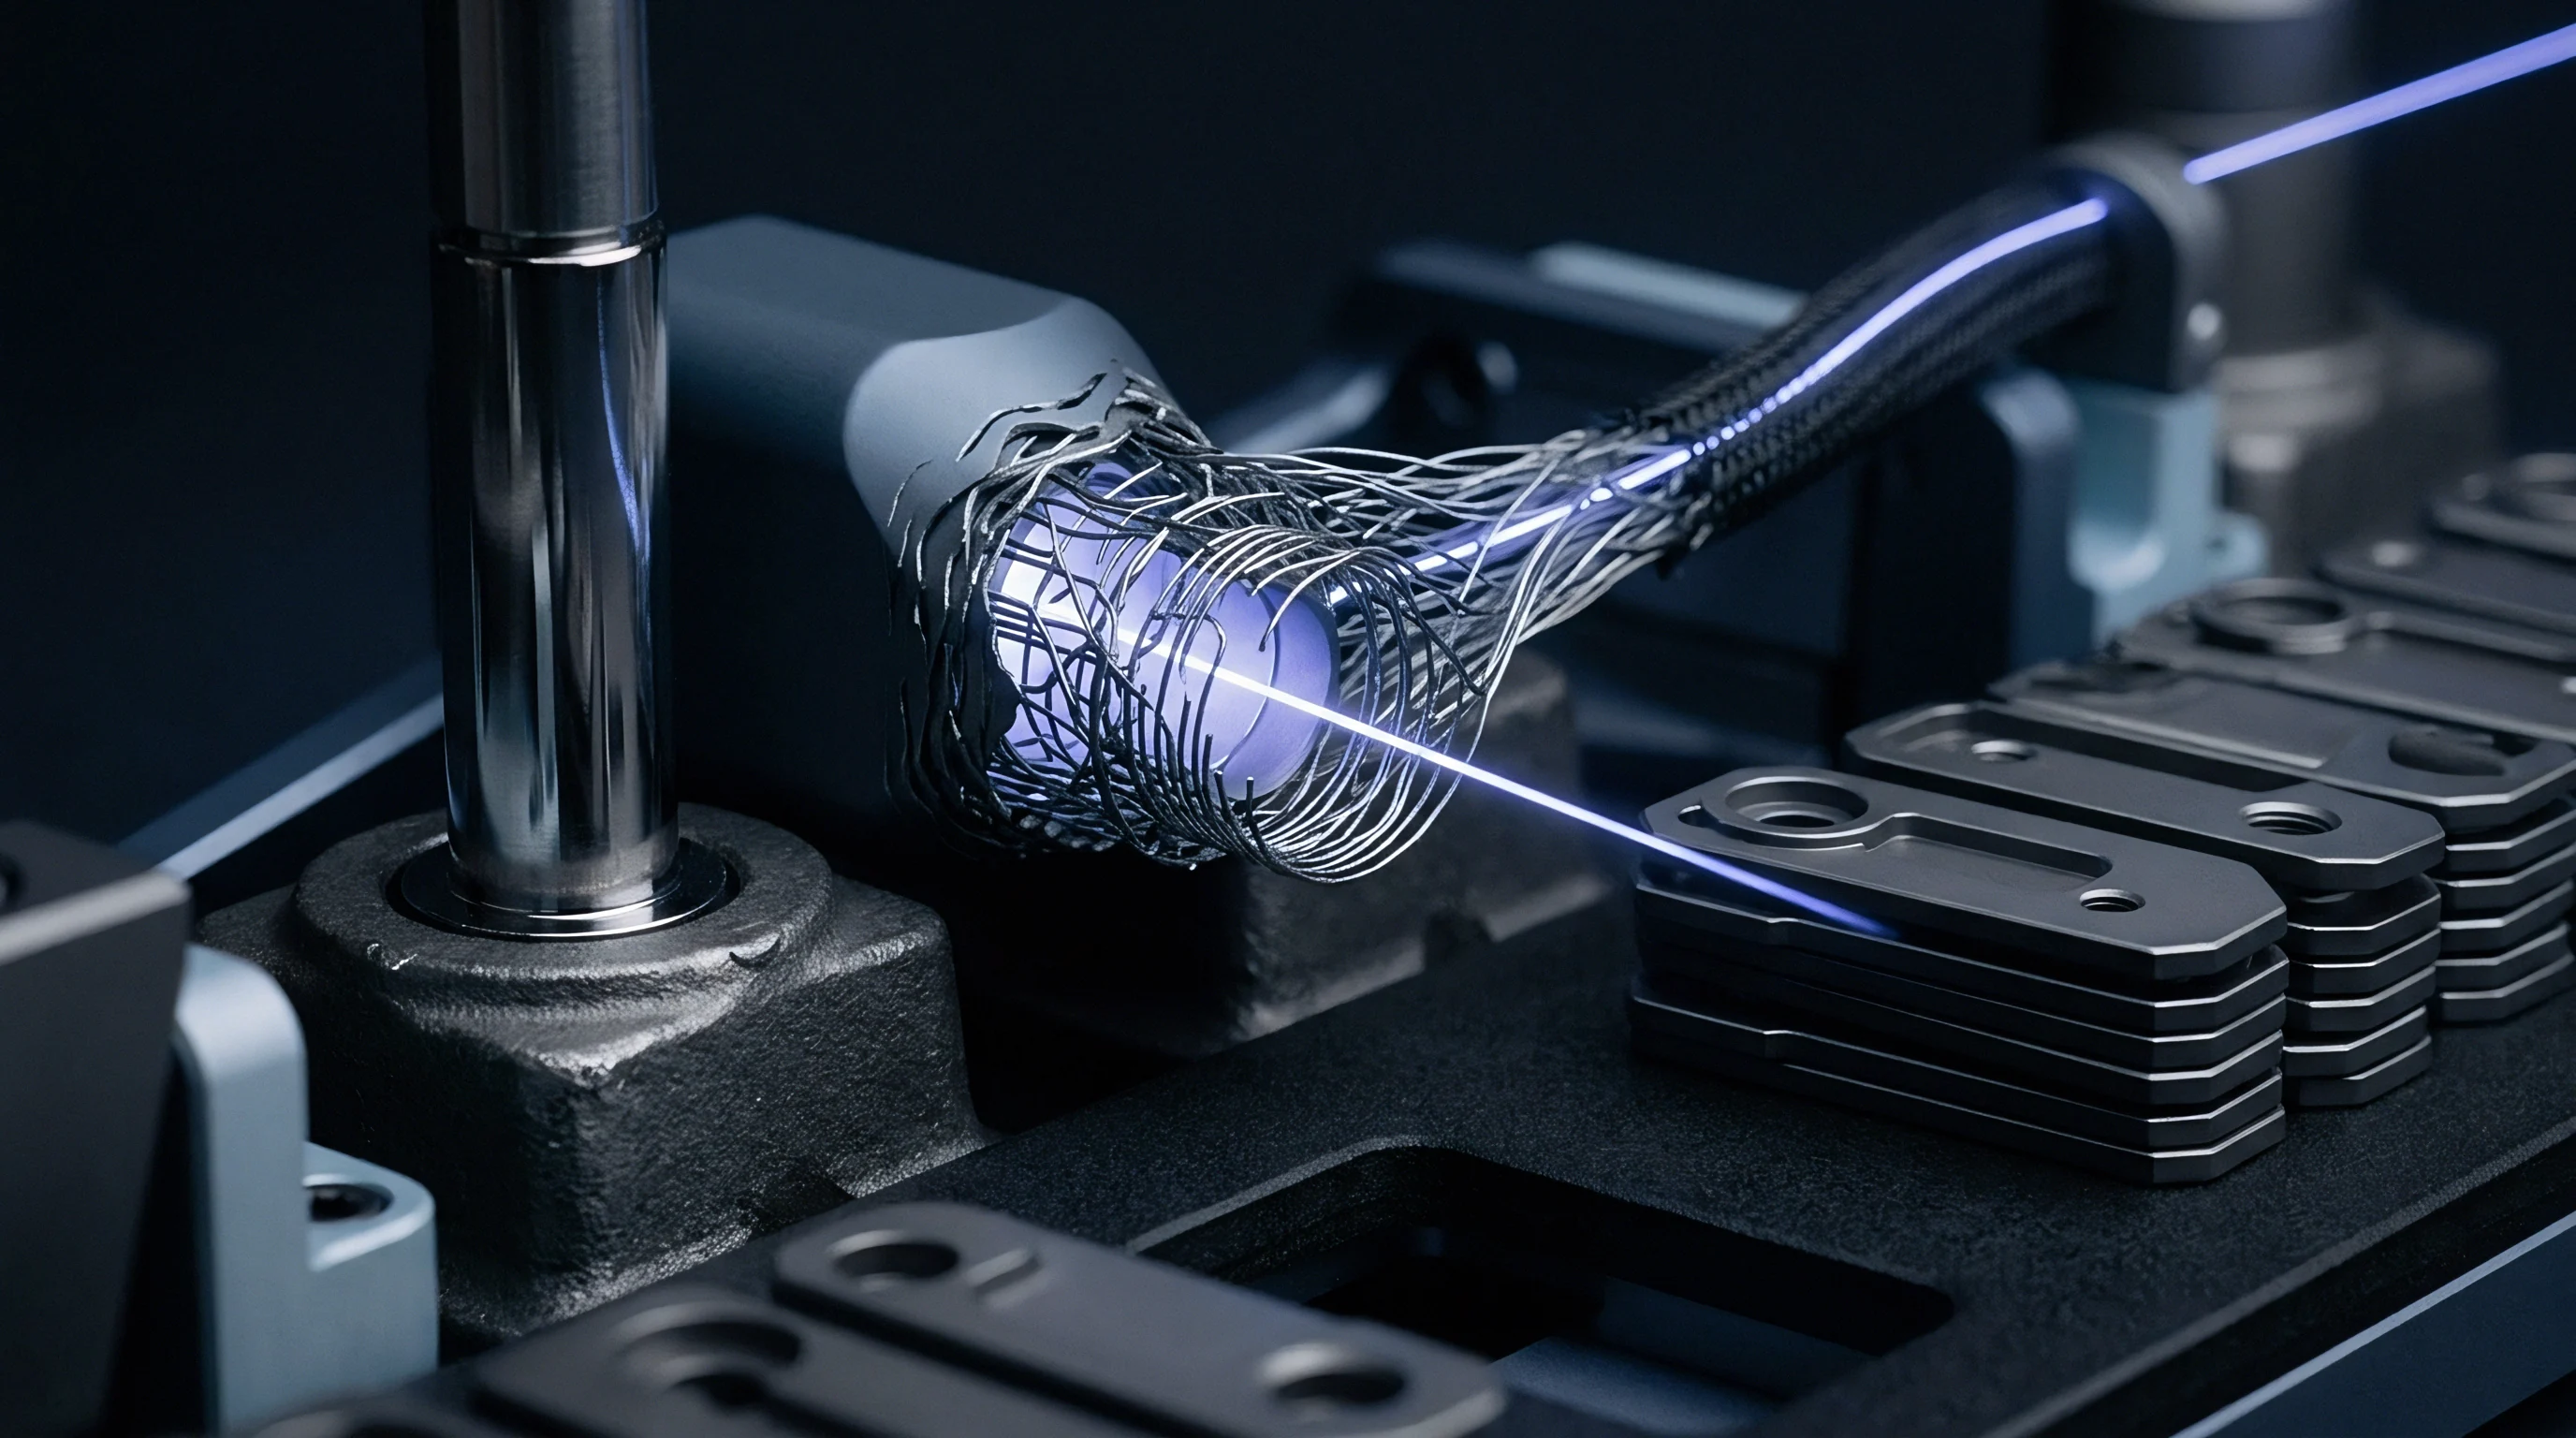
Uncertainty Budget Allocation for Industrial Sensors
Metrology engineers construct uncertainty budgets in accordance with JCGM 100 guidelines to isolate packaging drift from independent uncertainty contributions. The expanded calibration uncertainty U-expanded must remain comfortably smaller than the process tolerance delta-T to maintain an acceptable test uncertainty ratio:
U-expanded equals k times the square root of u-calibration squared plus u-temperature squared plus u-hysteresis squared plus u-drift squared.
With a coverage factor k equal to 2, establishing a 95.45 percent level of confidence, the permissible drift allocation u-drift shrinks rapidly. If calibration standard uncertainty accounts for 0.05 percent FSO and thermal errors contribute 0.18 percent FSO, an initial total error budget of 0.50 percent FSO leaves roughly 0.12 percent FSO for long-term packaging drift. Under standard epoxy die attach, this margin is fully depleted within seven months of initial factory calibration.

Is Extended Burn in Economically Viable?
Manufacturers deploy high-temperature pre-aging to consume the steep initial portion of the stretched relaxation curve before final trim and test operations. Subjecting raw sensor assemblies to a thermal soak at 125 degrees Celsius for 168 hours accelerates polymer chain rearrangement. This thermal conditioning stabilizes the baseline, shifting initial field exposure into the flatter plateau of the Kohlrausch-Williams-Watts curve.
The economic viability of thermal pre-aging hinges on work-in-progress capital holding costs and test oven throughput constraints. Holding automotive-grade sensor assemblies in environmental chambers adds direct batch-processing expenses. For high-volume commodity transmitters, these holding costs can exceed the assembly labor expense.
In aerospace and medical transducers, unconditioned sensors drive warranty return rates that eclipse upfront thermal stabilization costs.
Executing an operational recalibration cycle requires a strict metrological sequence:
- Isolate the transducer from process pipework and verify zero-pressure differential conditions across ports under barometric reference tracking.
- Record the raw electrical zero-point output across a twenty-minute stabilization window to evaluate short-term creep recovery.
- Apply five ascending pressure setpoints up to full scale using deadweight testers traceable to national metrology institutes under ISO/IEC 17025 accredited scopes.
- Calculate span linearity and terminal-based hysteresis to isolate packaging zero shifts from diaphragm mechanical damage.
- Compute the net zero-point drift rate per unit operating month and adjust the internal digital signal processor register coefficients.
Accredited calibration intervals cannot remain static calendar fixtures when field monitoring shows non-linear packaging relaxation.
Under ISO 10012 measurement management rules, interval adjustments must reflect verified drift data rather than static manufacturer recommendations.
Whether mechanical stress ever completely stabilizes in cross-linked thermosets exposed to ambient moisture cycling remains an open question in long-term polymer physics.


Schedule
Recalibration schedules governed by arbitrary twelve-month cycles fail to reflect the physical mechanics of packaging relaxation. An instrument calibrated strictly on an annual calendar operates under excessive risk during its first year, when drift rates run at their highest. That same instrument operates with wasteful conservatism during its fifth year, when viscoelastic relaxation has slowed by an order of magnitude.

Adaptive Maintenance Intervals and Verification Windows
Procurement teams achieve superior measurement integrity and lower lifecycle expenditures by transitioning from fixed-interval calibration to dynamic, stress-derived recalibration schedules. Initial recalibration occurs at six months following installation to capture the termination of early-stage relaxation. The second verification window opens twelve months later, at eighteen months of cumulative operation.
Subsequent calibration horizons expand to twenty-four and thirty-six month increments once empirical drift rates confirm arrival at the viscoelastic plateau.
This dynamic interval schedule reduces total lifetime calibration cycles by forty percent across a ten-year plant lifecycle. Plant technicians eliminate redundant handling risks and process interruptions while maintaining statistical process control limits.

Contractual Tolerance Clauses and Procurement Governance
Procuring piezoresistive pressure transmitters requires translating viscoelastic degradation mechanics into legally binding purchase specifications. Typical datasheets cite long-term stability as 0.1 percent of full-scale output per year without identifying reference temperature limits or baseline stabilization pre-treatments. Suppliers exploit this ambiguous wording by performing calibration tests on pre-aged devices while shipping green inventory that undergoes maximum stress relaxation in client facilities.
A rigorous specification establishes explicit boundary conditions for long-term drift compliance. Purchase orders should stipulate: Zero-point offset drift shall not exceed 0.20 percent of full-scale span across 8760 continuous operational hours at ambient temperatures between 15 and 35 degrees Celsius, verified under ISO/IEC 17025 laboratory conditions with a coverage factor of two. Including this requirement obligates the supplier to perform adequate factory thermal burn-in prior to final calibration trimming.
Quality agreements must also specify delivery conditions regarding elapsed storage time between factory calibration and end-user site installation. Transmitters stocked in regional distribution centers for nine months prior to commissioning arrive with depleted packaging stresses and shifted zero baselines. Demanding a fresh zero-balance verification at site acceptance prevents uncalibrated factory drift from polluting process plant commissioning baselines.
Under standard commercial terms governed by ISO 10012 Clause 7.1.2, calibration intervals adjust downward automatically whenever verification reveals zero drift exceeding seventy percent of the allocated measurement uncertainty limit.