Dynamic Mechanical Analysis for Measuring Viscoelastic Creep in Semiconductor Joint Polymers
Dynamic mechanical analysis measures time-dependent compliance spectra to predict multi-year creep strain and joint fatigue in semiconductor packaging polymers.

Creep
A package substrate warps after five hundred thermal cycles because the underfill yields under constant shear. The joint polymer carries a continuous mechanical load imposed by the mismatch in thermal expansion between silicon and organic laminates. That mismatch generates an internal shear field that relaxes over time, producing time-dependent strain at temperatures well below the polymer glass transition.
Dynamic mechanical analysis resolves the time-dependent mechanical response of these cross-linked packaging resins, converting oscillatory force and displacement data into viscoelastic compliance parameters.
In electronic packaging architectures, polymers serve structural and adhesive functions across flip-chip underfills, non-conductive pastes, die attach adhesives, and mold compounds. An underfill formulation based on cycloaliphatic epoxy resin loaded with 65 weight percent silica spheres exhibits an initial room-temperature tensile storage modulus near 8.5 gigapascals. When held at 125 degrees Celsius under a static shear load of 15 megapascals, this material undergoes progressive permanent deformation.
Over one thousand hours, creep strain accumulates, redistributing stresses away from the resin bulk and concentrating displacement onto the perimeter copper pillar bumps.
Underfill loaded with 65 weight percent silica demonstrates a storage modulus decrease from 8.5 gigapascals at 25 degrees Celsius to 1.2 gigapascals at 130 degrees Celsius under a 1 hertz oscillatory sweep.
Dynamic mechanical analyzers apply continuous or oscillatory loads to quantify this time-dependent relaxation. The instrument measures the complex modulus, separating instantaneous elastic energy storage from viscous dissipation. When evaluating packaging formulations, viscoelastic characterization requires tracking the shift of the loss tangent peak alongside the long-term decay of the storage compliance.
These metrics provide the empirical constitutive inputs for viscoplastic and viscoelastic finite element sub-models.
A buyer drafting procurement specifications for semiconductor joint polymers faces severe discrepancies if mechanical parameters derive exclusively from room-temperature quasi-static tensile tests. Standard tensile data obscures the low-frequency viscous flow that dominates long dwell times in power cycling regimes. Without dynamic and transient mechanical data captured across the full operational thermal envelope, joint integrity simulations underestimate solder bump fatigue by factors exceeding three.
When creep compliance data is omitted from the material qualification sheet, the packaging assembler accepts catastrophic fatigue failures in downstream thermal stress screening.
Compliance
Viscoelastic characterization treats polymer deformation through linear hereditary mechanics. The fundamental material function governing sustained loading is creep compliance, defined as the ratio of time-dependent strain to constant applied stress. In dynamic mechanical analysis, this property connects mathematically to the complex compliance components derived from frequency sweeps through integral transform relations.

Linear Viscoelasticity Formulations
Applying a step stress input produces an immediate elastic response followed by delayed viscous flow. The total strain response is governed by Boltzmann superposition, asserting that each stress increment contributes independently to the ultimate strain history. For linear viscoelastic behavior, the applied stress and resulting strain remain proportional across all observation windows:
The time-dependent creep compliance function, denoted as D of t, decomposes into three components: an instantaneous elastic compliance, a retarded viscoelastic compliance governed by a spectrum of internal molecular retardation times, and a Newtonian viscous flow term. The viscous flow term becomes zero in densely cross-linked thermosetting networks below their degradation threshold, leaving the retarded elastic compliance as the primary variable dictating dimensional drift.
Oscillatory dynamic testing operates in the frequency domain, outputting the storage compliance D-prime and loss compliance D-double-prime as functions of angular frequency. Conversion from frequency domain oscillatory data to time domain creep compliance utilizes the approximation derived by Ninomiya and Ferry. This mathematical bridge permits high-frequency oscillatory sweeps executed over minutes to predict long-term transient compliance without requiring continuous year-long static load holds.
Constitutive Model Implementation
Semiconductor reliability engineers require discrete mathematical parameters to populate finite element software packages running Anand viscoplasticity or generalized Maxwell models. Dynamic mechanical instruments extract these parameters by fitting creep and relaxation curves to Prony series expansions. A Prony series discretizes the continuous relaxation spectrum into a finite sum of exponential decay terms, representing parallel combinations of Hookean springs and Newtonian dashpots.
Fitting a generalized Kelvin-Voigt model to creep compliance curves yields discrete retardation times and partial compliances. The accuracy of numerical fatigue simulations rests on capturing enough spectral modes to span five to seven decades of logarithmic time. Table 1 outlines the standard constitutive models used to process dynamic mechanical analysis data into simulation-ready mechanical decks.
| Model Topology | Mathematical Formulation | Dominant Polymer Region | Simulation Implementation |
|---|---|---|---|
| Maxwell Element | J(t) = J0 + t / eta | Uncrosslinked melts and fluid glues | Transient stress relaxation routines |
| Kelvin-Voigt Unit | J(t) = J0 (1 – exp(-t / tau)) | Primary rubbery plateau relaxation | Direct creep compliance integration |
| Generalized Prony Series | J(t) = J0 + Sum | Glass transition and glassy-rubbery transition | ANSYS or ABAQUS viscoelastic material cards |
| Burgers Four-Element | J(t) = J1 + t / eta1 + J2 (1 – exp(-t / tau)) | Thermoset adhesives with plasticization | Combined creep-recovery boundary analysis |
Sustained creep experiments conducted outside the linear viscoelastic regime corrupt constitutive models. When shear stress exceeds a critical threshold, physical aging, chain scission, and micro-void growth introduce non-linearities that void standard Boltzmann superposition. Dynamic mechanical analysis determines this linear boundary by running stress or strain sweeps at fixed temperatures, locating the exact amplitude where the complex modulus drops by more than two percent from its low-strain plateau.
The operational consequence of running tests beyond this threshold is immediate: the Prony terms extracted from non-linear data over-predict relaxation rates during low-amplitude operational cycles, leading to over-designed packaging architectures or erroneous structural life assertions.


Transduction
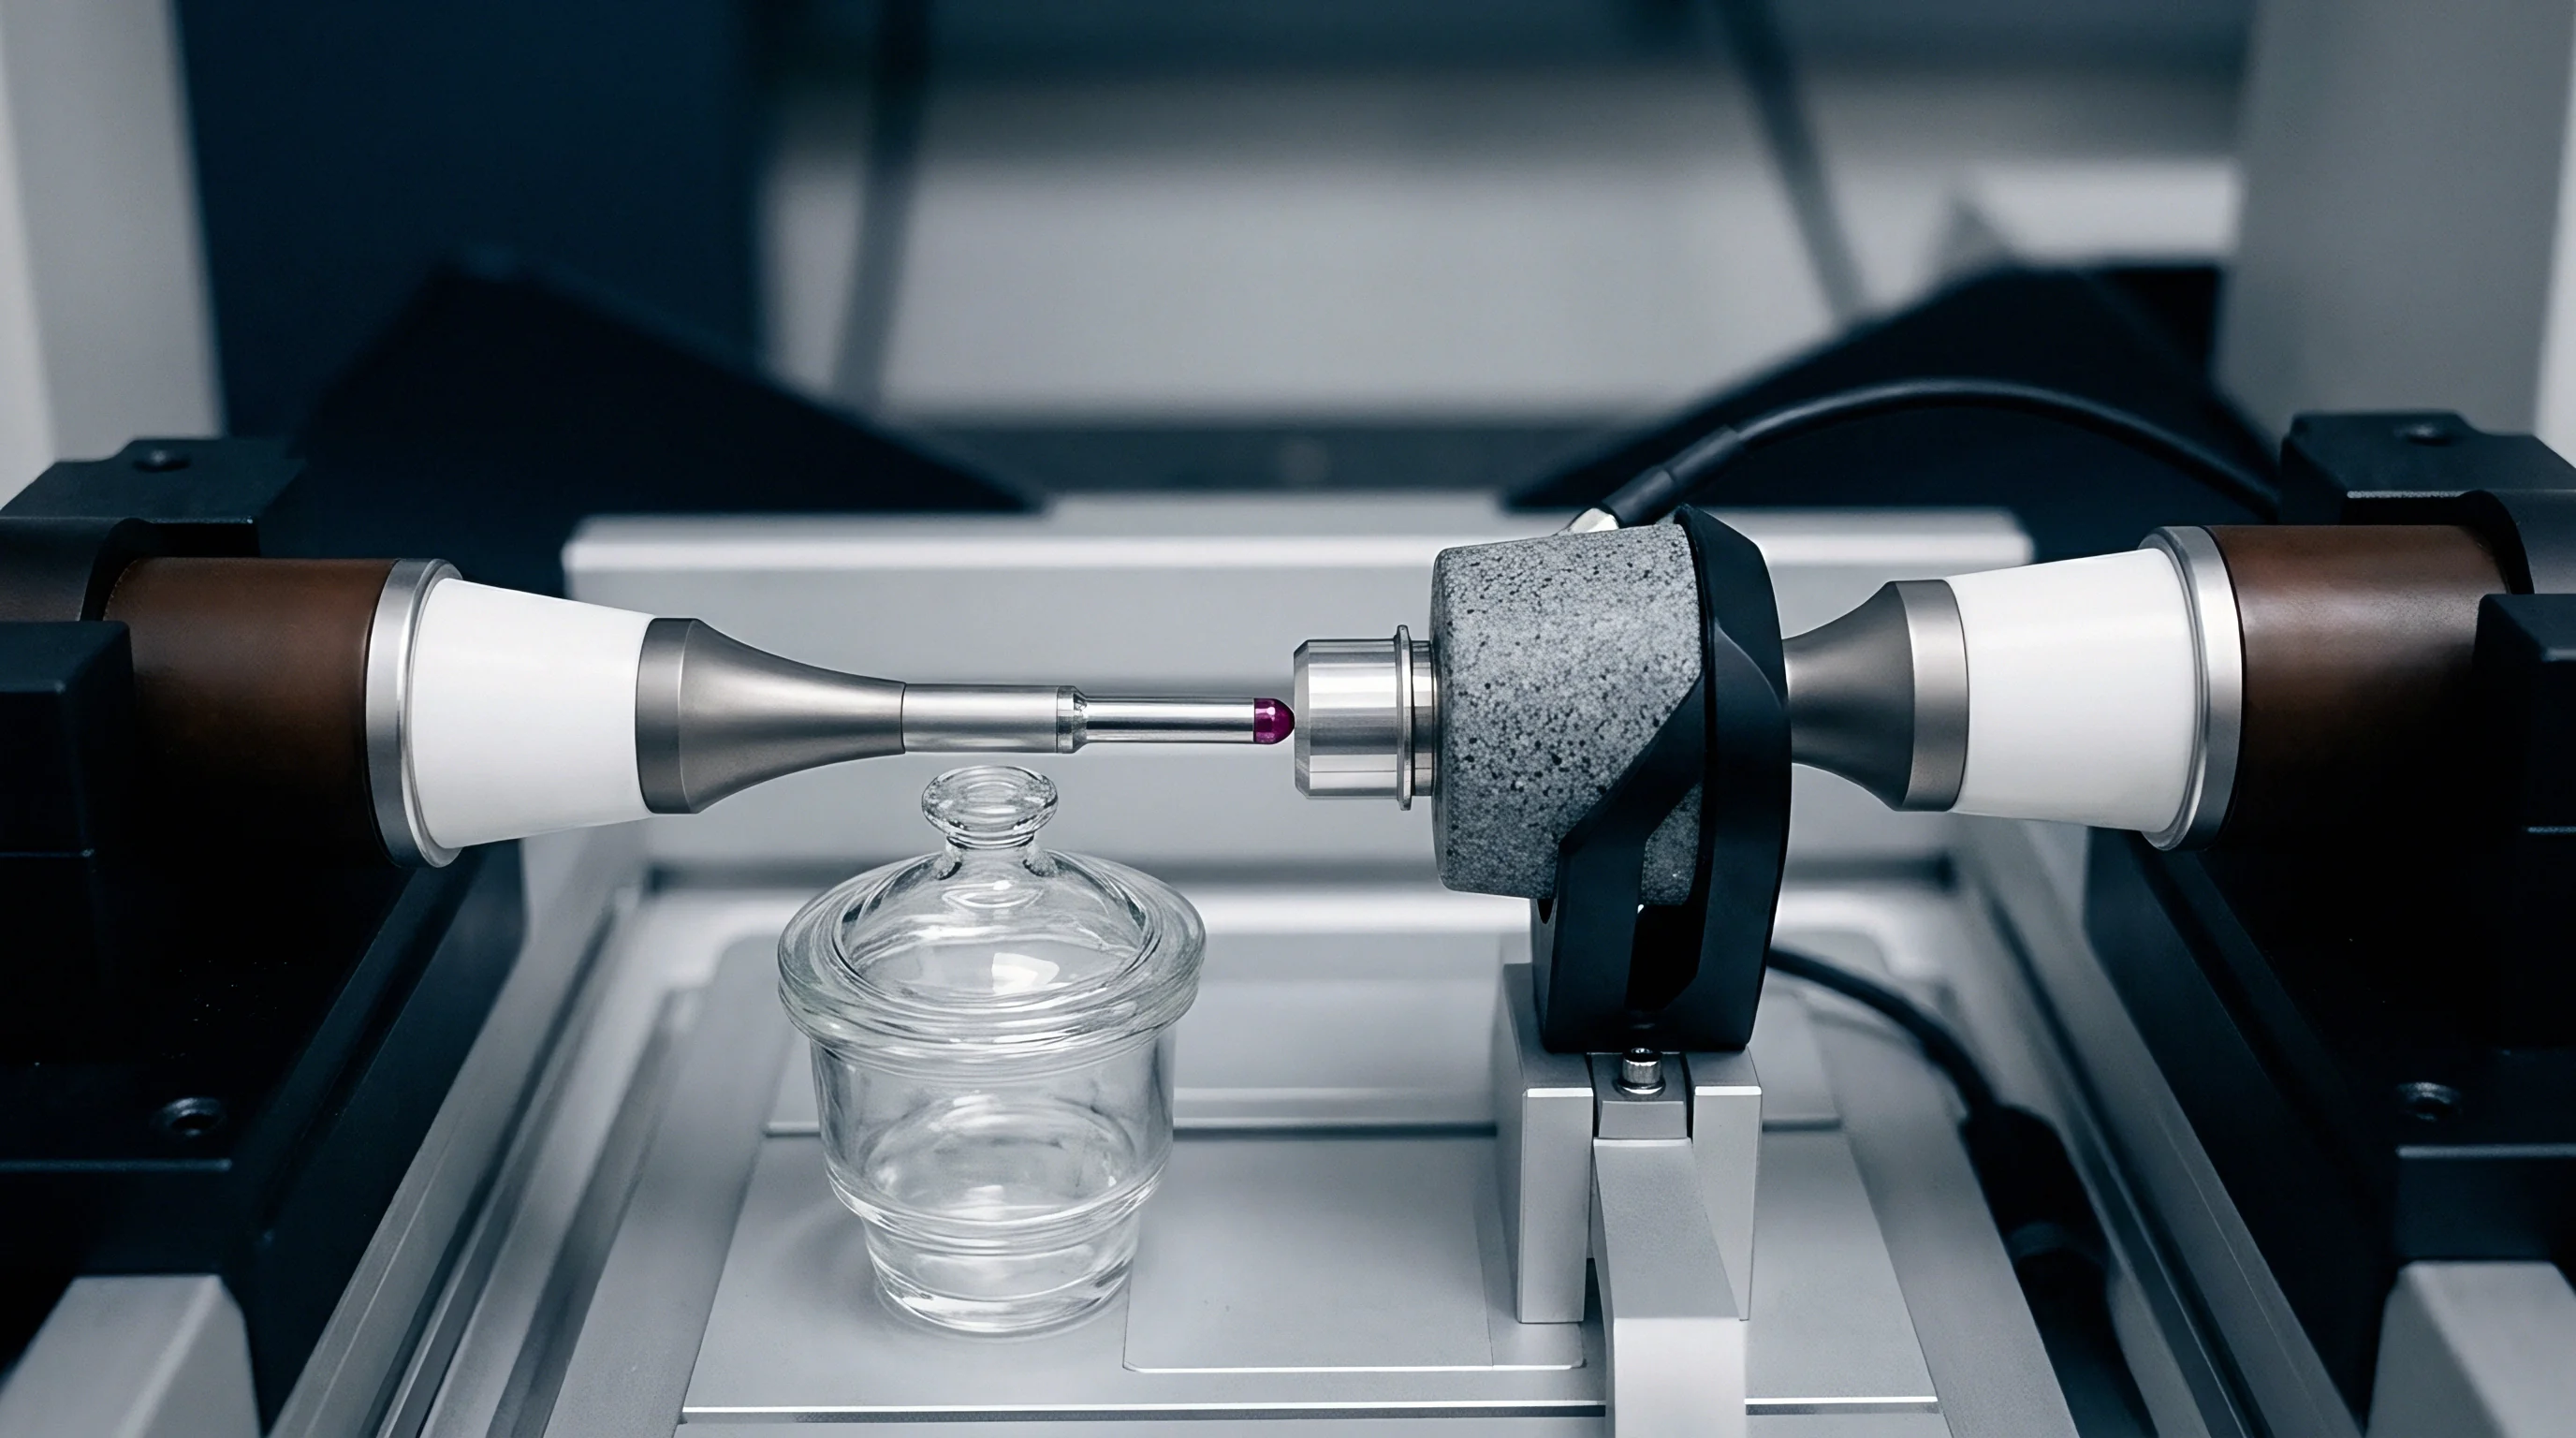
Dynamic mechanical analyzers rely on high-precision electromechanical transduction to decouple minute material displacements from instrument frame compliance. An instrument dedicated to joint polymer analysis must resolve sub-nanometer length changes while delivering forces spanning from millinewtons to tens of newtons. The transducer topology directly dictates measurement bandwidth, signal-to-noise ratio, and operational temperature limits.
Drive and Sensing Architecture
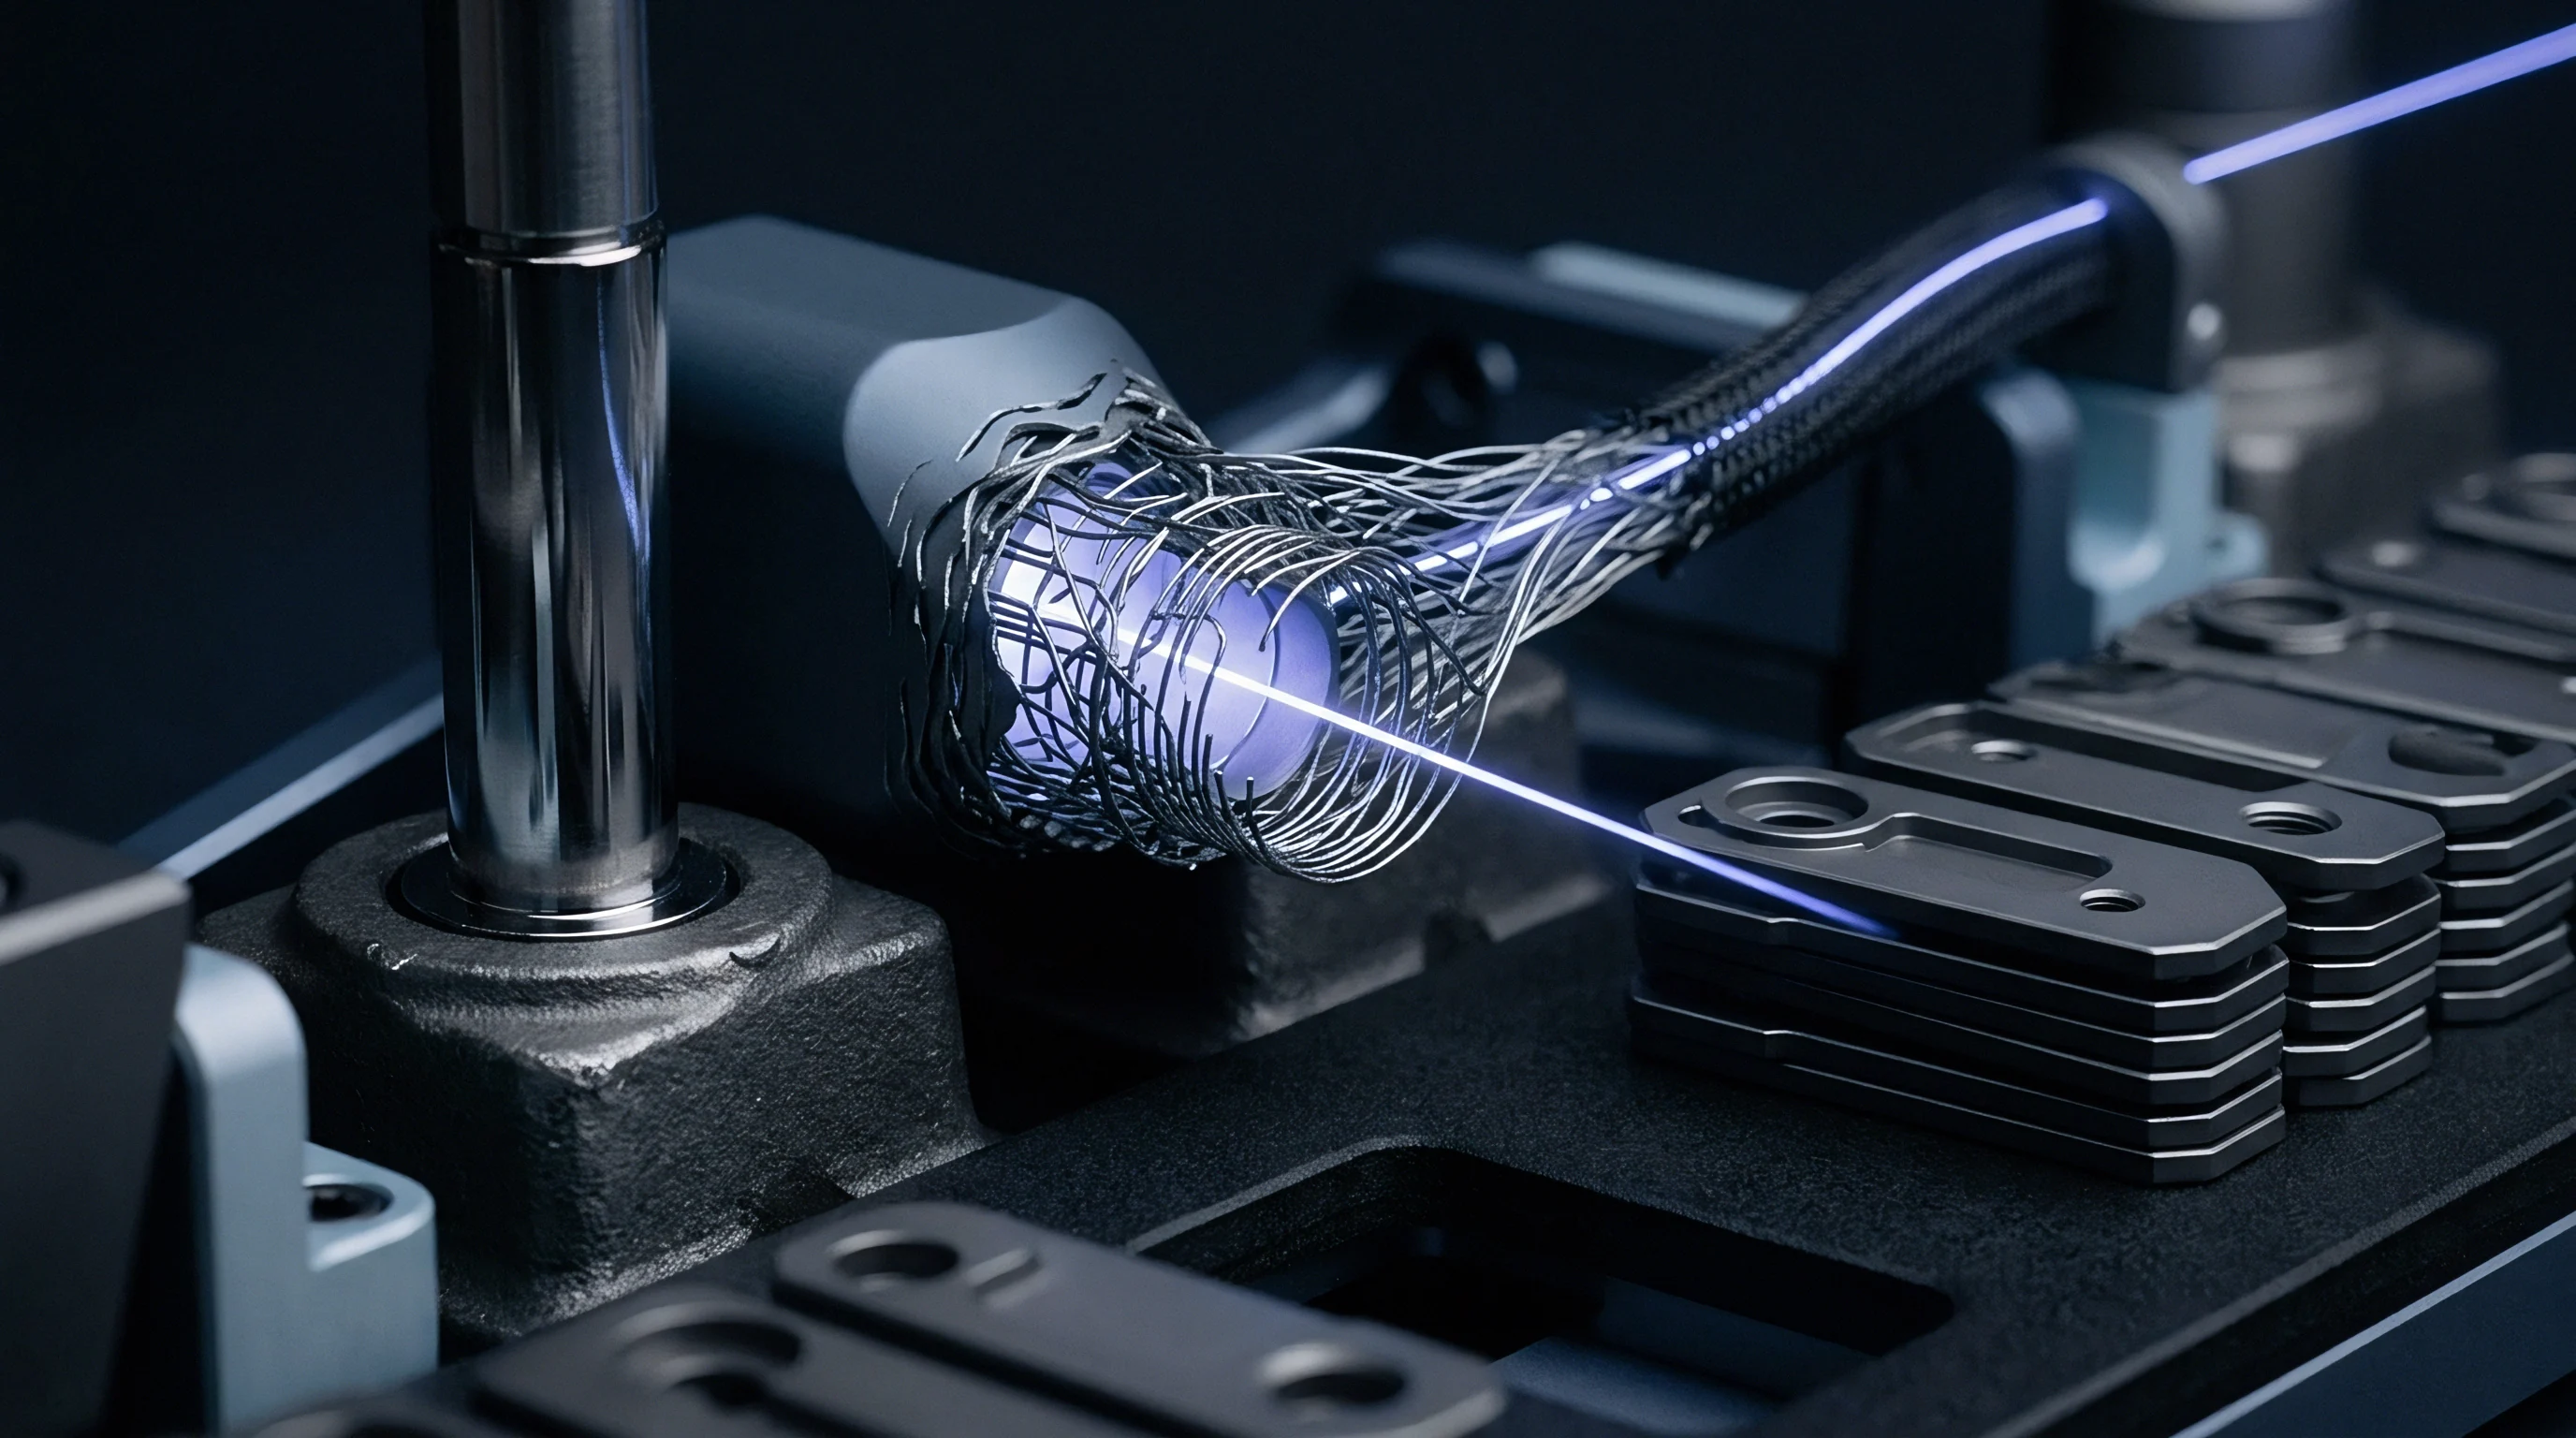
Load application utilizes a non-contact linear voice coil motor. A voice coil motor eliminates mechanical gear backlash and minimizes friction by suspending the moving drive shaft within magnetic fields, supported by flexible air bearings. Supplying electrical current through the coil generates an axial Lorentz force proportional to current density and magnetic flux.
This direct-drive configuration produces dynamic force resolution down to 0.0001 newtons, permitting non-destructive interrogation of tiny semiconductor adhesive coupons.
Displacement tracking employs optical linear encoders or linear variable differential transformers. Optical encoders deliver higher displacement resolution, reaching 0.1 nanometers across a travel range of several millimeters. The core of the displacement transducer mounts directly to the drive shaft, tracking specimen deformation during oscillatory cycles.
Thermal drift inside the displacement sensor assembly requires rigorous isolation, achieved through quartz drive shafts that decouple the heated furnace zone from the room-temperature transducer housing.
Clamp Mechanics and Parasitic Compliance
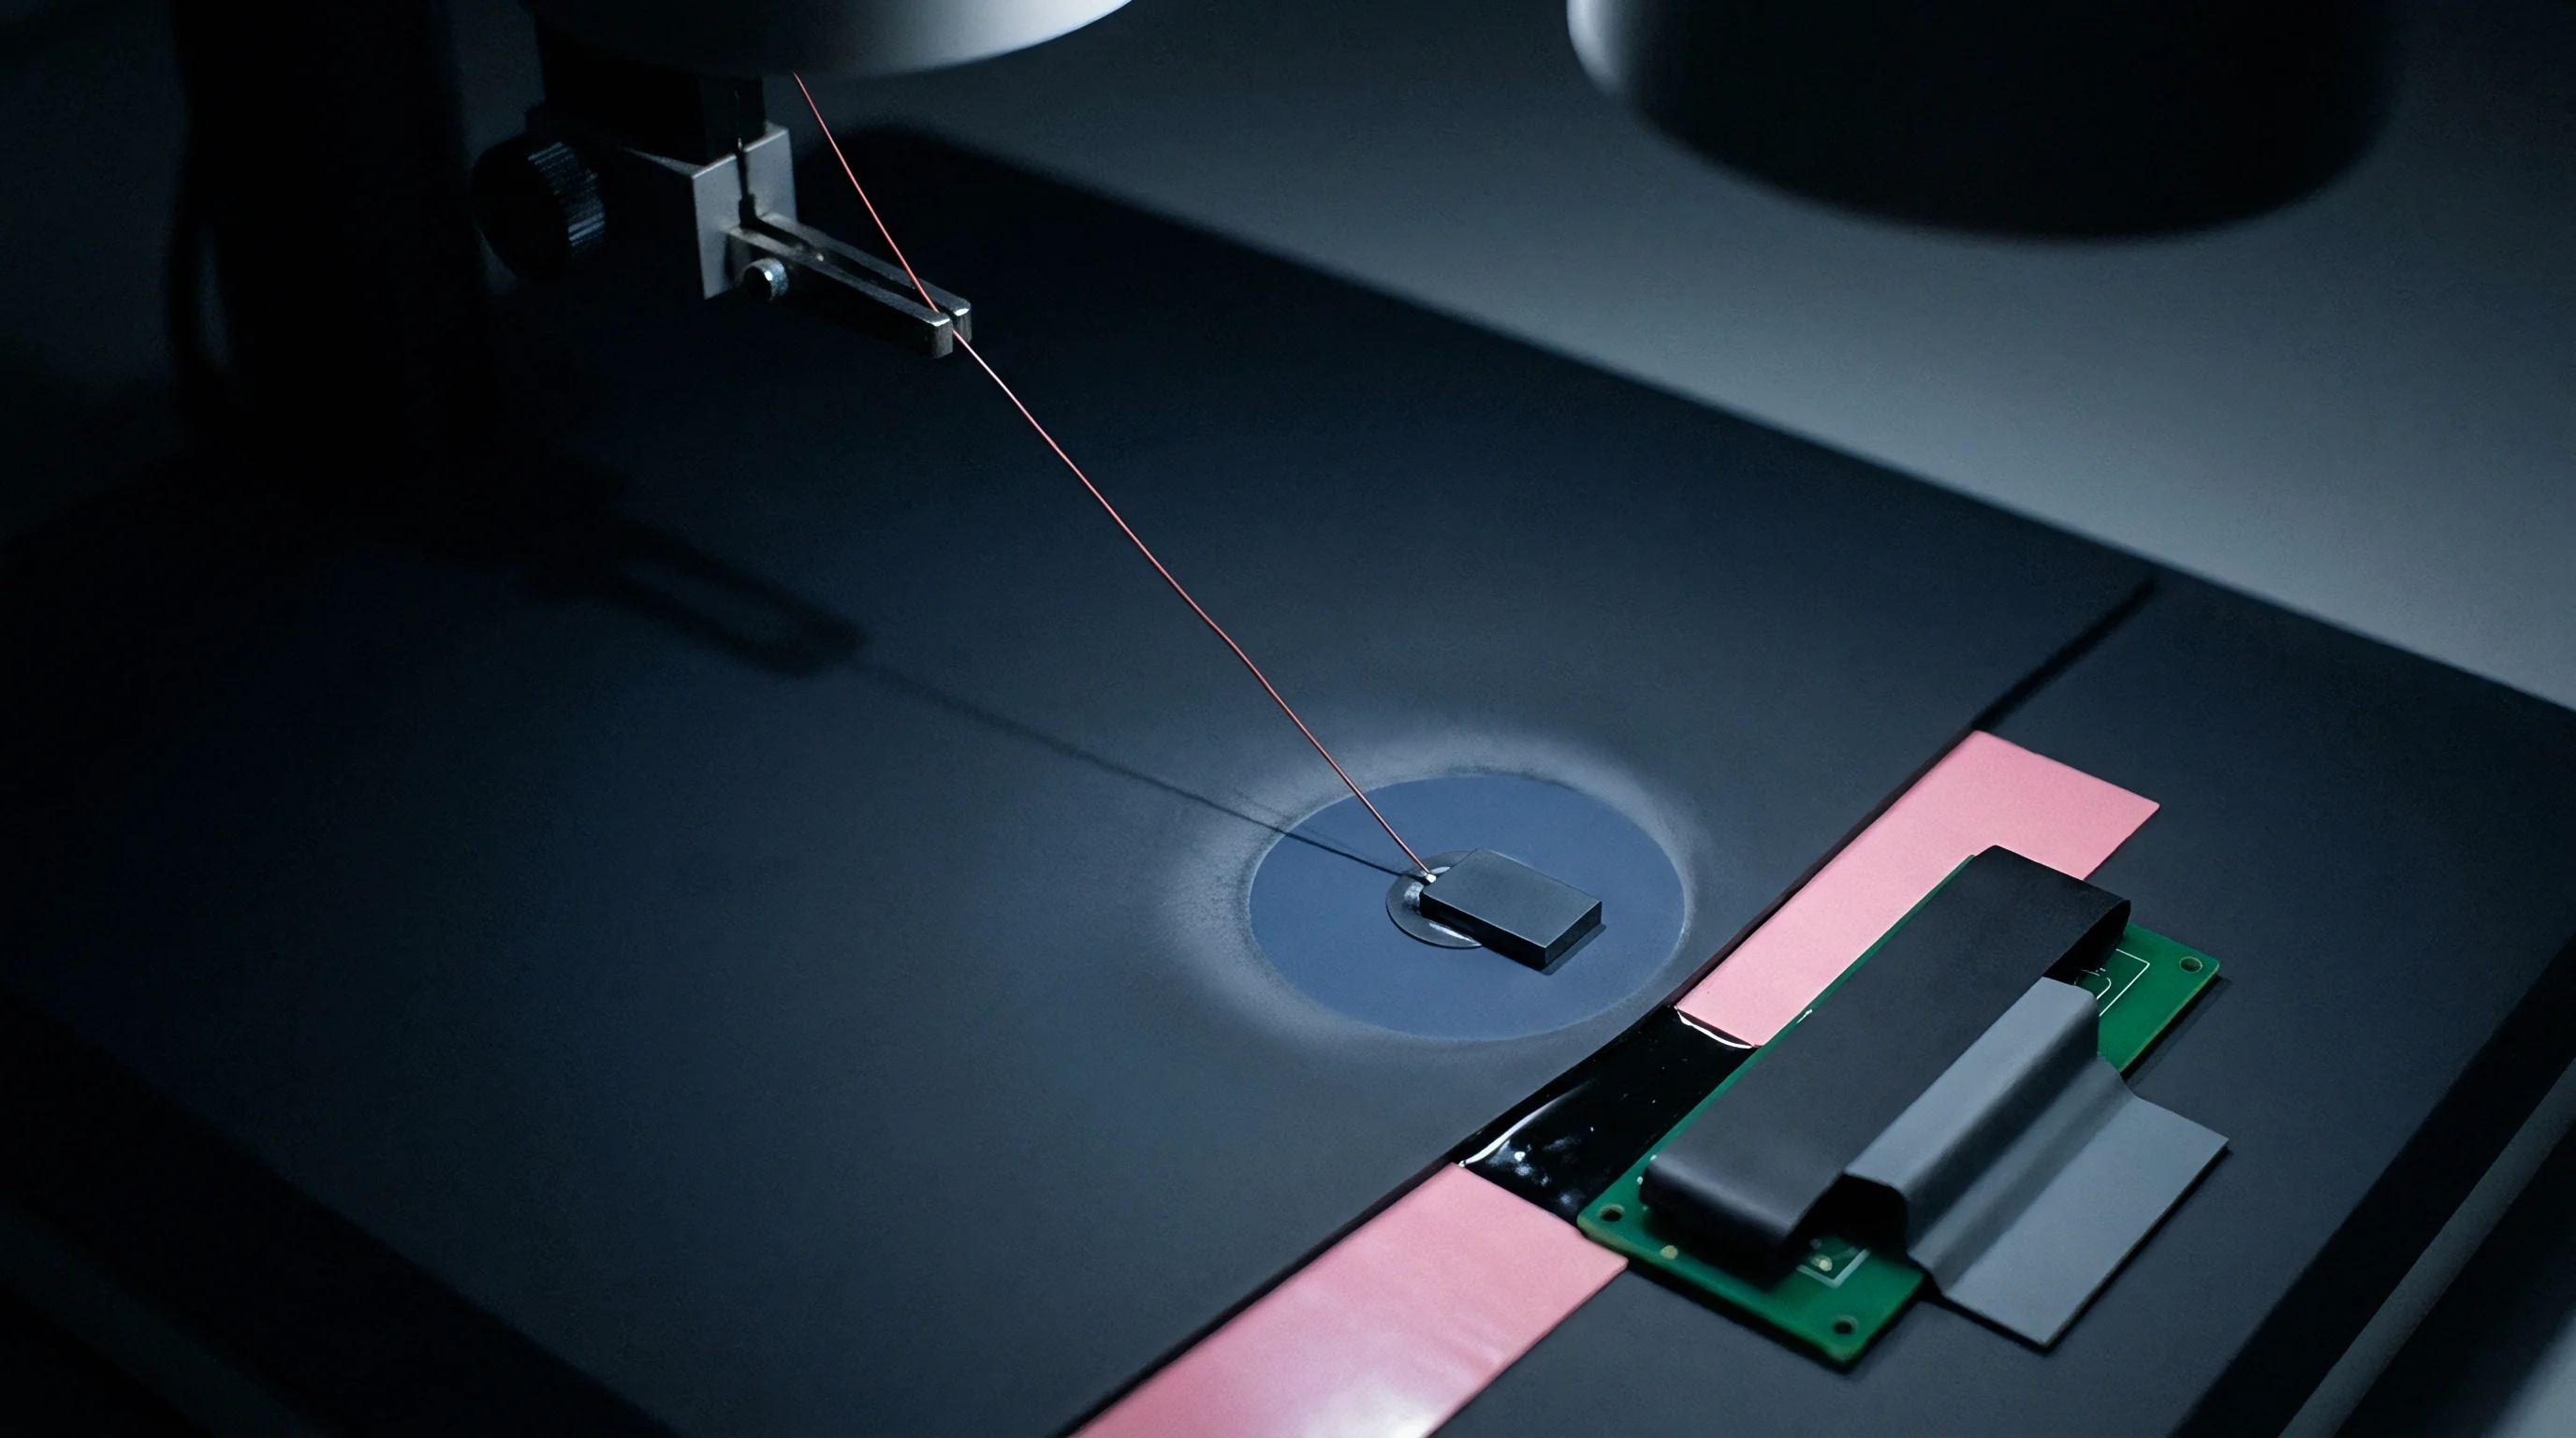
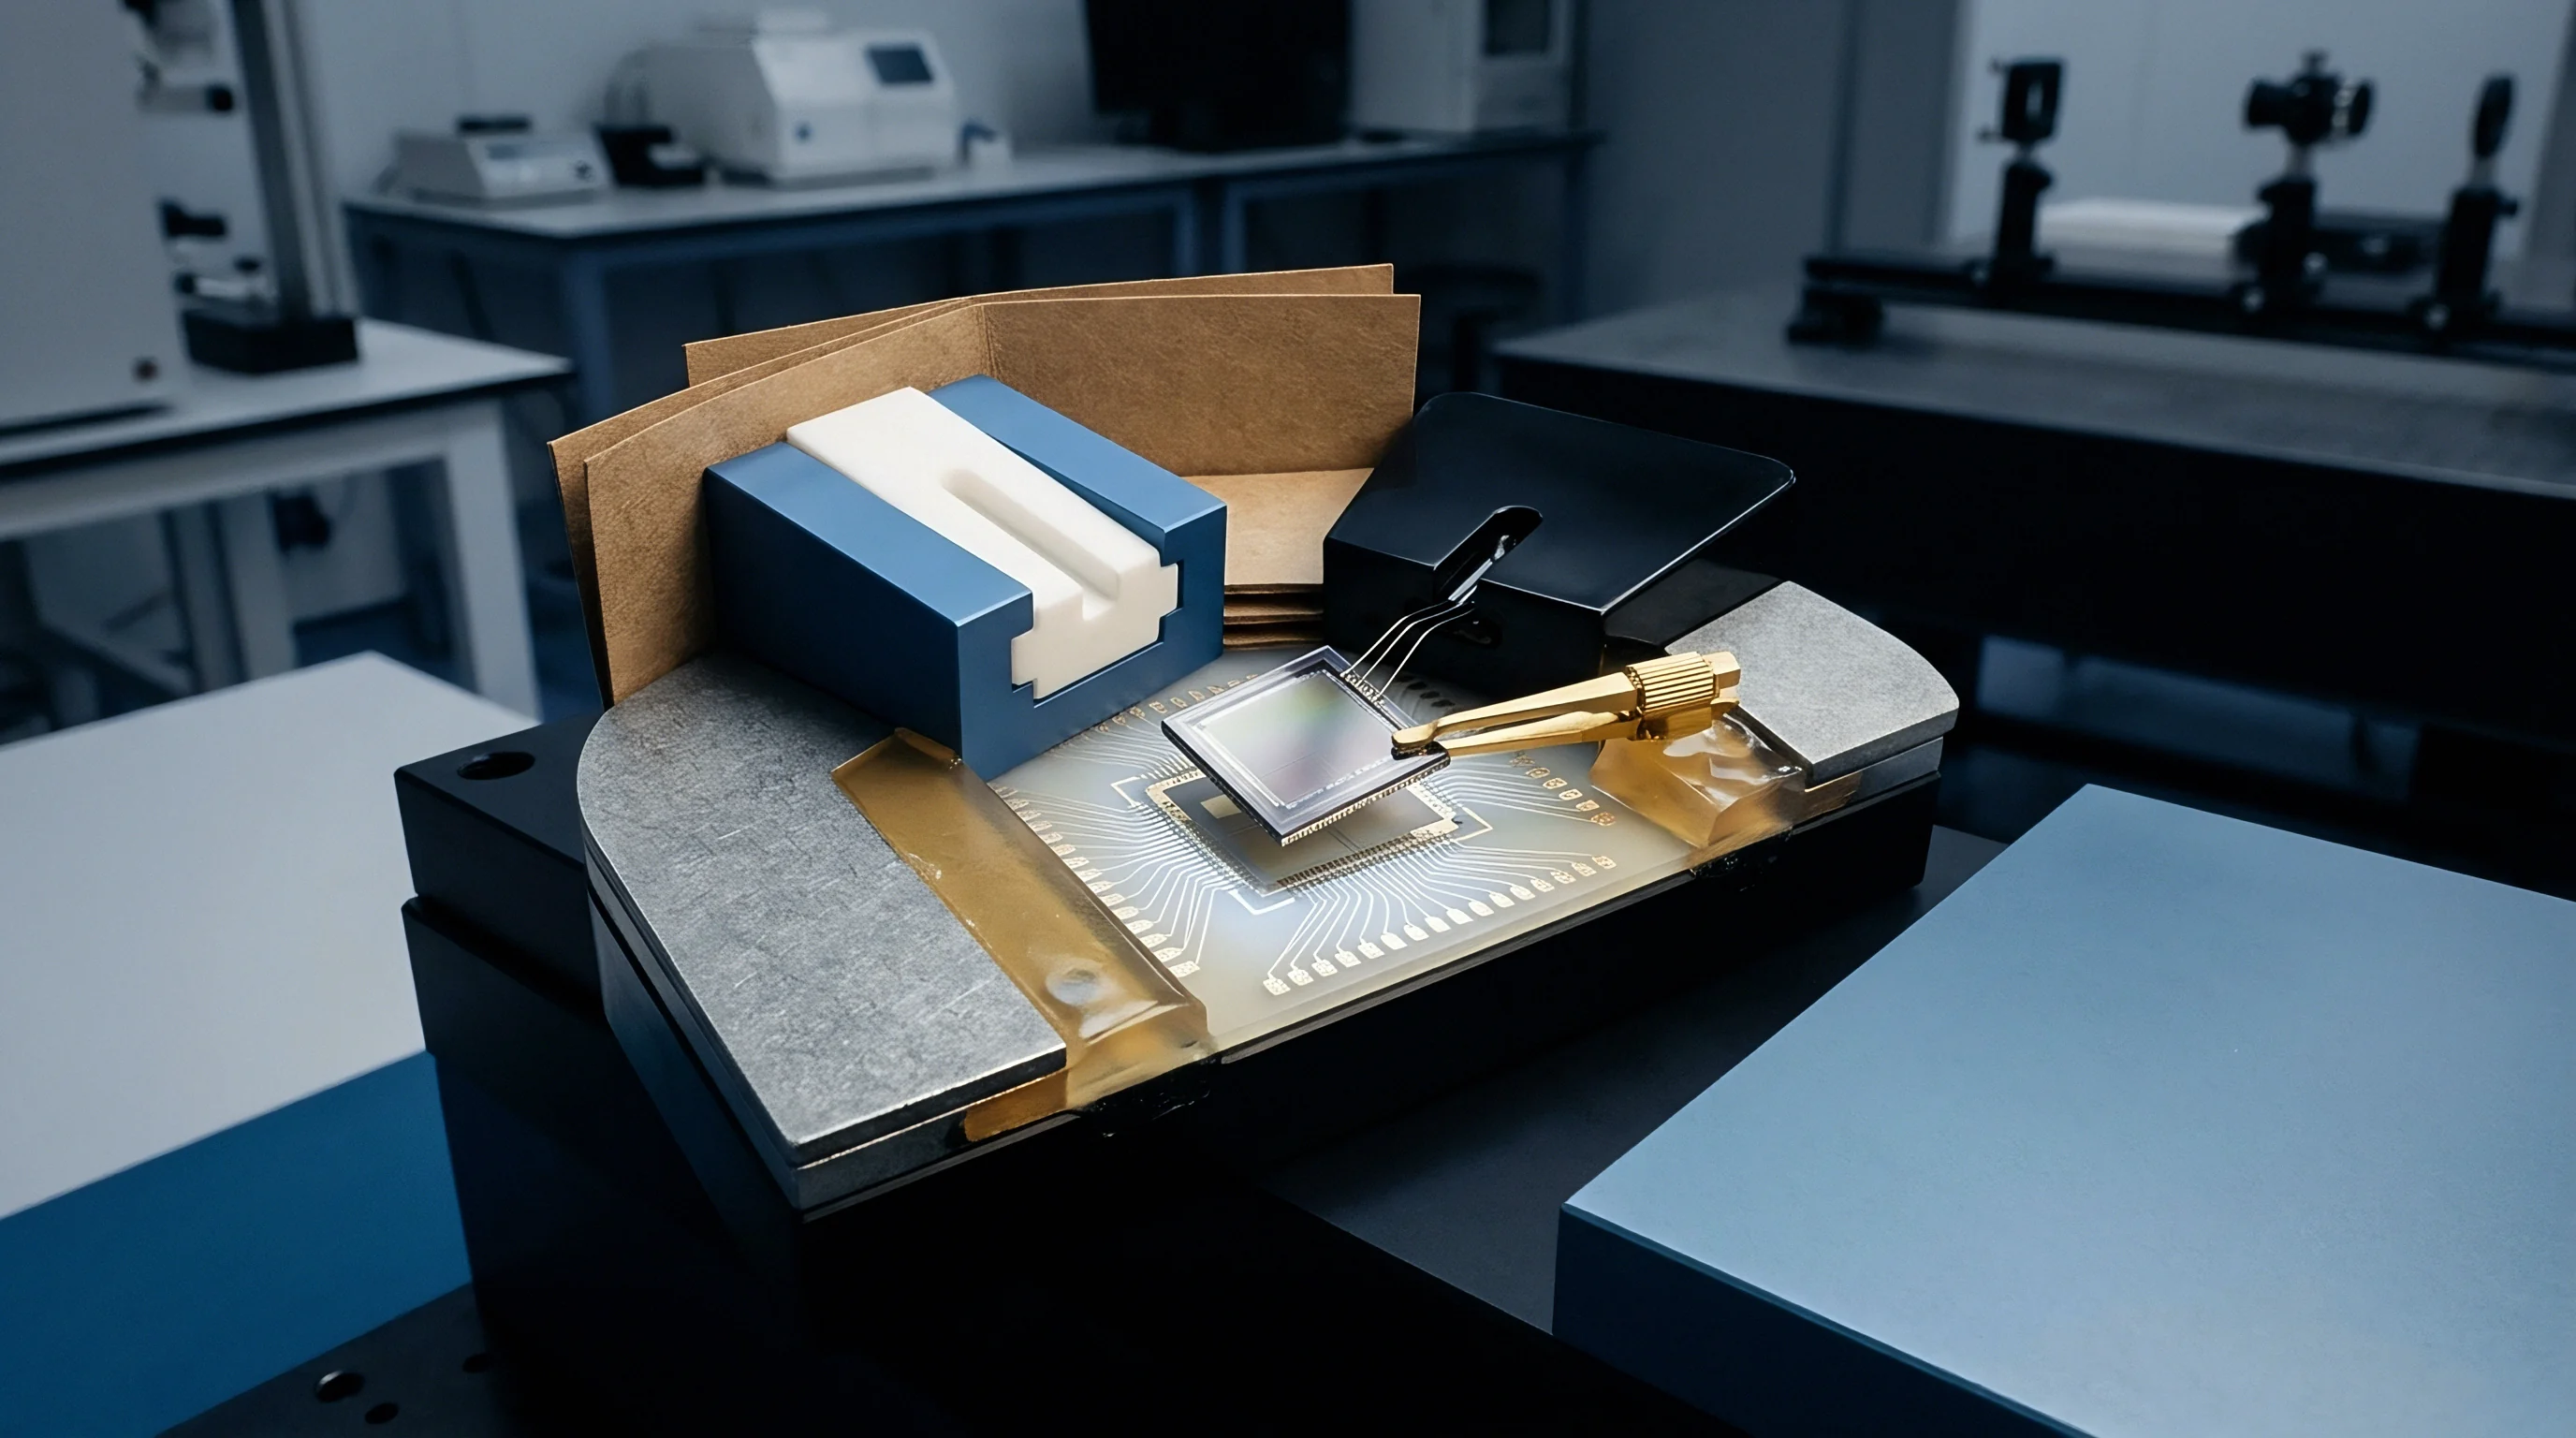
Characterizing semiconductor joint polymers requires selecting clamp geometries that match sample stiffness and physical state. Semiconductor joint layers exist as thin films or constrained layers between rigid substrates. Free-standing thin films require tension clamps, whereas bulk cured potting resins utilize dual cantilever or three-point bending fixtures.
Micro-scale die attach formulations demand miniature shear sandwich clamps to replicate the true joint loading mode.
Parasitic compliance within the test frame, clamps, and fixtures distorts the measured displacement. Because packaging polymers exhibit storage moduli between 1 and 15 gigapascals in their glassy states, specimen stiffness approaches the structural stiffness of the clamp fixtures. The true sample displacement equals the total measured displacement minus the instrument frame deflection.
Automated instrument software calibrates this frame compliance using hardened steel calibration bars of certified dimensions. If this instrument correction is omitted, measured compliance values appear artificially elevated, masking the true stiffness of the polymer.
Clamping force induces localized stress concentrations that alter viscoelastic relaxation. Excessive torque on clamp screws crushes glassy epoxy specimens, triggering premature micro-cracking and artificial mechanical damping peaks in the loss factor curve. Conversely, insufficient clamp torque allows micro-slippage between the sample face and fixture serrations, mimicking viscous creep.
Calibrated torque screwdrivers and spring-loaded self-adjusting tension fixtures prevent clamp-induced measurement artifacts across wide thermal scans.
The standard test specification ASTM D4065 establishes guidelines for dynamic mechanical measurements in plastics, defining procedures for frequency sweeping, heating rates, and baseline system calibrations to ensure inter-laboratory reproducibility.
Shift
Direct experimental measurement of viscoelastic creep over decades of operating life is commercially impractical for semiconductor packaging timelines. Product qualification cycles require life predictions spanning twenty years, whereas laboratory testing must finish within days or weeks. Time-temperature superposition provides the physical methodology to compress centuries of molecular relaxation into executable testing windows.

Master Curve Construction
Time-temperature superposition relies on the equivalence of time and temperature in accelerating molecular chain relaxation. In thermorheologically simple polymers, increasing the temperature accelerates all internal viscoelastic relaxation mechanisms by an identical scalar factor across the entire response spectrum. Dynamic mechanical sweeps performed across multiple discrete temperatures over a reachable frequency band can be horizontally shifted along a logarithmic frequency axis to construct a single continuous master curve.
Constructing this curve requires collecting frequency sweep spectra at isothermal steps spanning from deep glassy temperatures to the rubbery plateau. The engineer designates an operational reference temperature, typically 25 or 85 degrees Celsius depending on the application profile. Curves from temperatures above the reference shift rightward toward lower equivalent frequencies, exposing long-term creep behavior.
Curves from lower temperatures shift leftward, detailing high-speed dynamic loading equivalent to microsecond mechanical shock events.
A composite master curve shifts isothermal frequency sweeps across a decade-wide logarithmic axis to map mechanical properties over operational lifetimes unreachable by direct static testing.
Shift factors derived from the horizontal alignment of storage compliance curves follow specific physical laws dictated by the material state. In the glass transition region and the adjacent rubbery state up to roughly one hundred kelvins above the transition temperature, the shift factors conform to the Williams-Landel-Ferry equation. Below the glass transition, where the polymer enters a non-equilibrium glassy state with arrested free volume, relaxation kinetics diverge from Williams-Landel-Ferry dynamics and obey Arrhenius activation behavior.
Temperature Shift Formulations
The Williams-Landel-Ferry relationship links the horizontal shift factor to the operational temperature and the selected reference temperature via two empirical constants:
The material constants C1 and C2 reflect the fractional free volume and thermal expansion coefficient of free volume at the reference temperature. When the reference temperature matches the glass transition temperature, universal polymer approximations assign C1 values near 17.44 and C2 values near 51.6 kelvins, though accurate semiconductor package modeling requires measuring system-specific constants directly. In deep glassy regimes, an Arrhenius formulation governs the shift, utilizing the activation energy for sub-glass molecular relaxations, such as local phenyl group rotations or aliphatic cross-link vibrations.
Thermorheological complexity compromises the validity of time-temperature superposition. When an underfill resin incorporates multi-phase elastomer toughening agents, core-shell rubber nanoparticles, or hybrid curing systems, individual phases exhibit distinct temperature dependencies. Shifting the composite curves horizontally introduces shape distortions and erroneous plateau predictions.
Packaging engineers detect thermorheological breakdown by generating Cole-Cole plots or van Gurp-Palmen diagrams, where the loss angle is mapped directly against the complex modulus without explicitly plotting temperature. A single continuous path validates superposition; branching or hysteresis loops signal multi-phase kinetics that invalidate standard shifting routines.
Ignoring phase separation during superposition generates systematic errors: the high-temperature master curve underestimates the secondary relaxation compliance, leading directly to underestimated package warpage during solder reflow processing.


Drift
Packaging polymers undergo ongoing microstructure evolution throughout their operating lifetimes. Physical aging occurs in glassy polymers stored or operated below their glass transition temperature. Upon cooling from curing or reflow temperatures, polymers are trapped in a non-equilibrium thermodynamic state characterized by excess free volume, excess enthalpy, and elevated molecular mobility.
Over time, the cross-linked chains undergo slow structural relaxation toward an equilibrium packing density, altering their viscoelastic properties.

Microstructural Densification
Physical aging contracts the polymer network, reducing free volume and elevating mechanical stiffness. This densification shifts the relaxation time spectrum toward longer times, suppressing molecular mobility. Consequently, an underfill or die attach material ages into a more brittle, creep-resistant state.
When dynamic mechanical analysis evaluates aged versus unaged specimens, aged materials exhibit reduced creep compliance, depressed loss factor values, and shifted master curves.
To characterize this evolution, dynamic mechanical analyzers run momentary creep experiments separated by defined aging intervals. The sample is heated above its glass transition temperature to erase thermodynamic history, rapidly quenched to an aging temperature below the transition, and held isothermally. Brief creep segments, restricted to durations shorter than one-tenth of the elapsed aging time, measure the instantaneous compliance without interrupting the aging trajectory.
Plotting compliance across elapsed aging time reveals the aging shift rate, which quantifies the logarithmic deceleration of creep velocity.
Chemical Aging Interplay
Physical aging remains thermodynamically reversible via thermal rejuvenation, which involves heating the polymer above its transition temperature. However, operating conditions inside power semiconductors frequently induce irreversible chemical aging. High-temperature operational life testing drives continuous chemical transformations through post-curing, thermo-oxidative chain scission, and cross-link degradation.
Dynamic mechanical testing separates physical aging from chemical degradation through cyclic rejuvenation sweeps. When a polymer sample subjected to extensive thermal exposure is heated past its glass transition and re-tested, complete recovery of the baseline unaged compliance curve confirms that aging was purely physical. A permanent reduction in rubbery modulus or a permanent upward drift in glass transition temperature indicates chemical post-curing.
Conversely, a depressed rubbery plateau confirms polymer network degradation via chain scission. Table 2 details the diagnostic indicators derived from dynamic mechanical analysis during long-term exposure testing.
| Observed DMA Shift | Underlying Mechanism | Reversibility | Impact on Joint Integrity |
|---|---|---|---|
| Compliance drops, peak tan delta shifts right | Physical aging and free-volume loss | Reversible via heating past Tg | Increases localized thermal stresses |
| Rubbery plateau modulus increases | Post-curing of unreacted resin functional groups | Permanent chemical transformation | Elevates package warpage, hardens underfill |
| Rubbery plateau modulus drops | Thermo-oxidative backbone chain scission | Permanent chemical destruction | Promotes joint cohesive rupture, lowers fatigue life |
| Secondary beta-relaxation peak widens | Moisture plasticization along resin chain segments | Reversible via dry vacuum bake | Lowers shear yield stress, induces popcorning |
Ignoring the shift in relaxation spectrum caused by physical aging introduces significant error into structural reliability calculations. A joint model parameterized with unaged polymer properties over-predicts stress relaxation and underestimates sustained multi-axial shear stresses at joint interfaces. The interface yields when unrelaxed residual thermal stresses exceed adhesive fracture toughness.
The standard IPC-TM-650 Method 2.4.24.4 details calibration and thermal cycling routines for printed wiring board and packaging resins, outlining baseline controls for stabilizing polymeric specimens before mechanical data acquisition.


Chamber
Environmental stability inside the packaging volume governs joint reliability. Semiconductor packaging materials absorb atmospheric moisture rapidly due to the hygroscopic nature of polar epoxy, polyimide, and acrylate backbones. Moisture uptake alters the free volume of the matrix, inducing both reversible plasticization and irreversible hydrolytic degradation.
Dynamic mechanical analysis under controlled environmental conditions isolates these hygro-viscoelastic mechanisms from thermal effects.
Hygro-Mechanical Transduction Fixtures
Standard dynamic mechanical analyzers rely on liquid nitrogen or mechanical chillers operating inside convection ovens, circulating dry nitrogen gas. While ideal for isolating pure thermal transitions, this configuration misrepresents environments where packages operate in humid operating fields. Environmental dynamic mechanical analyzers incorporate relative humidity generators connected directly to sealed specimen chambers.
These systems deliver precise relative humidity steps, typically spanning 5 to 90 percent relative humidity across temperatures up to 85 degrees Celsius.
Water molecules disrupt intermolecular hydrogen bonding between polymer chains, acting as a low-molecular-weight plasticizer. This molecular shielding enhances polymer chain mobility, accelerating viscoelastic creep. When exposed to humidity steps inside the test chamber, the dynamic storage modulus of an underfill drops, while the loss factor and creep compliance increase proportionally to moisture concentration.
The apparent glass transition temperature shifts downward, an effect quantified by the empirical Fox equation or the Kelly-Bueche model for polymer-diluent mixtures.

Desorption-Driven Measurement Artifacts
Dynamic mechanical sweeps conducted in dry nitrogen chambers on pre-conditioned wet specimens produce misleading data. As the instrument heats the saturated polymer past 80 degrees Celsius, moisture desorbs rapidly from the thin test strip into the dry purge stream. The polymer matrix continuously de-plasticizes throughout the thermal scan, yielding a distorted compliance curve that reflects changing moisture content rather than true temperature dependency.
Capturing steady-state hygro-viscoelastic properties requires executing isothermal frequency sweeps inside a chamber that actively maintains ambient vapor pressure.
The coupling between temperature and humidity is expressed through the hygro-thermal shift factor. Similar to pure thermal shifting, moisture concentration can be incorporated into an extended Williams-Landel-Ferry equation, generating master compliance curves that span both time and moisture exposure. Characterizing these shifts provides the constitutive parameters required for hygro-thermo-mechanical stress analysis during moisture sensitivity level qualification testing.
The standard JEDEC J-STD-020 defines moisture sensitivity levels for non-hermetic solid-state surface mount devices, establishing the operational environmental exposures that material characterization must account for.
Suppliers frequently quote glass transition temperatures measured exclusively under bone-dry nitrogen conditions, omitting the shift caused by atmospheric equilibrium. If an automotive control package absorbs 1.5 weight percent moisture in service, its operational glass transition drops by up to 25 degrees Celsius, shifting the polymer from an elastic state into a high-compliance viscoelastic regime during engine bay thermal peaks.

Protocol
Extracting reproducible viscoelastic data from sub-millimeter polymer geometries demands strict experimental discipline. Packaging polymers rarely exist as standardized bulk specimens; they appear as thin films, low-viscosity capillary underfills cured in micro-gaps, or photolithographic die attach pastes. Developing an instrument test protocol requires establishing specimen preparation boundaries, boundary condition validation, and dynamic parameter controls.
Specimen Preparation Workflow
Specimens must be manufactured to avoid residual stresses, voids, and edge defects that distort force transduction. Thin underfill films are cast onto fluoropolymer-coated glass plates using precision doctor blades, followed by curing profiles that replicate factory reflow and box oven schedules. Bulk strips are cut to exact dimensions using slow-speed diamond saws to avoid localized heating and micro-crack formation along specimen edges.
Table 3 lists the dynamic parameter constraints necessary to preserve linear viscoelastic boundaries across specific packaging polymers.
| Material Class | Recommended Clamp Mode | Strain Amplitude Range | Heating Rate Envelope |
|---|---|---|---|
| Capillary Underfill Film | Tension Clamp | 0.01 to 0.05 percent | 1.0 to 2.0 K/min |
| Silica-Filled Mold Compound | Three-Point Bending | 0.005 to 0.02 percent | 0.5 to 1.5 K/min |
| Conductive Die Attach Paste | Dual Cantilever | 0.01 to 0.04 percent | 1.0 to 3.0 K/min |
| Non-Conductive Wafer Film | Shear Sandwich Clamp | 0.02 to 0.08 percent | 0.5 to 2.0 K/min |

Execution Sequence and Validation Checkpoints
The following sequence details the operational stages required to run a multi-temperature viscoelastic creep characterization suite:
- Specimen Geometry Measurement involves measuring sample width and thickness at three distinct positions using an optical comparator with a resolution of 1 micrometer. The mean values are recorded in the instrument software to establish accurate geometric form factors for cross-sectional area calculations.
- Clamp Mounting Alignment requires placing the specimen within the designated fixture under a stereo microscope, ensuring alignment with the axial motion vector of the drive shaft. The mounting screws are secured incrementally using a calibrated micro-torque wrench set to factory specifications to eliminate clamping pre-strains.
- Dynamic Strain Sweep Interrogation is conducted across an amplitude range spanning from 0.001 to 0.2 percent strain at a fixed frequency of 1 hertz. The upper linear viscoelastic limit is identified as the exact strain value where the storage modulus deviates by more than two percent from its low-amplitude baseline.
- Equilibrium Isothermal Thermal Soaks are maintained at every testing step across the programmed thermal envelope, providing a minimum five-minute dwell after the specimen thermocouple stabilizes within 0.1 kelvins of the setpoint. This soak guarantees uniform temperature across the cross-section before applying oscillatory loads.
- Multi-Frequency Sweeps apply discrete oscillation steps at 0.1, 0.3, 1.0, 3.0, 10, and 30 hertz at each stabilized temperature plateau. The displacement transducer captures the phase shift angle and dynamic force, calculating real-time storage modulus, loss modulus, and loss tangent values.
- Linear Creep Hold Execution is initiated immediately after the dynamic sweep at the target thermal plateau by applying a constant static stress level within the previously verified linear regime for two hours. The optical linear encoder records continuous strain progression to capture primary and secondary viscoelastic creep compliance.
A supplier who submits compliance parameters derived from thermal ramp speeds exceeding three degrees per minute introduces thermal lag errors that shift the apparent glass transition upward by up to ten kelvins. High ramp rates create internal temperature gradients between the sample core and surface, invalidating phase shift calculations and yielding artificially high storage modulus readings in the transition zone.

Qualification
Integrating viscoelastic creep measurements into high-reliability qualification requires transforming dynamic mechanical spectra into quantitative acceptance criteria. Joint polymers utilized in automotive, telecommunications, and aerospace modules are governed by long-term qualification standards that define acceptable deformation ceilings under continuous thermal and vibrational stress.
Parametric Acceptance Thresholds
Specifying a packaging polymer requires establishing parametric limits for creep compliance, glass transition stability, and activation energy. Procurement documentation must mandate not only a nominal room-temperature modulus, but also a maximum allowable creep compliance value at the operating temperature limit. Table 4 details standard dynamic mechanical parameters utilized during automotive package qualification according to AEC-Q100 and AEC-Q104 guidelines.
| Performance Parameter | Test Condition | Acceptance Boundary | Governing Standard |
|---|---|---|---|
| Creep Compliance D(t) at 1000s | 125 deg C, 5 MPa static stress | < 0.85 GPa^-1 | ASTM D2990 / DMA Equivalent |
| Storage Modulus Retention | 150 deg C vs 25 deg C, 1 Hz sweep | > 8.0 percent retention | ASTM D4065 |
| Loss Tangent Peak Temperature | 1 Hz oscillation, 1 K/min ramp | Tg > 145 deg C | IPC-TM-650 Method 2.4.24.4 |
| Aging Shift Rate Metric | 100 deg C soak, 500 hours | mu > 0.75 | Internal Tier-1 Material Specification |
Worked Packaging Compliance Evaluation
The real-world significance of compliance boundaries becomes clear when evaluating an adhesive formulation under package assembly conditions. Assume an automotive ball grid array module experiences an operational shear stress of 8 megapascals across its perimeter underfill joints during highway driving cycles. The ambient under-hood temperature stabilizes at 115 degrees Celsius.
The packaging engineering team must verify whether the selected underfill material will exceed an accumulated shear strain threshold of 1.5 percent over an expected 3000-hour cumulative engine run time.
The candidate underfill material exhibits a room-temperature storage modulus of 7.2 gigapascals. Multi-temperature dynamic mechanical testing produces a Prony series representation with an instantaneous compliance J0 of 0.14 inverse gigapascals. The short-term relaxation modes relax during the initial 10 hours of operation, leaving the long-term retarded compliance mode, which is characterized by a retardation time tau of 1200 hours and a partial compliance J1 of 0.85 inverse gigapascals.
Applying the constitutive creep equation for a single-mode Kelvin-Voigt element under constant stress yields:
At 3000 hours of continuous operation, the bracketed relaxation term yields one minus exp of negative 3000 divided by 1200, which evaluates to one minus exp of negative 2.5, equalling 0.9179. Multiplying this factor by the partial compliance of 0.85 inverse gigapascals gives 0.7802 inverse gigapascals. Adding the instantaneous compliance of 0.14 inverse gigapascals produces a total creep compliance of 0.9202 inverse gigapascals at the 3000-hour milestone.
Multiplying this compliance by the applied shear stress of 8 megapascals (0.008 gigapascals) gives the total accumulated shear strain:
The resulting accumulated shear strain evaluates to 0.00736, or 0.736 percent. Because this calculated value remains well below the maximum allowable strain boundary of 1.5 percent, the packaging configuration passes the dimensional drift qualification requirement. If dynamic mechanical analysis had indicated a partial compliance J1 exceeding 1.8 inverse gigapascals under identical conditions, the total strain would have exceeded the 1.5 percent ceiling, precipitating bump micro-cracking and joint delamination during life testing.
A qualification dossier lacks validity if dynamic mechanical spectra fail to detail clamp compliance calibrations, actual sample dimensions, and the verified linear viscoelastic limit. The material changes shape under mechanical stress; the instrument must measure that evolution without adding its own structural deflection to the data.