Quantifying Thermal Hysteresis Drift in Industrial Pressure Transducers
Thermal hysteresis drift is quantified by measuring unrecoverable zero return offset at ambient reference after standardized thermal cycling under IEC 61298-2.

Heat
Thermal cycling exposes structural misalignments between joined metals, braze alloys, and sensing substrates inside pressure cell assemblies. When an industrial transmitter returns to reference ambient temperature following exposure to an elevated thermal envelope, the output voltage or current rarely matches the initial zero point. The non-reversing fraction of this balance offset represents thermal hysteresis drift.
Commercial factory calibrations frequently mask this behavior by taking static measurements at discrete setpoints during a single ascending sweep. Operating facilities encounter the consequence when steam cleaning cycles or seasonal temperature excursions leave pressure readings elevated by several tenths of a percent, even after line temperatures return to twenty degrees Celsius.
Silicon piezoresistors drift under shear. In an oil-filled isolated piezoresistive transducer, silicon oil transmits hydraulic pressure from an external isolation diaphragm to a micromachined silicon die. Differential thermal expansion between the silicon chip, the borosilicate glass pedestal, and the metallic header creates lingering mechanical stress.
Sputtered thin-film sensors show different behavior. Deposition of dielectric and resistive films directly onto a metallic diaphragm eliminates adhesive layers, yielding lower return offsets. Ceramic capacitive designs utilize aluminum oxide plates bonded with glass frit.
These structures provide excellent elastic recovery, yet the seal ring remains vulnerable to micro-yielding under extreme thermal rate changes.
A 100-bar piezoresistive transducer exposed to six thermal cycles from minus 20 to plus 85 degrees Celsius retains a residual zero offset of 0.18 percent of full scale at 20 degrees Celsius.
Mechanical Origins across Sensing Technologies
Thermal stress accumulates along internal joints at predictable rates depending on the sensor architecture. Elastic mismatch between adjoining materials forces micro-slippage at grain boundaries, shifting the baseline bridge resistance permanently or quasi-permanently. In bonded foil strain gauge units, organic bonding cements undergo viscoelastic deformation when heated under pressure, preventing full return to geometric equilibrium.
Ceramic cells resist plastic deformation, yet the gold or glass perimeter joints absorb localized shear strains. Thin films hold tighter margins. Sputtered metal films resist relaxation.
| Transducer Cell Architecture | Typical Hysteresis Error (% Span) | Thermal Operating Envelope (°C) | Dominant Mechanical Drift Source | Zero Return Time Constant (Hours) |
|---|---|---|---|---|
| Isolated Piezoresistive Silicon | 0.10 to 0.35 | -40 to +125 | Oil expansion and header braze shear | 4.0 to 12.0 |
| Sputtered Thin-Film Stainless | 0.03 to 0.08 | -40 to +150 | Substrate grain boundary slip | 0.5 to 2.0 |
| Ceramic Capacitive (Al2O3) | 0.04 to 0.12 | -20 to +100 | Glass seal frit micro-yielding | 1.5 to 4.5 |
| Bonded Semiconductor Gauge | 0.25 to 0.60 | -10 to +80 | Adhesive matrix viscoelastic relaxation | 8.0 to 24.0 |
Reversible Shift versus Permanent Zero Wander
Distinguishing temporary stabilization delays from genuine physical drift requires controlled dwell periods. When temperature stabilizes, internal components normalize at different conduction rates. An oil-filled capsule creates a transient volumetric gradient that simulates hysteresis until the fill reaches thermal equilibrium.
True thermal hysteresis drift persists after hours of ambient stabilization. Zero shift dominates span wander. Pressure range expansion also changes slightly, yet zero balance offsets account for roughly eighty percent of total thermal return error in industrial transmitters.
Transducer vendors often explain residual offsets away by claiming the observed output shift represents predictable packaging settling that disappears after initial commissioning.
Loop
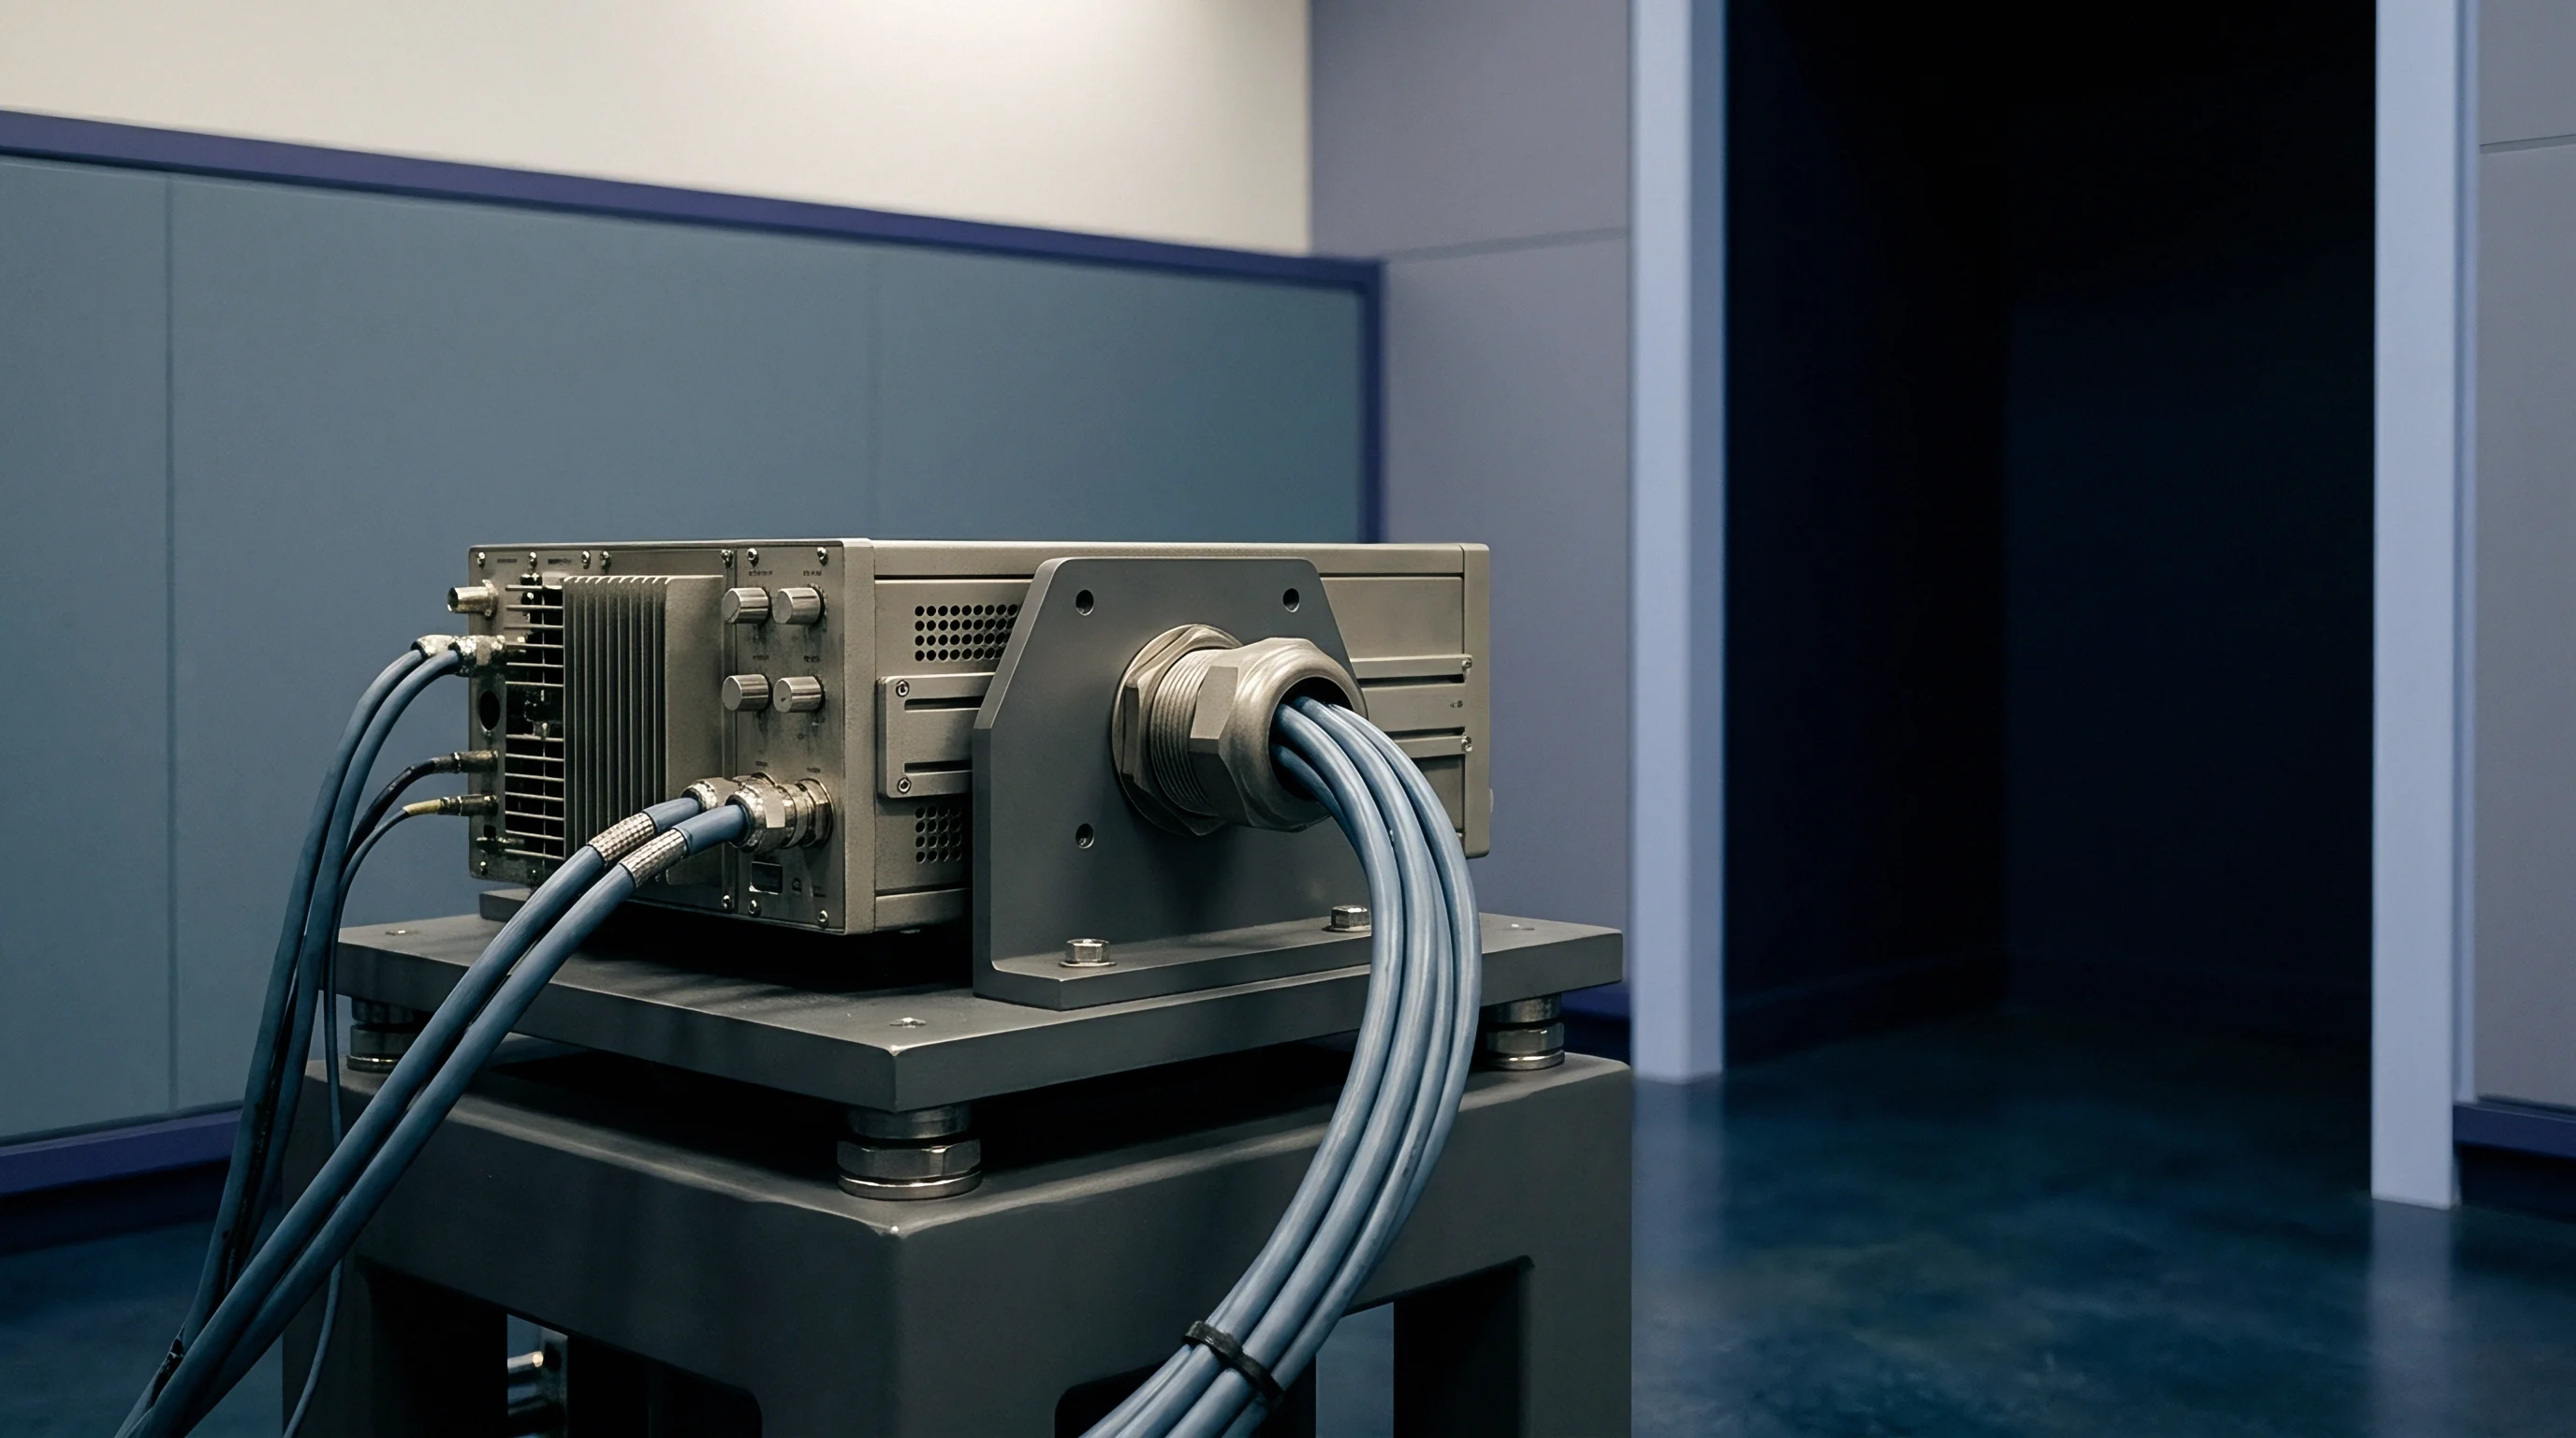
Quantifying thermal hysteresis requires an environmental test enclosure capable of steady temperature regulation alongside deadweight pressure references. Standard laboratory assessments execute thermal loops spanning the manufacturer operating limits, typically cycling between minus twenty, room reference, and plus eighty-five degrees Celsius. IEC 61298-2 provides baseline testing parameters for evaluating the influence of temperature variations on process instrumentation.
The standard specifies a sequence of stepped thermal levels, recording output values across ascending and descending thermal runs. Thermal creep distorts pressure diaphragms.
Clause 6.4 of IEC 61298-2 stipulates that thermal equilibrium exists only when successive output readings over a fifteen-minute interval shift by less than one-fifth of the device accuracy class.

Can Thermal Cycling Separate Creep from Hysteresis?
Environmental chambers introduce combined environmental stresses that challenge clear separation between pure temperature cycling effects and steady-state pressure creep. Isolating the thermal return component demands running the entire temperature excursion at atmospheric pressure before evaluating the loaded transducer under pressure. An unloaded cycle exposes purely thermally induced mechanical shifting in the sensor housing.
Dwell times alter balance points. Sputtered designs show fast recovery, whereas oil-filled cavities exhibit lengthy relaxation curves.
| Test Profile Stage | Chamber Setpoint (°C) | Dwell Duration (Hours) | Applied Pressure Points (% Span) | Measurement Target |
|---|---|---|---|---|
| Baseline Ambient Reference | +20 ± 1 | 2.0 | 0, 20, 40, 60, 80, 100 | Initial linearity and zero reference |
| Negative Excursion | -20 ± 1 | 3.0 | 0, 50, 100 | Cold span shift and cold zero balance |
| Cold Return Reference | +20 ± 1 | 3.0 | 0, 20, 40, 60, 80, 100 | Low-temperature return hysteresis |
| Elevated Excursion | +85 ± 1 | 4.0 | 0, 50, 100 | Hot span shift and hot zero balance |
| Final Ambient Reference | +20 ± 1 | 4.0 | 0, 20, 40, 60, 80, 100 | Complete cycle thermal hysteresis drift |
Soak Times and Profile Constraints
Thermal gradients across the sensor body generate misleading hysteresis data when soak times remain too short. External stainless steel process connections absorb heat slowly compared to internal electronic boards, creating internal thermal voltages across bridge connections. The verification process follows a strict execution path to prevent thermal gradients from corrupting hysteresis quantification.
- Mount the transducer inside the environmental chamber, connecting electrical signal leads to an isolated precision multimeter and the process port to an automated gas controller.
- Stabilize the test chamber at twenty degrees Celsius for two hours, taking baseline voltage readings at zero gauge pressure and at full scale.
- Ramp the thermal chamber to minus twenty degrees Celsius at a controlled rate of one degree Celsius per minute.
- Maintain the negative thermal plateau for three hours, ensuring internal transducer equilibrium prior to capturing pressure response curves.
- Return the chamber to room ambient at the same controlled rate, allowing a three-hour soak before logging the cold-cycle zero return error.
- Ramp the chamber to eighty-five degrees Celsius, maintaining dwell conditions for four hours to measure elevated temperature zero and span behavior.
- Cool the chamber back to twenty degrees Celsius, completing the full thermal cycle and recording the final zero displacement.
A purchase agreement incorporating DIN 16086 Section 4.3 obligates the supplier to document thermal zero shift across complete ascending and descending thermal cycles rather than isolated temperature coefficients.

Budget
Formulating a defensible uncertainty balance for thermal hysteresis drift requires tracing every electrical, pressure, and thermal variance back to standard reference values. The thermal return error is computed as the difference in output at reference temperature between the initial state and the post-cycling state, divided by the span. Isolating this metric from ambient barometric shifts, chamber fluctuation, and reference controller instability demands rigorous mathematical treatment.
Diaphragm materials with mismatched expansion coefficients convert ambient temperature swings into permanent mechanical zero shifts.
Isolation of Temperature Coefficients
Temperature coefficients of zero and span describe the instantaneous derivative of output with respect to temperature. Thermal hysteresis drift represents the path-dependent path integral that fails to close upon cycle completion. Oil filling expands nonlinearly.
The mathematical quantification separates the total observed shift into predictable temperature coefficients and unrecoverable hysteresis drift:
D_total(T) = Alpha_0 (T – T_ref) + Beta_0 (T – T_ref)^2 + E_th_hyst
In this relationship, Alpha_0 and Beta_0 describe reversible linear and quadratic thermal zero coefficients. The term E_th_hyst designates the path-dependent thermal hysteresis offset. Evaluating E_th_hyst across multiple thermal loops reveals whether the shift compounds or plateaus.
Sputtered thin-film sensors demonstrate rapid plateauing, whereas elastomeric sealed assemblies continue to drift with each consecutive loop.
Calculating the measurement uncertainty of E_th_hyst involves identifying standard uncertainty contributors across the measurement chain:
- Chamber Temperature Stability introduces variation through thermal fluctuations around the sensor casing during dwell periods, mapped through a rectangular distribution divisor of square root three.
- Pneumatic Controller Precision creates reference line deviation, governed by the primary calibration deadweight standard uncertainty with a normal distribution coverage factor of two.
- Digital Multimeter Linearity affects bridge voltage readout resolution, introducing residual quantization uncertainty across microvolt signals.
- Barometric Reference Drift alters gauge pressure baselines, forcing laboratory instrumentation to implement absolute pressure tracking or continuous barometric compensation.
- Transducer Self Heating alters internal bridge temperatures independently from environmental chamber controls, adding a one-sided systematic thermal bias.
Combined Measurement Uncertainty Formulations
Consider a 10-bar industrial thin-film pressure transducer characterized across a temperature loop from 20 to 85 degrees Celsius and back to 20 degrees Celsius. The transducer full scale span equals 10.000 V direct current. Upon return to 20 degrees Celsius after a four-hour soak, the zero output shifts from 0.0002 V to 0.0058 V. The observed thermal hysteresis drift calculation yields:
E_th_hyst = (0.0058 V – 0.0002 V) / 10.0000 V 100% = 0.056% Span
Evaluating the credibility of this 0.056 percent reading demands quantifying the combined expanded uncertainty of the measurement system under standard Guide to the Expression of Uncertainty in Measurement procedures. Two soak cycles expose creep. Brazed joints outlast adhesive layers.
| Uncertainty Source | Estimate Value | Probability Distribution | Divisor | Sensitivity Coefficient | Standard Uncertainty (% Span) |
|---|---|---|---|---|---|
| Chamber Temperature Setpoint (±0.2 °C) | 0.004 % Span | Rectangular | 1.732 | 1.0 | 0.0023 |
| Pneumatic Reference Standard | 0.005 % Span | Normal | 2.000 | 1.0 | 0.0025 |
| Multimeter Readout (0.1 µV) | 0.001 % Span | Rectangular | 1.732 | 1.0 | 0.0006 |
| Barometric Pressure Variation | 0.008 % Span | Rectangular | 1.732 | 1.0 | 0.0046 |
| Internal Transducer Self-Heating | 0.003 % Span | Normal | 1.000 | 1.0 | 0.0030 |
| Combined Standard Uncertainty (Root Sum Square) | — | Normal | — | — | 0.0065 |
Combining these contributions via root-sum-square calculation produces a standard combined uncertainty of 0.0065 percent of span. Applying a coverage factor of two yields an expanded uncertainty of 0.013 percent of span at a ninety-five percent confidence interval. The quantified thermal hysteresis drift stands at 0.056 ± 0.013 percent of span.
The measured drift comfortably exceeds system noise, verifying that the observed return error stems from structural mechanics rather than test bench variability.


Fleet
Production populations show considerable dispersion in thermal return behavior due to manufacturing variances. Lot-to-lot differences in brazing thickness, diaphragm welding heat input, and silicon glass frit adhesion cause identical part numbers to exhibit diverging hysteresis magnitudes. An incoming inspection sampling plan must account for this spread.
Ceramic membranes show lower wander. Uncompensated zero offset shifts calibration.
Factory certificates quoting thermal error bands without stating prior cycle history mask the true drift rate of the installed transducer.
Dispersion Metrics across Production Lots
Evaluation of fifty pressure transducers drawn from three production lots reveals a skewed Weibull distribution rather than a Gaussian bell curve. Transducers with minimal residual packaging stresses cluster near 0.03 percent span drift, while units with excessive braze accumulation or uneven solder distribution extend past 0.15 percent span. Thermal cycling relieves packaging stress.
In high-reliability applications, suppliers run intentional thermal burn-in cycles to cull devices sitting in the high-drift tail of the population.
- Braze Alloy Voids generate asymmetric mechanical strain fields across the sensor pedestal, producing thermal hysteresis figures three times higher than the lot median.
- Diaphragm Weld Shrinkage introduces compressive baseline stress into the sensing membrane, causing irreversible buckle modes under sudden temperature changes.
- Silicone Oil Cavity Fill Variance alters internal hydraulic compliance, shifting volumetric thermal expansion curves between manufacturing batches.
- Wire Bond Loop Tension shifts contact resistance under thermal expansion, injecting deceptive electrical return offsets into the measurement bridge.
Longitudinal Stability over Multi-Year Cycles
Transducers subjected to recurring process temperature variations over multiple operating seasons show progressive drift accumulation. In petrochemical refining and power generation systems, thermal cycling repeats hundreds of times annually. Sputtered thin-film sensors typically stabilize after fifteen to twenty cycles as internal dislocations pin themselves against grain boundaries.
Oil-filled piezoresistive cells can continue to exhibit progressive zero shifts over years of service due to slow seal degradation. The rate of accumulation dictates maintenance schedules and recalibration planning.
Whether prolonged exposure to elevated operating temperatures eventually resets the internal stress state or permanently damages the sensing joint remains an active concern for plant metrology teams.

Settlement
Specifying thermal performance without incorporating hysteresis requirements leaves industrial buyers unprotected against drifting field populations. Datasheets frequently advertise total accuracy or thermal error bands based solely on static temperature coefficient formulas. Procurement dossiers must define the maximum permissible thermal hysteresis drift following a defined number of temperature cycles.
Rejection thresholds protect plant uptime. Field recalibration costs accumulate rapidly.
Procurement Specifications and Factory Screening
Sourcing engineers eliminate field-drifting units by demanding certified thermal cycling data as a deliverable condition. A well-constructed purchase order specifies both the temperature range and the allowable return offset following ambient recovery. Specifying a thermal burn-in screen shifts stabilization costs to the supplier.
Transmitters destined for thermal swing applications must endure pre-conditioning cycles before baseline factory calibration.

Recalibration Intervals and Lifecycle Economics
Transducers exhibiting unquantified thermal hysteresis force plants into compressed recalibration intervals. An instrument drifting 0.2 percent of span per quarter requires quarterly technician dispatches to perform zero trimming. In a processing facility operating five hundred pressure points, technician labor and production downtime quickly outpace initial procurement savings.
Investing in low-hysteresis sputtered thin-film or precision ceramic transmitters lowers ownership costs over a three-year operating horizon.
Selecting transmitters solely on published linear temperature coefficients while ignoring cycle return hysteresis leads directly to unbudgeted calibration visits, product quality disputes, and unscheduled unit shutdowns.