Establishing Measurement Traceability Chains for Industrial Pressure Transducers
Establishing pressure traceability requires calculating complete uncertainty budgets and enforcing accredited test ratios to prove sensor claims.
Origin
Measurement integrity depends on an unbroken hierarchy linking an industrial sensor to national metrological standards. The Pascal represents one Newton per square meter, derived directly from primary physical constants of mass, length, and time. Industrial pressure transducers operating in manufacturing lines, hydraulic skids, and custody transfer stations do not directly contact these absolute primary standards.
Instead, mechanical pressure transfer relies on a disciplined cascade where each descending level accepts a higher uncertainty bound to make calibration practically achievable and commercially viable.
Primary Standards and Piston Gauges
Primary pressure realization relies on deadweight testers, also designated as pressure balances. These instruments generate reference pressure by suspending calibrated weights of known mass over a precision-machined piston-cylinder assembly of measured effective area. Mass values require local gravity correction.
Local gravitational acceleration varies by location, altering force calculations if uncorrected. Piston area changes under strain. High fluid pressure expands the cylinder and compresses the piston, requiring explicit thermal and elastic deformation corrections.
National Metrology Institutes maintain primary deadweight testers operating in temperature-controlled environments with fractional uncertainties below 0.001 percent of reading. Primary standards calibrate secondary transfer standards, typically high-precision quartz Bourdon tube gauges or secondary pressure balances, which accredited laboratories utilize to calibrate working standards.
ISO/IEC 17025 Clause 6.5.2 requires accredited calibration laboratories to maintain traceability to the International System of Units through an unbroken chain of valid calibrations.
Transfer Chains to the Factory Bench
Working standards travel from accredited secondary laboratories to manufacturing facilities and field calibration benches. Uncertainty accumulates at every transfer. A primary deadweight tester operating at 0.001 percent uncertainty transfers its calibration to a secondary transfer gauge rated at 0.008 percent uncertainty.
That gauge subsequently calibrates a digital pressure calibrator rated at 0.025 percent full scale span. The industrial pressure transducer sitting on a process line receives calibration against this digital calibrator, reaching an end-of-chain expanded uncertainty of 0.1 percent to 0.25 percent full scale span.
| Calibration Level | Reference Apparatus | Typical Expanded Uncertainty | Primary Transfer Mechanism | Recalibration Cycle |
|---|---|---|---|---|
| Primary National Standard | Mass-Loaded Deadweight Balance | 0.0005% to 0.0015% of reading | Direct dimensional and mass comparison | 120 Months |
| Accredited Working Standard | High-Precision Quartz Bourdon Gauge | 0.005% to 0.015% of reading | Controlled pneumatic cross-floating | 24 Months |
| Industrial Bench Standard | Automated Digital Pressure Calibrator | 0.02% to 0.05% of full scale | Piezoresistive force balance manifold | 12 Months |
| Field Pressure Transducer | Piezoresistive or Thin-Film Sensor | 0.10% to 0.50% of full scale | Direct analog or digital signal loop | 12 Months |
The operational validity of this structure rests on holding a Test Uncertainty Ratio of at least four to one at each calibration tier. When the reference standard lacks a four-fold accuracy advantage over the device under test, false acceptance risks rise sharply, corrupting process data across downstream operations.
Purchasing agreements specify metrological traceability through documentation referencing ISO/IEC 17025 accreditation scopes, explicitly prohibiting unaccredited internal factory adjustments from serving as valid proof of calibration history.

Manifold
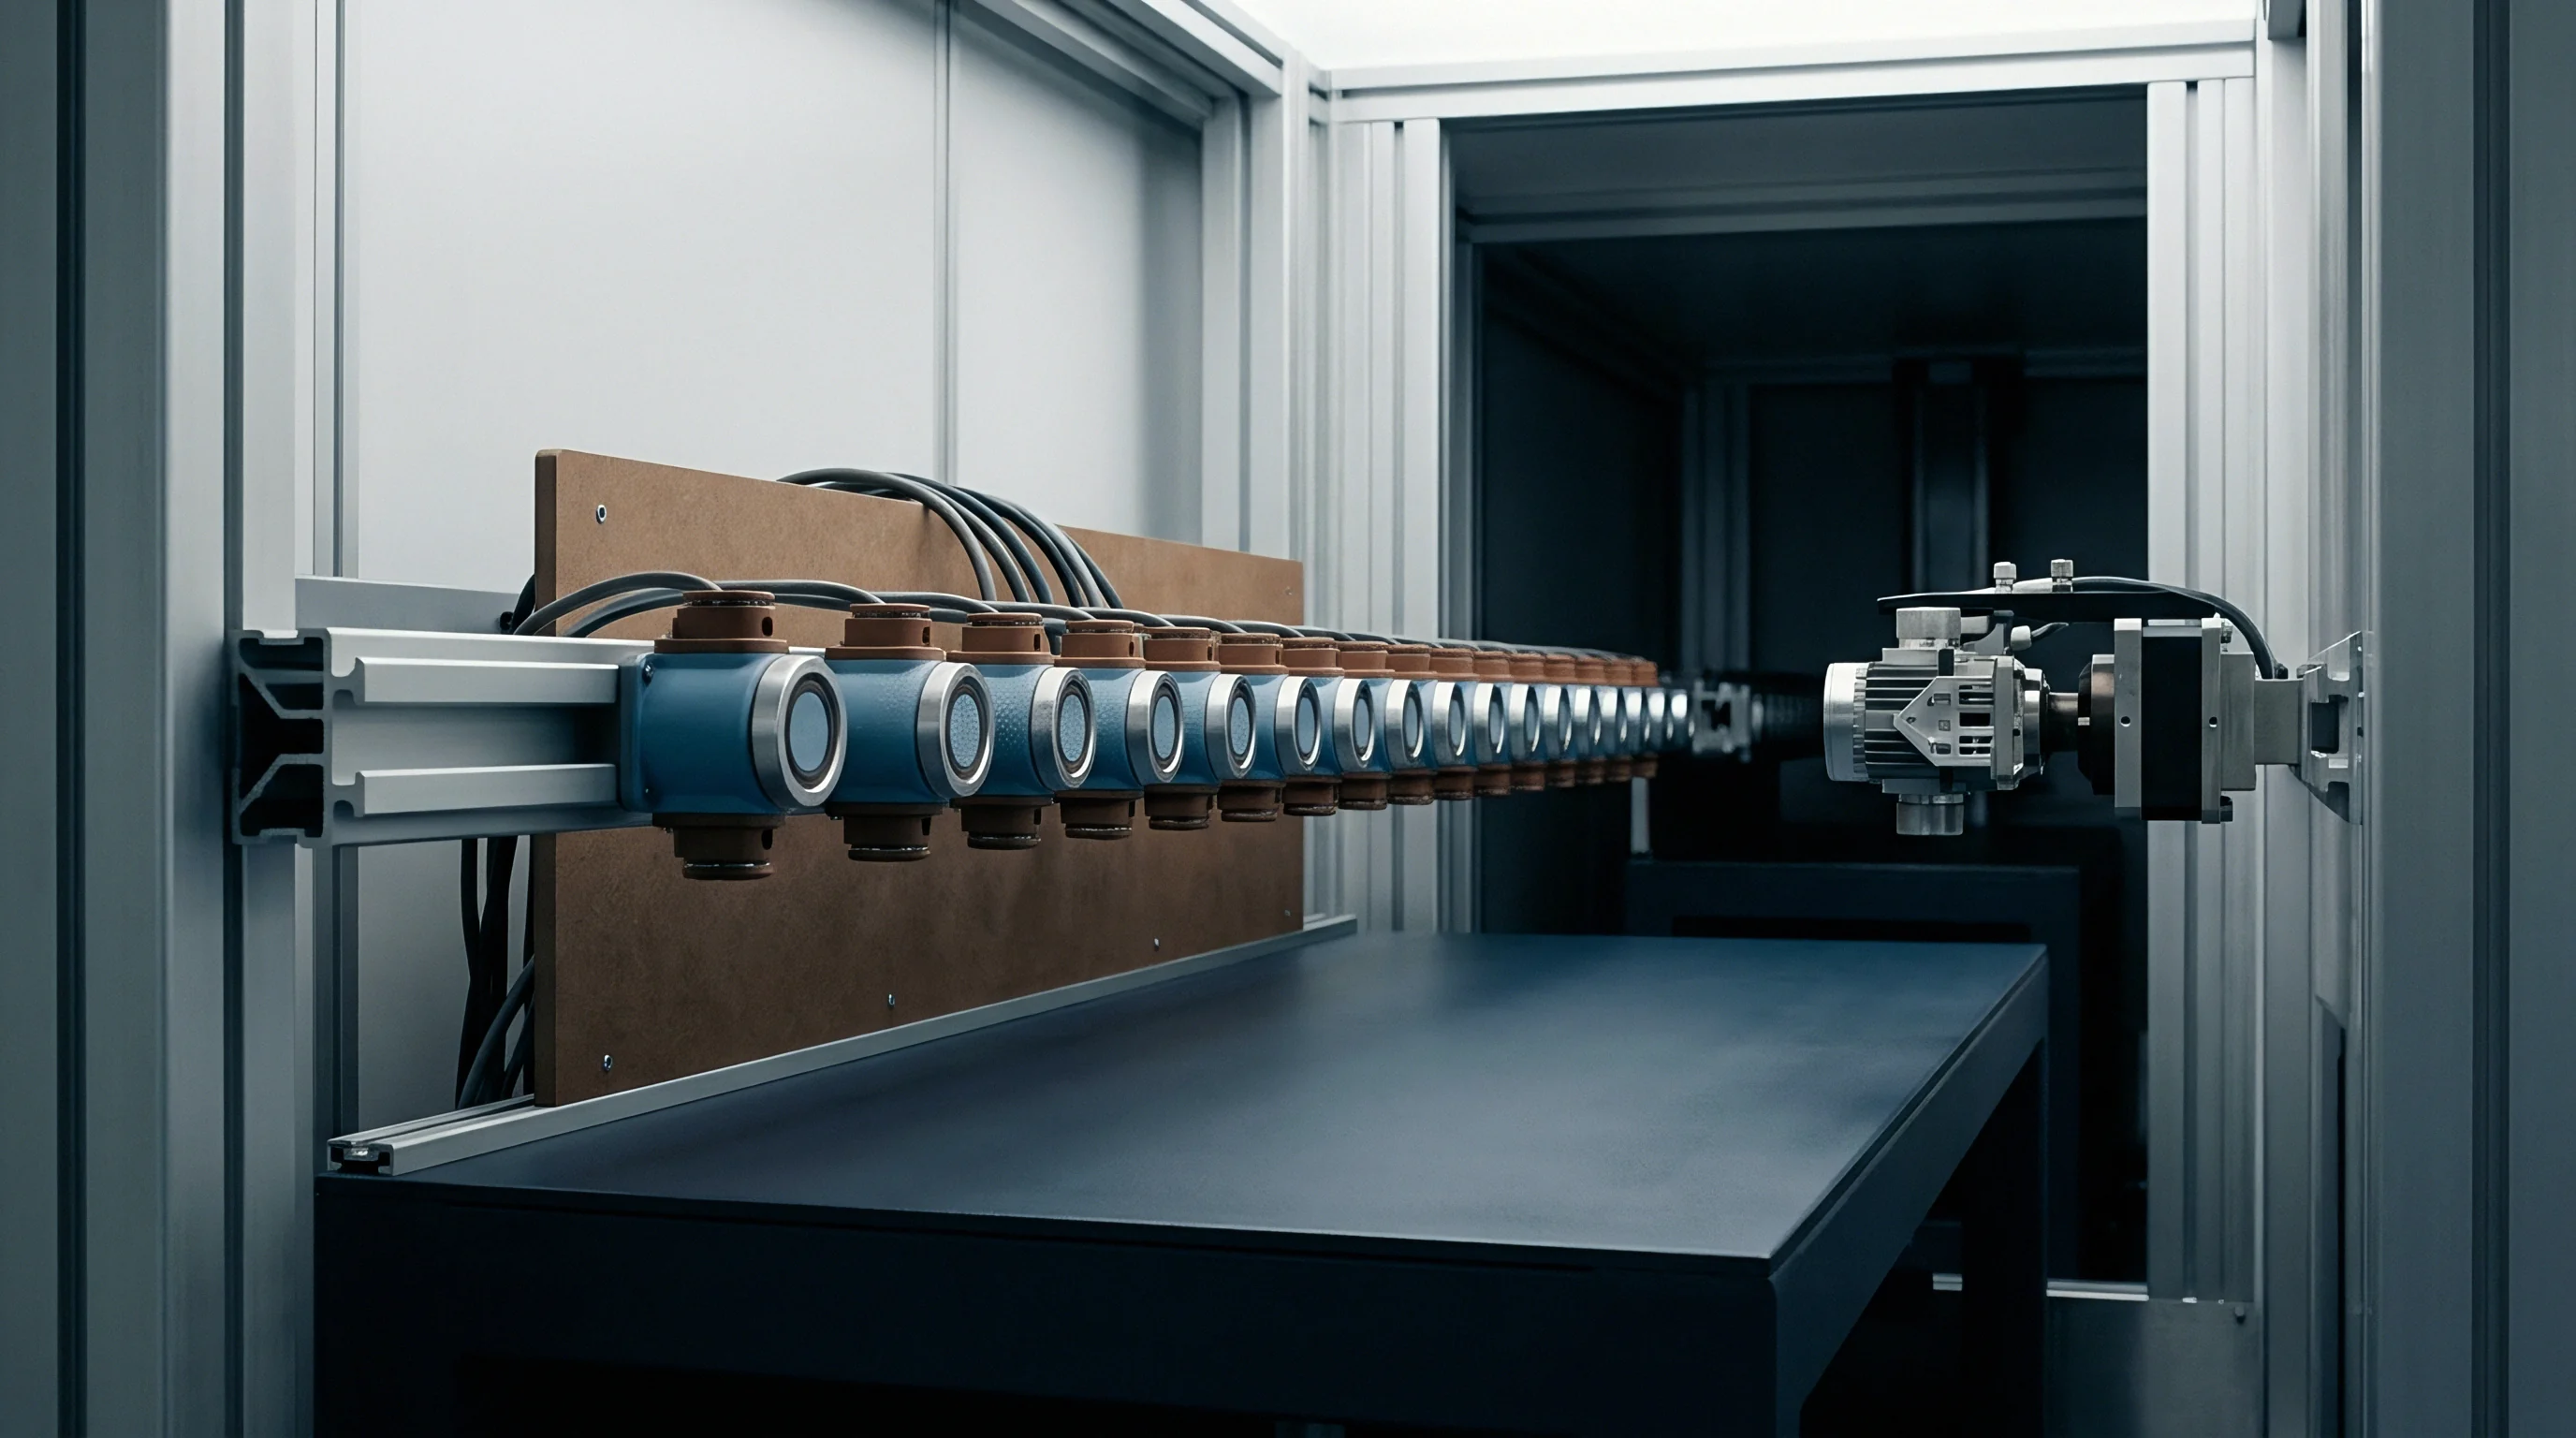
Mechanical test benches transfer pressure from reference balances to devices under test through fluid couplings. The physical geometry of the test manifold, the selection of pressurization media, and the mechanical mounting torque directly dictate whether a calibration measurement captures true sensor accuracy or reflects bench-induced artifacts.
Hydraulic and Pneumatic Media Interactions
Gas media serve low-pressure applications up to 7 MPa, whereas hydraulic oil or synthetic liquids supply high-pressure calibration circuits up to 400 MPa. Switching media introduces density and compliance variables into the measurement loop. Liquid media generate hydrostatic head pressure errors when the reference plane of the calibrator sits at a different elevation than the sensing diaphragm of the unit under test.
A vertical elevation difference of ten centimeters in a hydraulic oil line produces approximately 0.8 kPa of static offset, destroying the uncertainty budget of a low-range transducer.
Gas bubble entrapment in oil-filled pressure lines introduces non-linear compliance that invalidates static pressure calculations.
Gas bubble entrapment in oil-filled pressure lines introduces non-linear compliance that invalidates static pressure calculations.
Thermal gradients ruin static equilibrium. Rapid compression of gas inside a calibration manifold generates adiabatic heating, causing pressure to spike initially and then decay slowly as fluid temperature equilibrates with manifold walls. Taking calibration data points before fluid temperature stabilizes introduces artificial hysteresis into the test dataset.

Mechanical Stress and Fixturing Artifacts
Mounting an industrial transducer into a calibration block applies mechanical stress to the housing. Excessive installation torque deforms thin-film and piezoresistive diaphragms, shifting zero-point output voltages before pressure application begins.
- Trapped air pockets within hydraulic manifold dead volumes absorb mechanical energy, slowing pressure stabilization and distorting transient response measurements.
- Thermal conduction paths along metal interconnecting tubes create temperature deltas between the internal sensor element and the ambient reference environment.
- Thread sealant contamination migrating into the sensor cavity impinges on micro-machined silicon diaphragms, inducing mechanical hysteresis and localized stress points.
- Fluid media incompatibility causes elastomeric seal swell, restricting pressure port openings and generating apparent pressure lag during vent cycles.
Ignoring mechanical coupling variables results in reject rates on incoming inspection lines that reflect bad bench design rather than defective sensor manufacturing.


Budget
Evaluating total measurement variance requires combined standard uncertainty calculations following international metrology guidelines. A single accuracy figure printed on a manufacturer datasheet combines multiple distinct error sources under optimized laboratory conditions, obscuring individual contributions that expand when installed in process environments.
Standard Uncertainty Components
Type A evaluation calculates standard uncertainty from statistical analysis of repeated measurement series under identical conditions. Type B evaluation calculates standard uncertainty from external information, including calibration certificates, manufacturer specifications, thermal drift coefficients, and reference standard tolerances. Evaluating Type B components requires translating expanded uncertainty values into standard uncertainties by dividing by the appropriate coverage factor stated on reference documentation.
BS EN 61298-2 defines standard methods for evaluating non-linearity, hysteresis, and non-repeatability. Non-linearity evaluates terminal-based, end-point, or best-fit straight line methods. End-point non-linearity aligns best with industrial verification protocols because zero and full-scale calibration points anchor the operational span.

Uncertainty Budget Calculation Model
Consider a 10 bar piezoresistive industrial transducer calibrated against a digital reference calibrator. Standard uncertainty contributions sum in quadrature under the assumption of uncorrelated input variables.
| Variance Source | Standard Value | Probability Distribution | Divisor | Standard Uncertainty u(xi) | Contribution Sq |
|---|---|---|---|---|---|
| Reference Standard Uncertainty | 0.0025 bar | Normal (k=2) | 2.000 | 0.00125 bar | 1.563e-6 |
| Transducer Repeatability (Type A) | 0.0018 bar | Normal (n=5) | 1.000 | 0.00180 bar | 3.240e-6 |
| Non-Linearity (End-Point) | 0.0040 bar | Rectangular | 1.732 | 0.00231 bar | 5.336e-6 |
| Hysteresis | 0.0030 bar | Rectangular | 1.732 | 0.00173 bar | 2.993e-6 |
| Thermal Zero Drift (10 K delta) | 0.0050 bar | Rectangular | 1.732 | 0.00289 bar | 8.352e-6 |
| Digitization Resolution | 0.0010 bar | Rectangular | 1.732 | 0.00058 bar | 0.336e-6 |
| Combined Standard Uncertainty uc: 0.00467 bar | Expanded Uncertainty U (k=2): 0.00934 bar (0.093% Full Scale) | |||||
Translating individual variance sources into combined standard uncertainty follows a simple sequential calculation process.
- Convert all manufacturer tolerance limits and reference certificate figures into pressure units corresponding to the calibrated span.
- Assign probability distributions to each component, placing stated expanded uncertainties into normal distributions and bounded physical limits into rectangular distributions.
- Divide each parameter value by its distribution scale factor to extract individual standard uncertainties.
- Sum the squared standard uncertainties to calculate the total combined variance, then calculate the square root to yield combined standard uncertainty.
Multiplying combined standard uncertainty by a coverage factor of k=2 defines the expanded uncertainty interval containing approximately 95 percent of expected measurement values. The resulting expanded uncertainty of 0.00934 bar proves that the transducer barely holds a 0.1 percent accuracy class when operating across a modest 10 Kelvin temperature fluctuation.
How does dynamic line pressure fluctuation alter the long-term stability of the thin-film strain gauge bond layer under continuous cyclic fatigue?
Shift
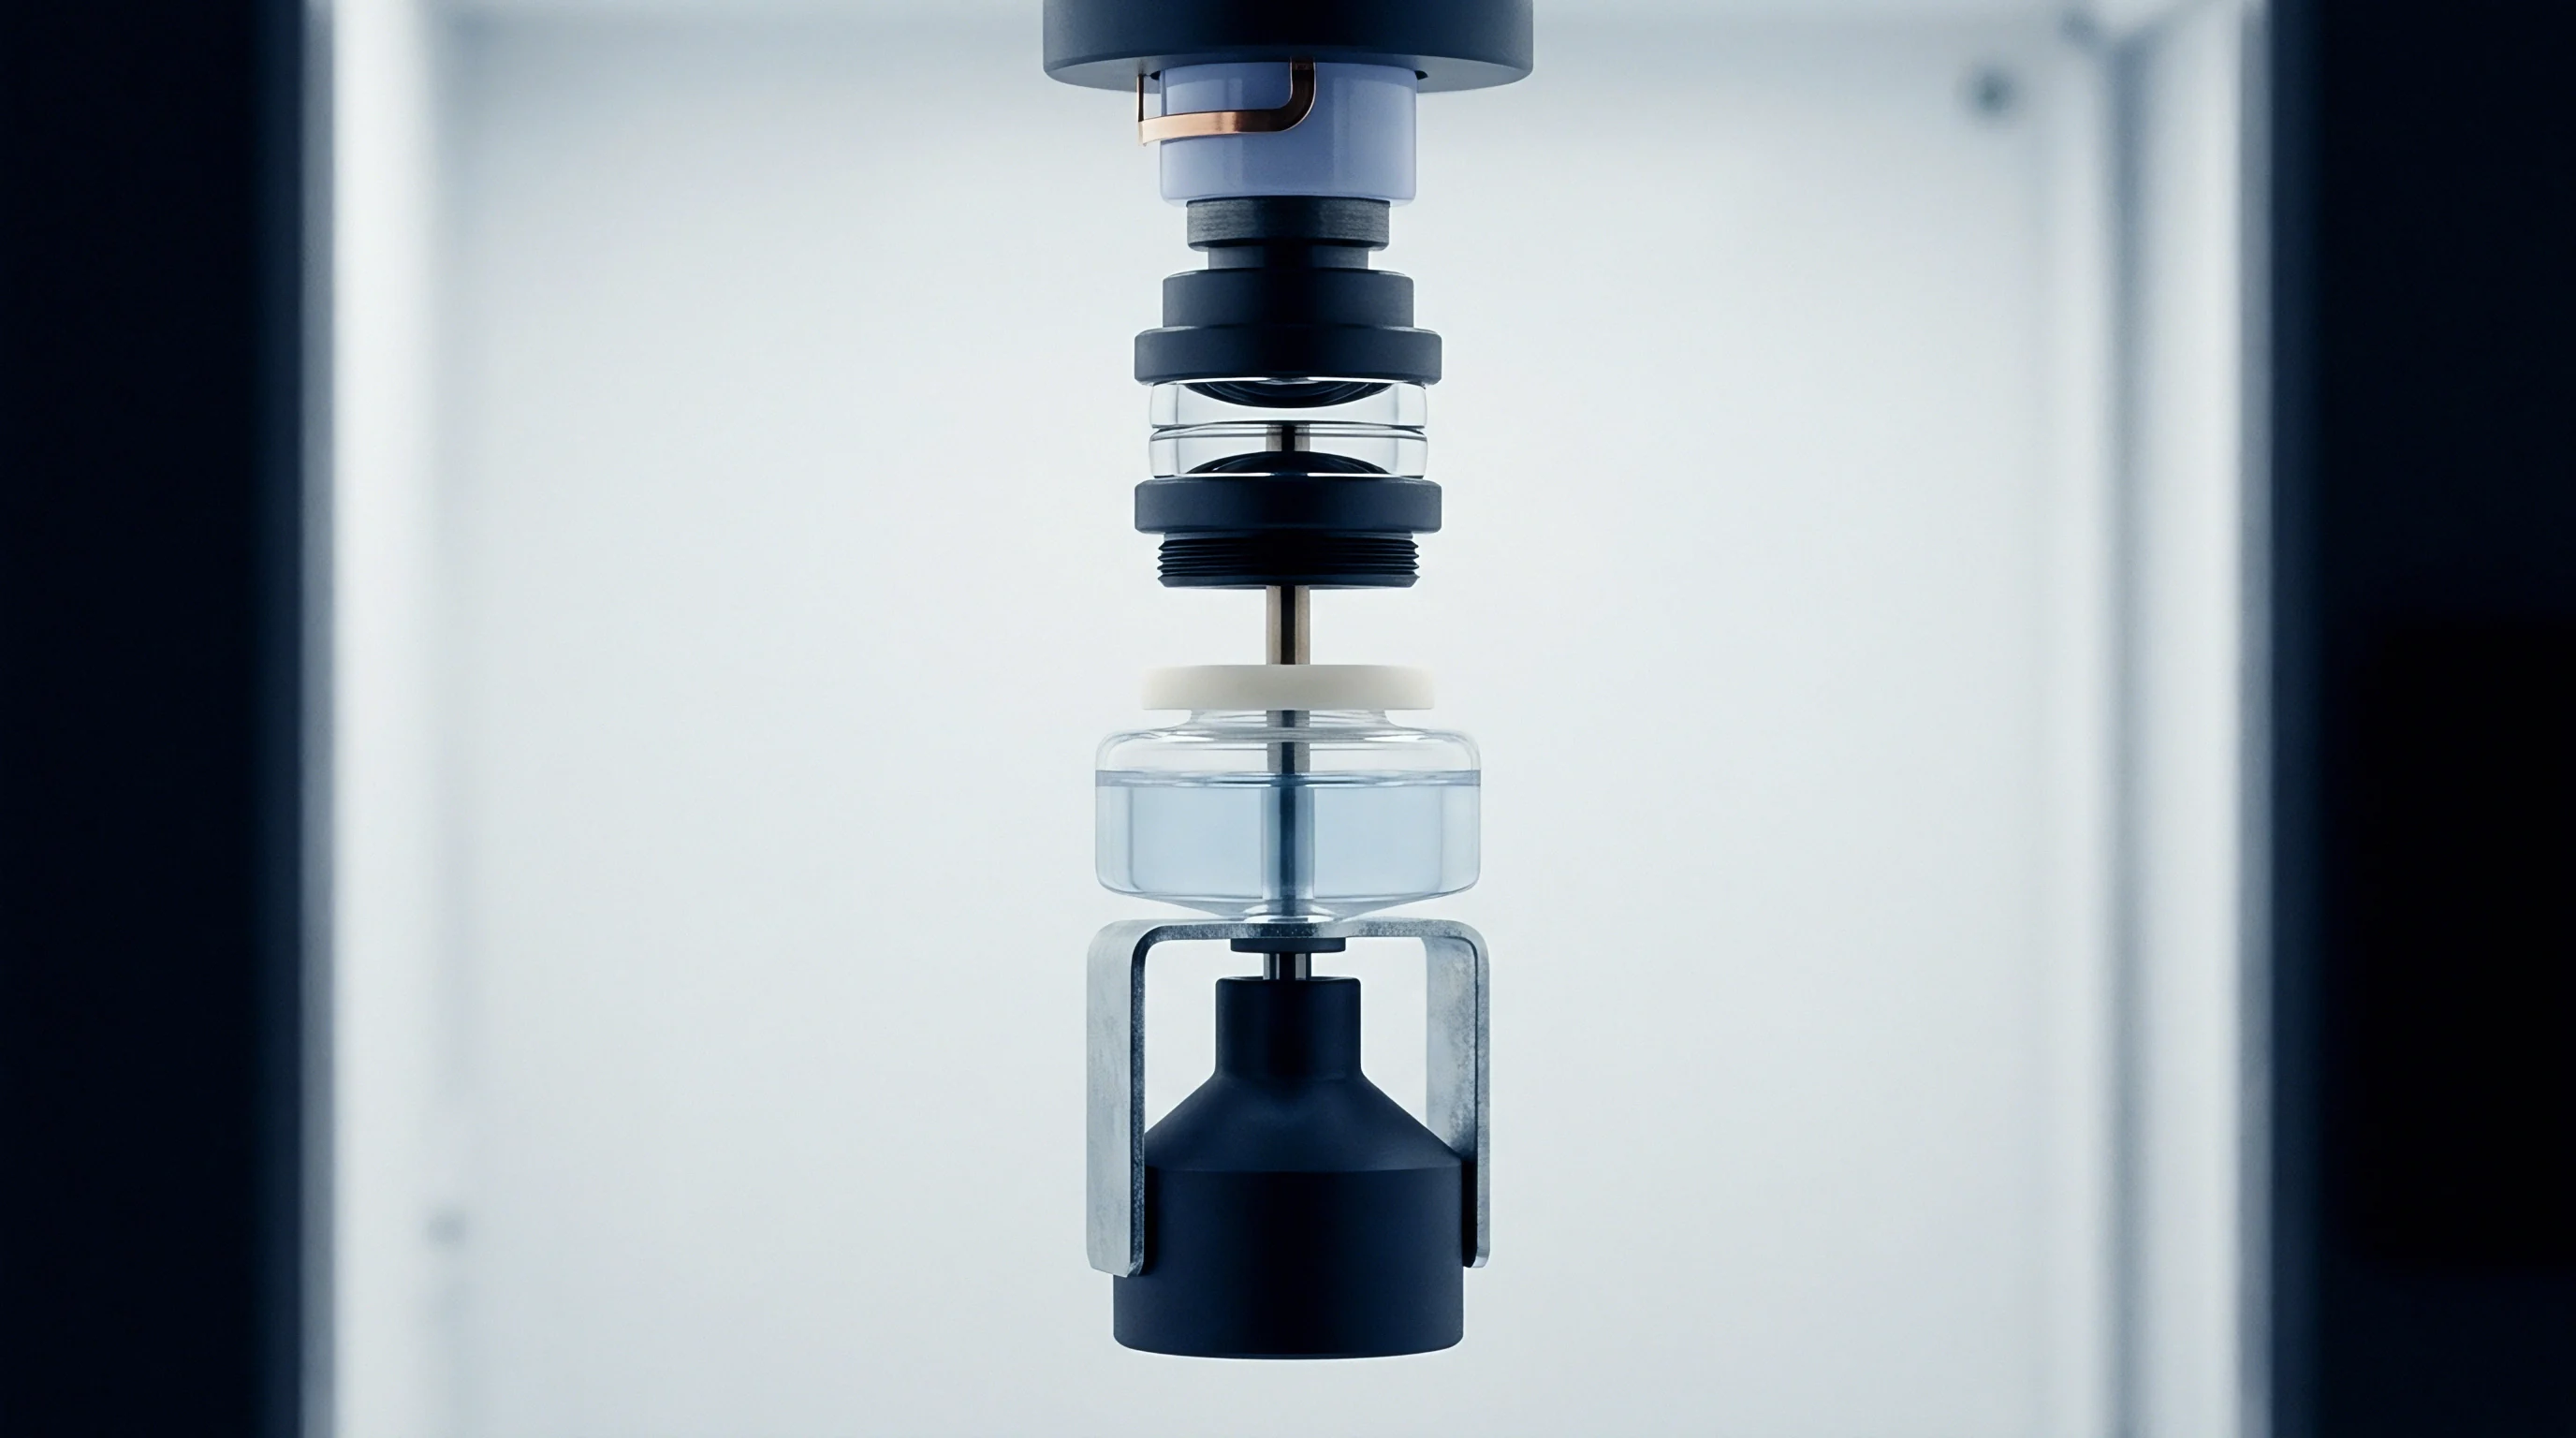
Piezoresistive diaphragm stress relaxes continuously across operating cycles. Internal oil fill fluids in isolated pressure cells undergo minor degasification and volumetric compression under sustained pressure shocks. These physical degradation mechanisms manifest as long-term zero drift and full-scale span shift, eroding initial calibration parameters over extended service lives.

When Does Thermal Hysteresis Overwrite Initial Calibration Data?
Thermal excursions alter internal material stresses in pressure transducers. Silicon diaphragms glass-bonded to header substrates exhibit differential thermal expansion. Heating the assembly to maximum operating temperature reorganizes internal lattice strain.
Upon cooling back to ambient baseline temperatures, the original zero-pressure output voltage does not recover completely, leaving residual mechanical strain offset.
Piezoresistive silicon transducers exhibit an average zero-point drift of 0.15 percent full scale span per calendar year under ambient laboratory conditions.
Datasheets report optimized bench results. Zero drift dominates total error over twelve months of industrial deployment, frequently exceeding the initial room-temperature accuracy specification by three hundred percent.

Environmental and Vibration Degradation
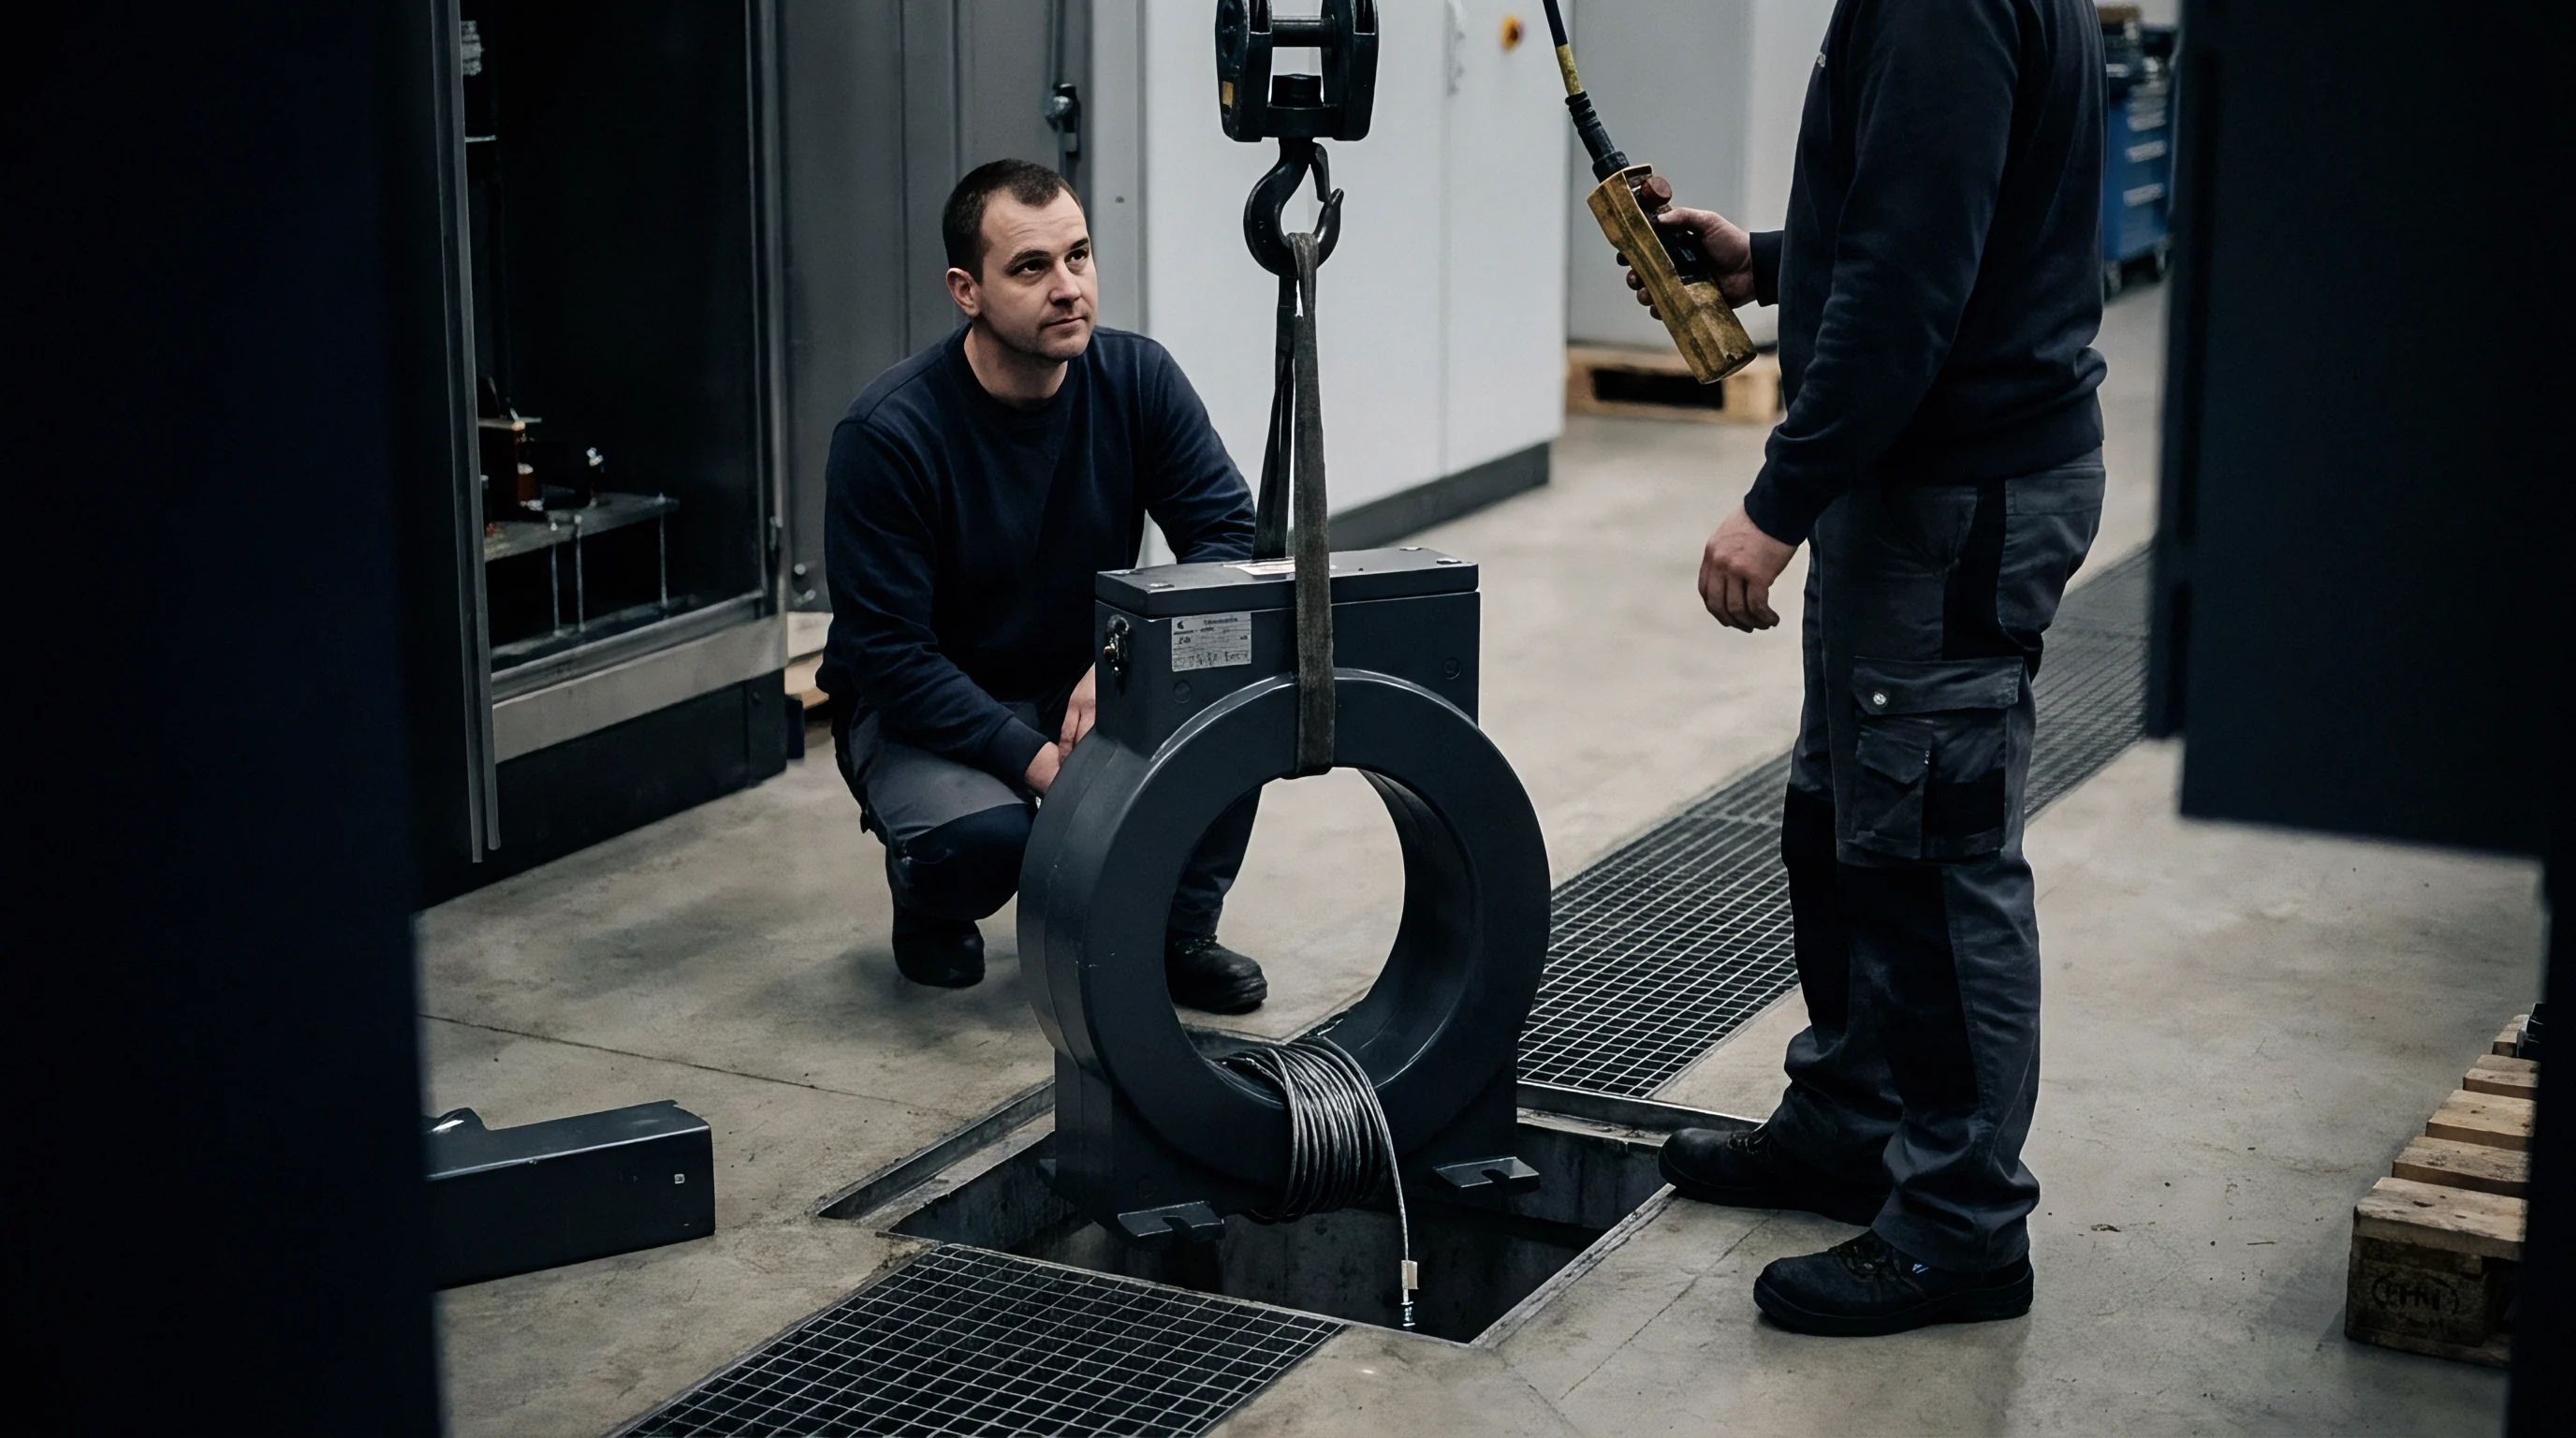
Field installations expose industrial pressure transmitters to mechanical vibration, electrical noise, and fluid pressure spikes. Vibration accelerates wire bond fatigue on micro-electromechanical sensing chips. Transient pressure spikes exceeding two hundred percent of nominal rated range deform sensing diaphragms permanently, introducing fixed offset jumps that calibration software cannot linearize.
Zero-point drift progresses faster than span shift in piezoresistive architecture.
Re-zeroing a transducer in the field corrects static offset errors but leaves span calibration unverified, masking underlying sensitivity degradation caused by piezoresistor aging.

Paperwork
Calibration documentation verifies compliance with accredited quality management standards. A certificate printed without accredited scope details or explicit uncertainty statements functions merely as an unverified factory test sheet, failing international audit requirements under ISO 9001 and ISO/IEC 17025 framework guidelines.
Reading Calibration Certificates
Auditors examine calibration certificates for explicit statements of traceability, environmental test conditions, raw measurement data points, and associated expansion factors. High-integrity documentation details both pre-adjustment as-found measurements and post-adjustment as-left performance figures.
As-found data reveals the extent of sensor drift occurring since the previous calibration cycle. Omitting as-found data leaves plant operators blind to process deviations that occurred while the sensor operated out of specification, risking regulatory non-compliance in pharmaceutical or food-grade processing lines.
- Accreditation body logo and unique laboratory registration number proving formal technical evaluation by recognized national signatories.
- Environmental parameters recorded during test runs, including ambient temperature, barometric pressure, and relative humidity limits.
- Traceability declaration explicitly identifying the reference standards utilized by serial number, certificate number, and calibration expiration date.
- As-found and as-left datasets listing applied reference pressures, indicated transducer readings, calculated errors, and expanded uncertainty figures per point.
Binary decision rules govern pass/fail determinations. Guardbanding sets acceptance limits tighter than specification limits by subtracting the calibration expanded uncertainty value. Guardbanding protects the buyer from accepting non-compliant components due to standard measurement error.
Suppliers frequently claim factory calibration certificates meet full traceability standards because their internal master gauge holds an accredited certificate, ignoring the requirement that the specific laboratory, environment, and procedure utilized for final device testing must hold independent accreditation.


Outlay
Purchasing sensor accuracy involves balanced evaluation of initial procurement price and total life-cycle calibration expenses. Selecting a transducer with tighter performance tolerances than the target process demands inflates initial hardware costs and imposes steep ongoing calibration overhead.
Cost Mechanics of Sensor Classes
Industrial pressure transducers fall into distinct commercial tiers defined by initial tolerance bands, calibration documentation depth, and long-term stability guarantees.
| Accuracy Grade | Initial Unit Cost | Certificate Level | Annual Recalibration Expense | Recommended Recalibration Interval |
|---|---|---|---|---|
| Process Grade (0.50% FS) | Base Price | Standard Factory Certificate | 20% of Base Price | 24 Months |
| Industrial Grade (0.25% FS) | 1.8x Base Price | Traceable Non-Accredited Test Data | 35% of Base Price | 12 Months |
| Precision Grade (0.10% FS) | 3.5x Base Price | ISO/IEC 17025 Accredited Certificate | 60% of Base Price | 12 Months |
| Metrology Grade (0.02% FS) | 8.0x Base Price | ISO/IEC 17025 Calibration Report | 120% of Base Price | 6 Months |
Recalibration intervals determine total expense. A precision transducer requiring bi-annual accredited recalibration incurs total maintenance costs exceeding its initial purchase price within three operating years.
Setting Defensible Calibration Intervals
Interval selection matches risk exposure and historical drift rate data. Moving from static calendar-based recalibration to risk-based intervals reduces operational maintenance budgets without increasing process failure rates.
- Compile historical as-found calibration datasets across identical transducer model populations operating in similar field environments.
- Calculate mean drift rates and standard deviation statistics for zero and span shifts across 12-month operational windows.
- Establish process tolerance boundaries based on absolute safety thresholds and product quality parameters.
- Set the recalibration interval at the time point where drift probability models show a two-sigma confidence boundary approaching the process tolerance limit.
Narrowing the specified tolerance band of an industrial pressure transducer by half quadruples its commercial calibration costs over five years of field service.
Certificates prove unbroken calibration history. Establishing rational calibration intervals, enforcing rigorous manifold configuration standards, and modeling complete uncertainty budgets transforms raw pressure data into traceable, audit-proof measurement assets.