Determining Baseline Sensor Accuracy Classes and Wafer Trim Mechanics
Wafer trim establishes initial sensor accuracy classes, but package stress and thermal drift determine field performance and calibration costs.

Grade
Sensors enter industrial manufacturing lines categorized by error limits that define baseline measurement capability. Datasheet accuracy designations group components into standardized performance tiers based on maximum allowable deviation from an ideal transfer function. These accuracy bands integrate zero offset, span error, non-linearity, and hysteresis into a single percentage figure relative to full scale output.
Understanding how these bands are established requires examining both element-level manufacturing variations and system-level signal conditioning limits.
Taxonomy of Initial Sensor Accuracy
Industrial instrumentation standardizes tolerance limits into distinct performance tiers. Platinum resistance temperature detectors follow IEC 60751 standards, dividing accuracy into Class B, Class A, Class AA, and fractional DIN grades. Piezoresistive pressure transducers and MEMS silicon sensors organize performance around percentage full scale output bands, ranging from 0.5 percent down to 0.05 percent.
Each class imposes specific limits across defined operating temperature windows.
Wafer trim fixes initial offset. Raw silicon transducers exhibit baseline output variations up to fifteen percent due to doping gradients and photolithography linewidth tolerances. Factory laser trimming or digital trim resistor adjustment narrows this spread into discrete precision classes before final packaging.
The target accuracy class governs how much trim time each die receives on the automatic wafer prober.
A platinum resistance element specified at Class AA tolerance maintains a expanded uncertainty of 0.10 degrees Celsius at 0 degrees Celsius under IEC 60751 testing standard.
The 0.05 percent full scale output tolerance claim rests on a 25 degrees Celsius wafer probe test with a 10-millisecond pulse width; dielectric heat dissipation during packaging shifts this band to 0.12 percent full scale output. Evaluating baseline class boundaries requires checking whether stated limits apply to raw sensor elements or fully signal-conditioned transmitter assemblies. Signal amplification, analog-to-digital conversion, and temperature compensation networks introduce secondary error terms that alter the overall uncertainty budget.

Systemic Deviation across Transducer Domains
Piezoresistive elements, resistance temperature detectors, and capacitive diaphragms exhibit distinct error signatures under ambient testing. Silicon pressure sensors suffer from strong temperature coefficients of offset and sensitivity, demanding multi-point thermal compensation. Platinum RTDs demonstrate highly linear resistance-temperature relationships but suffer from self-heating errors when excitation currents exceed standard operational thresholds.
| Transducer Technology | Standard Accuracy Class | Typical Offset Tolerance | Full Scale Sensitivity Error | Thermal Coefficient Band |
|---|---|---|---|---|
| Thin Film Platinum RTD | IEC 60751 Class AA | +/- 0.10 deg C at 0 deg C | +/- 0.04 percent | 0.003851 ppm/deg C |
| Piezoresistive Silicon Pressure | Grade 0.1 FSO | +/- 0.05 percent FSO | +/- 0.08 percent FSO | +/- 0.005 percent FSO/deg C |
| Hall Effect Current Transducer | Grade 0.5 Industrial | +/- 0.20 percent FSO | +/- 0.30 percent FSO | +/- 0.012 percent FSO/deg C |
| MEMS Capacitive Accelerometer | Grade 0.2 Precision | +/- 5 mg baseline | +/- 0.15 percent | +/- 0.02 mg/deg C |
Accuracy classes set at the wafer level serve as baseline screening metrics rather than field performance guarantees. Transducers assigned to high precision accuracy tiers during wafer probing require compatible packaging architectures to preserve their performance grade. Components categorized under relaxed accuracy tiers proceed through lower-cost assembly lines where post-trim stress is less critical.
Selecting an initial accuracy class without accounting for downstream package shift creates false precision expectations during system design.
High accuracy grades require lower packaging stress to survive assembly.


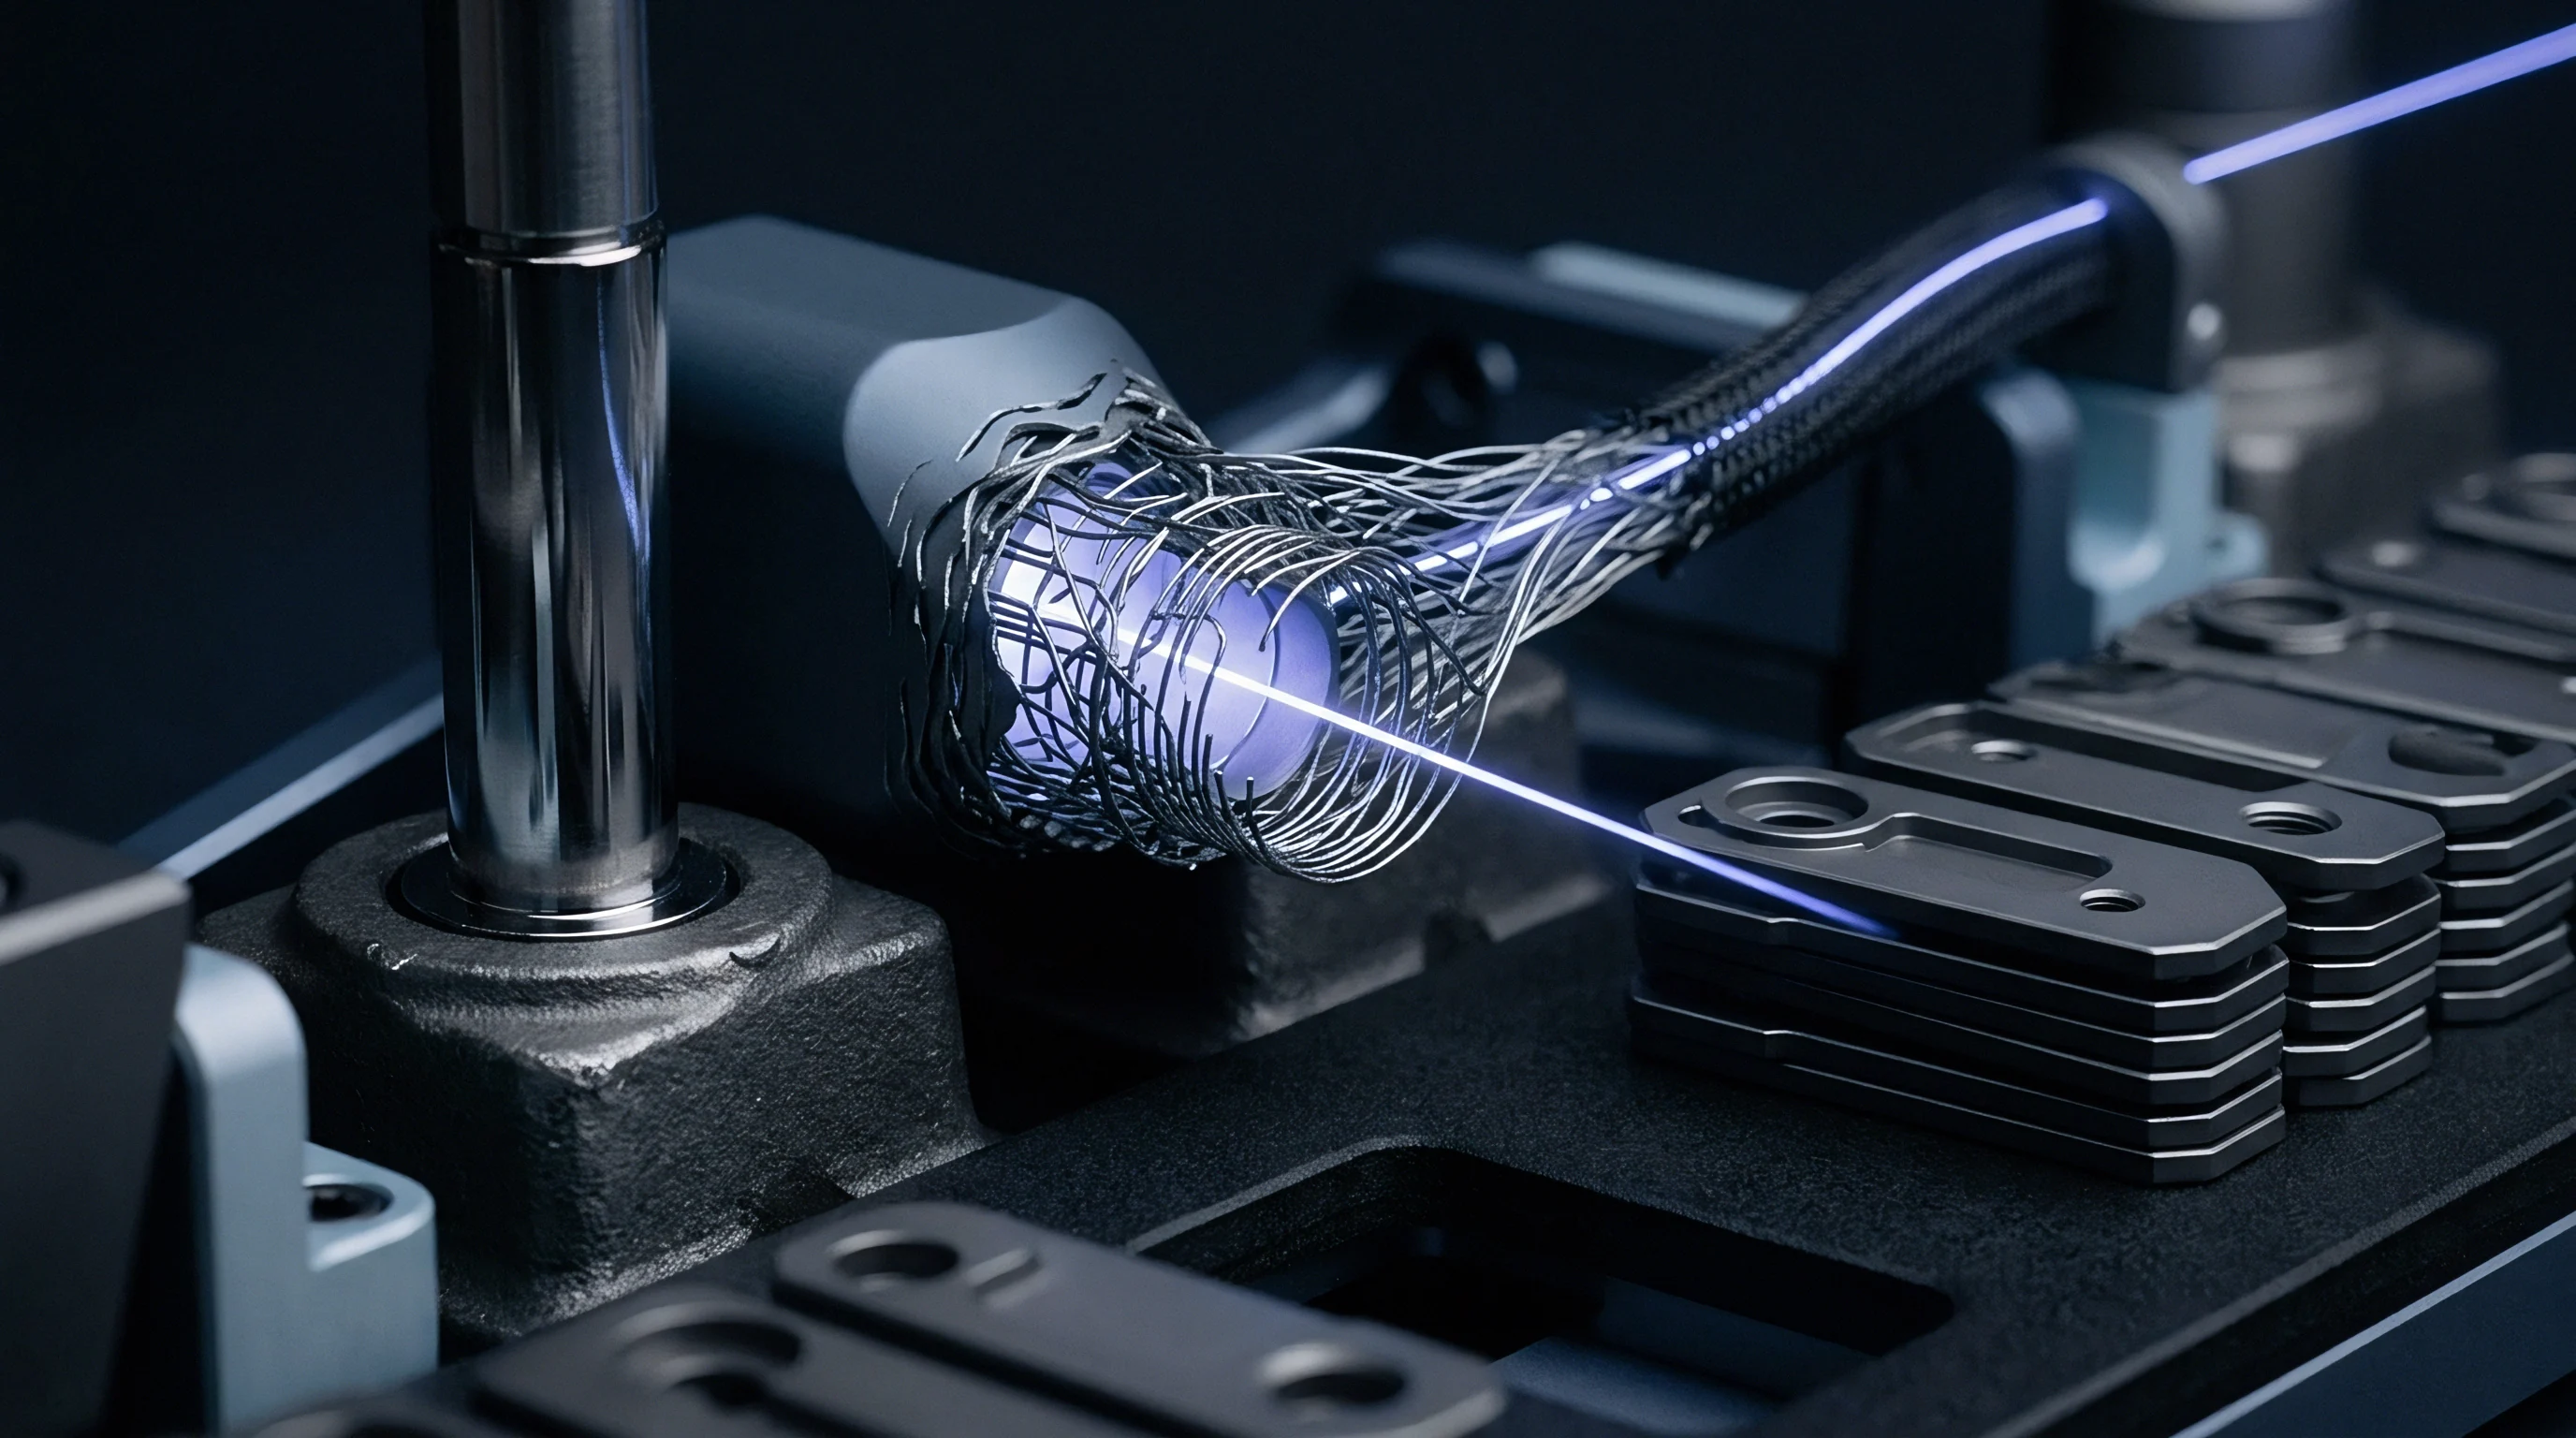
Laser
Wafer-level calibration modifies integrated resistor networks to bring raw transducer outputs within target performance bands. Automated laser trim systems align solid-state lasers over wafer prober stations, firing focused pulses into thin-film or thick-film resistor structures while measuring real-time circuit response. The physical ablation of resistive material increases total resistance, adjusting bridge balance, gain scaling, and temperature compensation parameters directly on the silicon substrate.
Thin Film Resistor Network Topologies
Sputtered tantalum nitride and nickel chromium alloys form the primary conductive elements on silicon wafers. Thin-film materials provide low temperature coefficients of resistance and high long-term stability compared to polysilicon alternatives. Wafer trim circuits configure these films into ladder networks, cuttable links, or continuous geometric bars designed for active kerf cutting.
Laser energy cuts thin films. Trimming executes through two primary physical modes: continuous geometry vaporizing cut and discrete link cutting. Link cutting removes parallel conductive paths, stepping total resistance upward in binary increments without leaving exposed kerf edges within active resistive zones.
Continuous cutting alters conductive path width directly, providing fine analogue resolution at the expense of creating localized heat-affected zones.
Selected trim topologies directly affect component post-trim reliability and thermal stability:
- L-cut geometry alters resistance by shifting current density away from the kerf tip while preserving fine adjustment control near the cut apex.
- Plunge cutting provides rapid coarse adjustment but creates high local electric field gradients along the laser kerf edge.
- Serpentine ladders allow discrete binary resistance steps while keeping thermal stress low across the thin film matrix.
- Zener zapping creates permanent conductive micro-bridges across PN junctions without mechanical debris or substrate heat generation.

Kerf Geometry and Thermal Dissipation Mechanics
Focused photon beams vaporize conductive material, leaving clean cuts that alter electrical flow paths. The laser pulse duration, wavelength, and spot size govern energy delivery into the resistive film. Infrared lasers operating at 1064 nanometers or green lasers at 532 nanometers deliver short nanosecond pulses that minimize thermal diffusion into surrounding silicon dioxide insulation layers.
Trim kerfs create microscopic microcracks. Energy density exceeding material vaporization thresholds induces localized shockwaves, forming micro-fractures in adjacent dielectric thin films. These microcracks propagate over time under thermal cycling, altering current flow paths and introducing subtle resistance drift months after production.
Controlling laser spot overlap and peak power prevents excessive substrate heating while ensuring complete material clearance across the kerf channel.
Active laser trimming continues until real-time automated test equipment registers target bridge output voltage. Automated prober needles maintain contact with die pad landing areas during laser pulse sequences, requiring fast-settling measuring instruments to process analog feedback. The trimming algorithm calculates kerf velocity and cut path trajectories dynamically to prevent overshoot past specified resistance thresholds.
Supplier technical documentation typically attributes late-stage zero drift to unavoidable micro-scale material stress relaxation along laser kerf margins.
Shift
Encapsulation processes alter component geometry and introduce localized mechanical stresses across silicon dies. Die attach adhesives, epoxy mold compounds, ceramic substrates, and wire bonding procedures transfer structural forces directly into the trimmed sensor bridge. These mechanical loads modify electrical performance through piezoresistive and piezostrictive mechanisms, displacing factory laser calibration figures.
Thermomagnetic and Mechanical Packaging Stresses
Plastic mold compounds and ceramic headers exert compressive forces during post-trim cooling cycles. Differential thermal expansion coefficients between silicon substrates, glass frit seals, and copper leadframes create residual mechanical stress fields. Piezoresistive pressure sensors experience significant zero-offset shifts when mold compounds contract unevenly across Wheatstone bridge arms.
Package stress shifts sensor bias. Epoxy curing at 150 degrees Celsius locks thermal strain into the die structure as the assembly returns to ambient temperatures. Transducer drift caused by die-attach epoxy shrinkage ranges between 0.02 percent and 0.18 percent full scale output depending on curing oven ramp rates, a spread too wide for static mathematical modeling; buyers mitigate this uncertainty by requiring post-encapsulation thermal burn-in protocols before final acceptance testing.
Compliance with ISO 10012 section 7.2 dictates that calibration interval adjustments execute whenever post-assembly drift exceeds one third of the target error band.

Cure Strain and Die Attach Creep
Adhesive resins shrink during thermal polymerization, pull the silicon substrate, and distort balanced bridge circuits. Gel encapsulants minimize mechanical stress transfer but introduce potential moisture ingress paths that degrade insulation resistance over long service lifetimes. Rigid die attach epoxies provide robust mechanical mounting but transfer thermal expansion mismatches directly into active sensing regions.
| Packaging Process Step | Stress Mechanism | Average Zero Offset Shift | Average Span Sensitivity Shift | Mitigation Strategy |
|---|---|---|---|---|
| Die Attach Epoxy Curing | Polymers polymerize and shrink thermally | + 0.12 percent FSO | – 0.05 percent FSO | Controlled multi-stage cure profiles |
| Transfer Molding Encapsulation | High-pressure compressive mold cooling | – 0.25 percent FSO | – 0.18 percent FSO | Low-stress silicone stress buffers |
| Hermetic Header Glass Frit Seal | High-temperature thermal expansion mismatch | + 0.08 percent FSO | + 0.02 percent FSO | Symmetrical die substrate mounting |
| Printed Circuit Board Reflow | Solder joint solidification and PCB flexure | + 0.06 percent FSO | – 0.03 percent FSO | Compliant leadframe geometry design |
Component designers employ stress-isolation grooves, compliant silicone gels, and micro-machined pedestal mounts to decouple active sensor zones from package strain. Wafer-level calibration executed before packaging remains incomplete without post-assembly validation. Circuit compensation networks integrated into modern signal conditioning ICs frequently incorporate secondary digital OTP memory, allowing room-temperature post-packaging trim to restore baseline accuracy classes damaged by packaging stress.
Ignoring packaging stress mechanics causes high sensor reject rates at incoming quality control inspection.


Drift
Sensor calibration degrades over extended operating periods due to lattice creep, oxidation, and structural relaxation. Long-term stability metrics reflect a transducer’s capacity to hold its accuracy class over months or years of continuous service. Physical drift mechanisms alter baseline zero offsets and span sensitivity independently of initial wafer trim quality.

When Does Packaging Stress Override Wafer Trim Accuracy?
Die-level thermal contraction during post-encapsulation cooling generates mechanical forces that exceed the initial laser trim correction margin. When mold compound shrinkage exerts localized compressive stress over sixty megapascals, piezoresistive coefficient shifts override thin-film resistor bridge balance. The resulting zero-point drift easily pushes a Grade 0.1 percent transducer out of its target specification class into Grade 0.5 percent territory.
Heat shifts the zero point. Thermal cycling accelerates atomic diffusion within laser kerf heat-affected zones. Tantalum nitride films absorb trace ambient oxygen through thin protective passivation layers, gradually increasing bulk resistivity.
Semiconductor fabrication plants in East Asia adjust cleanroom humidity to control static charge on thin films, a physical discipline that mirrors the moisture stabilization required in high-precision sensor packaging facilities. Unstable oxide growth on resistor surfaces causes continuous positive resistance drift during high-temperature operation.
Evaluating long-term drift stability requires standardized thermal stress aging protocols:
- Standardize the device under test at 23 degrees Celsius for twenty-four hours before baseline measurement.
- Subject the assembly to five full thermal cycles between maximum and minimum operational storage thresholds.
- Record the zero offset and full scale output at ambient room temperature within two hours of cycling completion.
- Calculate the hysteresis margin by comparing post-cycling zero offset against initial pre-treatment baseline metrics.
Long Term Aging and TCR Evolution
Intermetallic diffusion and ambient oxidation change resistor properties across thousands of operating hours. Thin-film resistors exhibit non-linear logarithmic aging curves, experiencing rapid drift during initial thermal stabilization before settling into slow continuous degradation rates. The 0.1 percent annual drift rate rests on a 1000-hour high-temperature operating life test at 125 degrees Celsius; exposure to humidity above 85 percent RH doubles this rate within six months.
Creep changes full scale offset. Microstructural strain relaxation in silicon diaphragms and metal strain gauges creates irreversible zero shifts under sustained pressure loads. Higher ambient operating temperatures lower the activation energy required for atomic dislocation movement, shortening the operational window before recalibration becomes mandatory.
How do design teams distinguish between structural die attach relaxation and thin-film oxidation when analyzing three-year field returns?

Bench
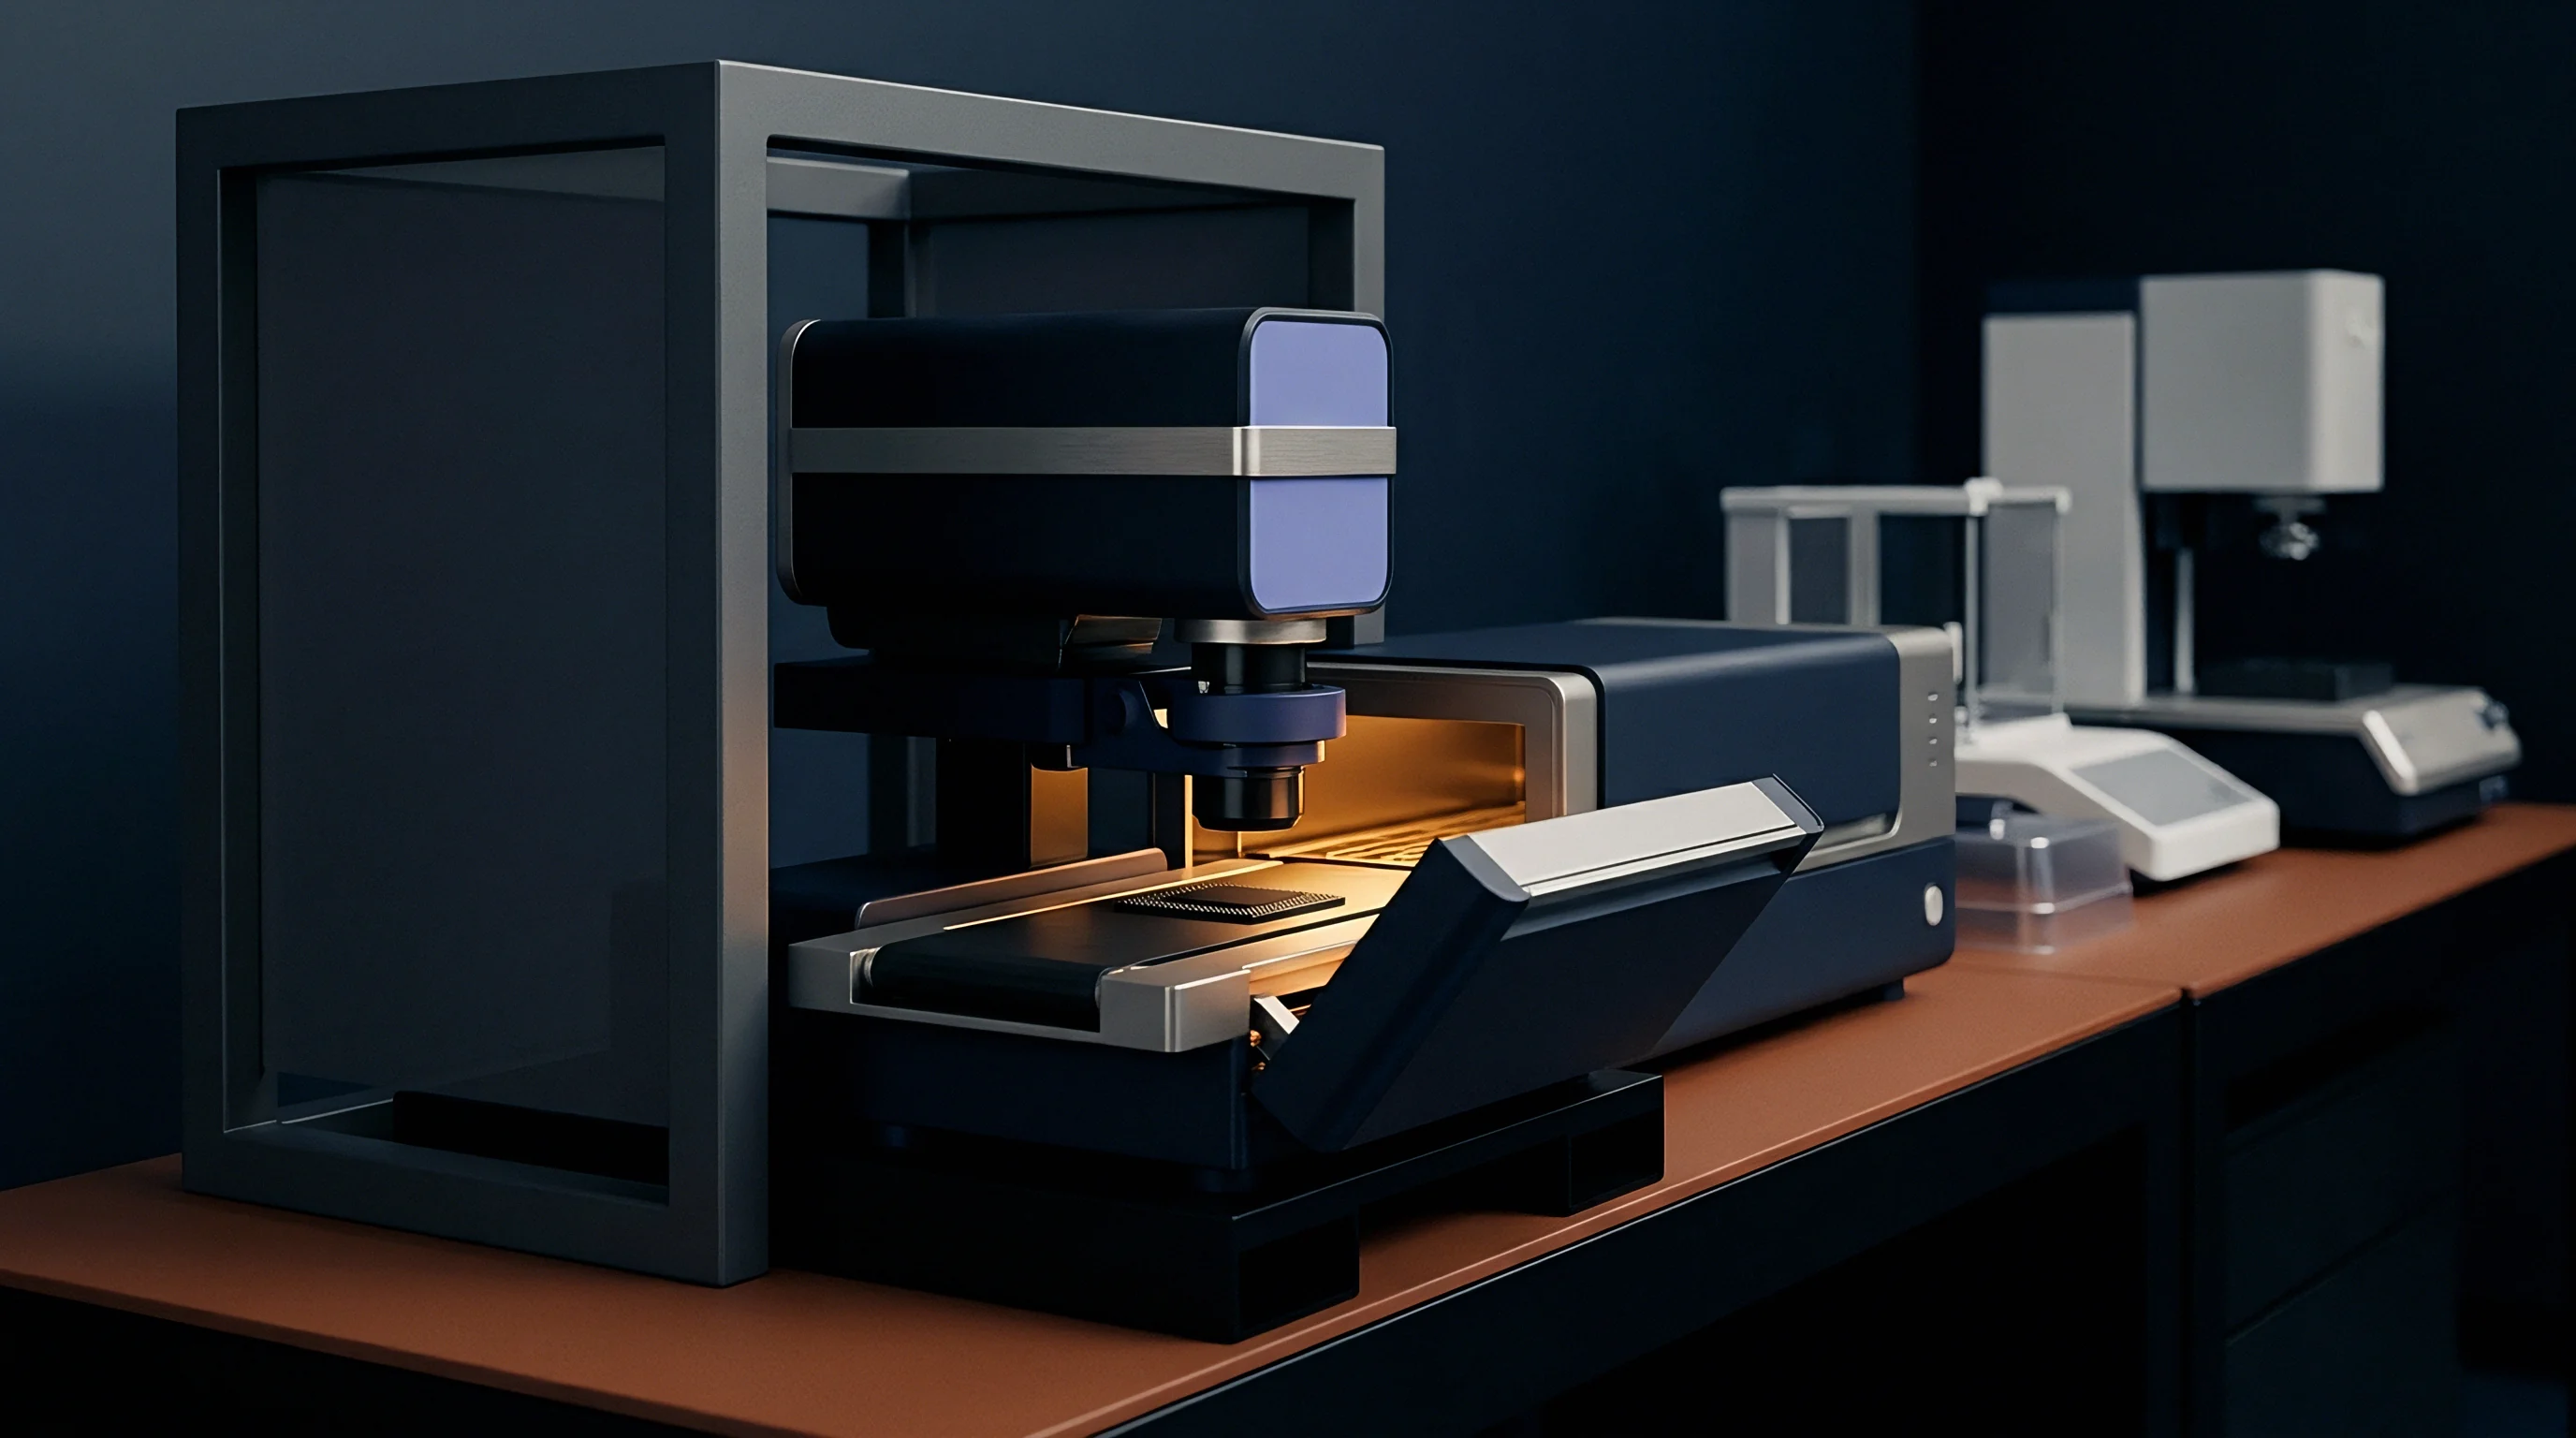
Laboratory evaluation confirms whether physical transducers maintain specified accuracy limits under controlled reference environments. Calibration procedures compare sensor output metrics directly against high-order transfer standards traceable to national metrology standards. Establishing rigorous test protocols prevents false acceptance or premature rejection of incoming sensor lots.
Uncertainty Budgets under ISO 17025 Standards
Accredited testing facilities calculate total measurement risk by combining systematic bias and random laboratory variance. An uncertainty budget accounts for reference standard inaccuracy, excitation power supply drift, temperature chamber instability, and digital multimeter resolution limitations. Standard coverage factors expand combined standard uncertainty into ninety-five percent confidence intervals.
Reference standards require three times higher precision than the sensor grade under evaluation to isolate true component deviation.
Traceability links every measurement. Calibration laboratories implement systematic test sequences to isolate individual transducer error sources during bench verification:
- Thermal stabilization verification prevents transient temperature gradients from corrupting sensor zero readings during bench testing.
- Four wire Kelvin sensing removes lead wire resistance errors during low ohms resistive bridge calibration.
- Power supply line regulation eliminates excitation voltage ripple artifacts from analog ratio output measurements.
- Traceable standard validation ensures calibration equipment maintains documented unbroken linkages to national metrology institutes.
Traceability Chains and Reference Calibration Ratios
Unbroken calibration linkages connect factory testing tools to national measurement standards. A four-to-one test uncertainty ratio represents standard metrological practice, ensuring testing system variance does not obscure sensor component defects. When evaluating high-precision Grade 0.05 transducers, maintaining this ratio demands secondary reference standards certified by accredited ISO/IEC 17025 facilities.
| Uncertainty Contribution Source | Standard Uncertainty Value | Probability Distribution Type | Sensitivity Coefficient | Combined Uncertainty Share |
|---|---|---|---|---|
| Primary Pressure Standard Reference | +/- 0.008 percent FSO | Normal (k = 2) | 1.00 | 38.2 percent |
| Thermal Chamber Gradient (+/- 0.2 deg C) | +/- 0.010 percent FSO | Rectangular | 0.50 | 29.8 percent |
| Digital Multimeter Voltage Reading | +/- 0.003 percent reading | Normal (k = 1) | 1.00 | 14.4 percent |
| Excitation Source Regulation Drift | +/- 0.004 percent output | Rectangular | 1.00 | 12.1 percent |
| Ambient Room Pressure Variations | +/- 0.002 percent FSO | Rectangular | 0.20 | 5.5 percent |
Standard procurement documentation mandates that calibration certificates specify expanded measurement uncertainty alongside raw calibration figures per ISO/IEC 17025 clause 7.8.4.

Contract
Commercial sensor procurement balances component precision against manufacturing yield penalties and field maintenance expenditures. Tightening sensor tolerance bands directly increases wafer trim process duration and scrap rates at factory wafer probe stages. Buyers evaluate total cost of ownership by combining initial component purchase unit prices with long-term recalibration and warranty exposure liabilities.

Commercial Yield and Precision Tolerance Pricing
Tighter factory accuracy specifications directly reduce usable silicon die output per manufacturing batch. Wafer-level laser trimming increases total prober dwell time, creating a production throughput bottleneck. Achieving Grade 0.05 percent tolerances demands slower trim kerf execution speeds and multi-pass laser sequences, escalating manufacturing costs per silicon slice.
Yield drops fast. Wafer yield follows a non-linear decay curve as target accuracy specifications narrow. Silicon dies failing tight laser trim specifications are down-banded to looser accuracy grades or scrapped entirely, driving unit costs higher for top-tier components.
Tightening wafer tolerance bands from one percent to one tenth percent reduces silicon yields by thirty percent.

Field Recalibration Economics and Total Cost
Scheduled maintenance cycles and sensor replacement schedules constitute the primary long term operating expenditure. Field recalibration operations require mobile calibration rigs, trained metrology technicians, and planned process downtime. Deploying low-cost sensors with high annual drift rates leads to frequent maintenance interventions that quickly override initial procurement savings.
Calibration costs money. SpecifyingGrade 0.1 percent sensors in applications requiring only Grade 0.5 percent performance wastes financial resources on unneeded manufacturing precision. Conversely, installing relaxed-grade sensors in critical process loops increases operational risks, product rejection rates, and regulatory compliance liabilities.
Procurement contracts specify guardbanding rules to manage risk between buyers and sellers. Guardbanding narrows acceptable factory test limits below published datasheet tolerances, ensuring delivered sensor lots meet specification despite measurement uncertainty variations between supplier and customer bench equipment.