Thin Film Interlayer Adhesion Stress Analysis for High Temperature Strain Gauges
High temperature thin film gauge survival requires balancing deposition stress and CTE mismatch to hold interlayer shear below critical fracture limits.

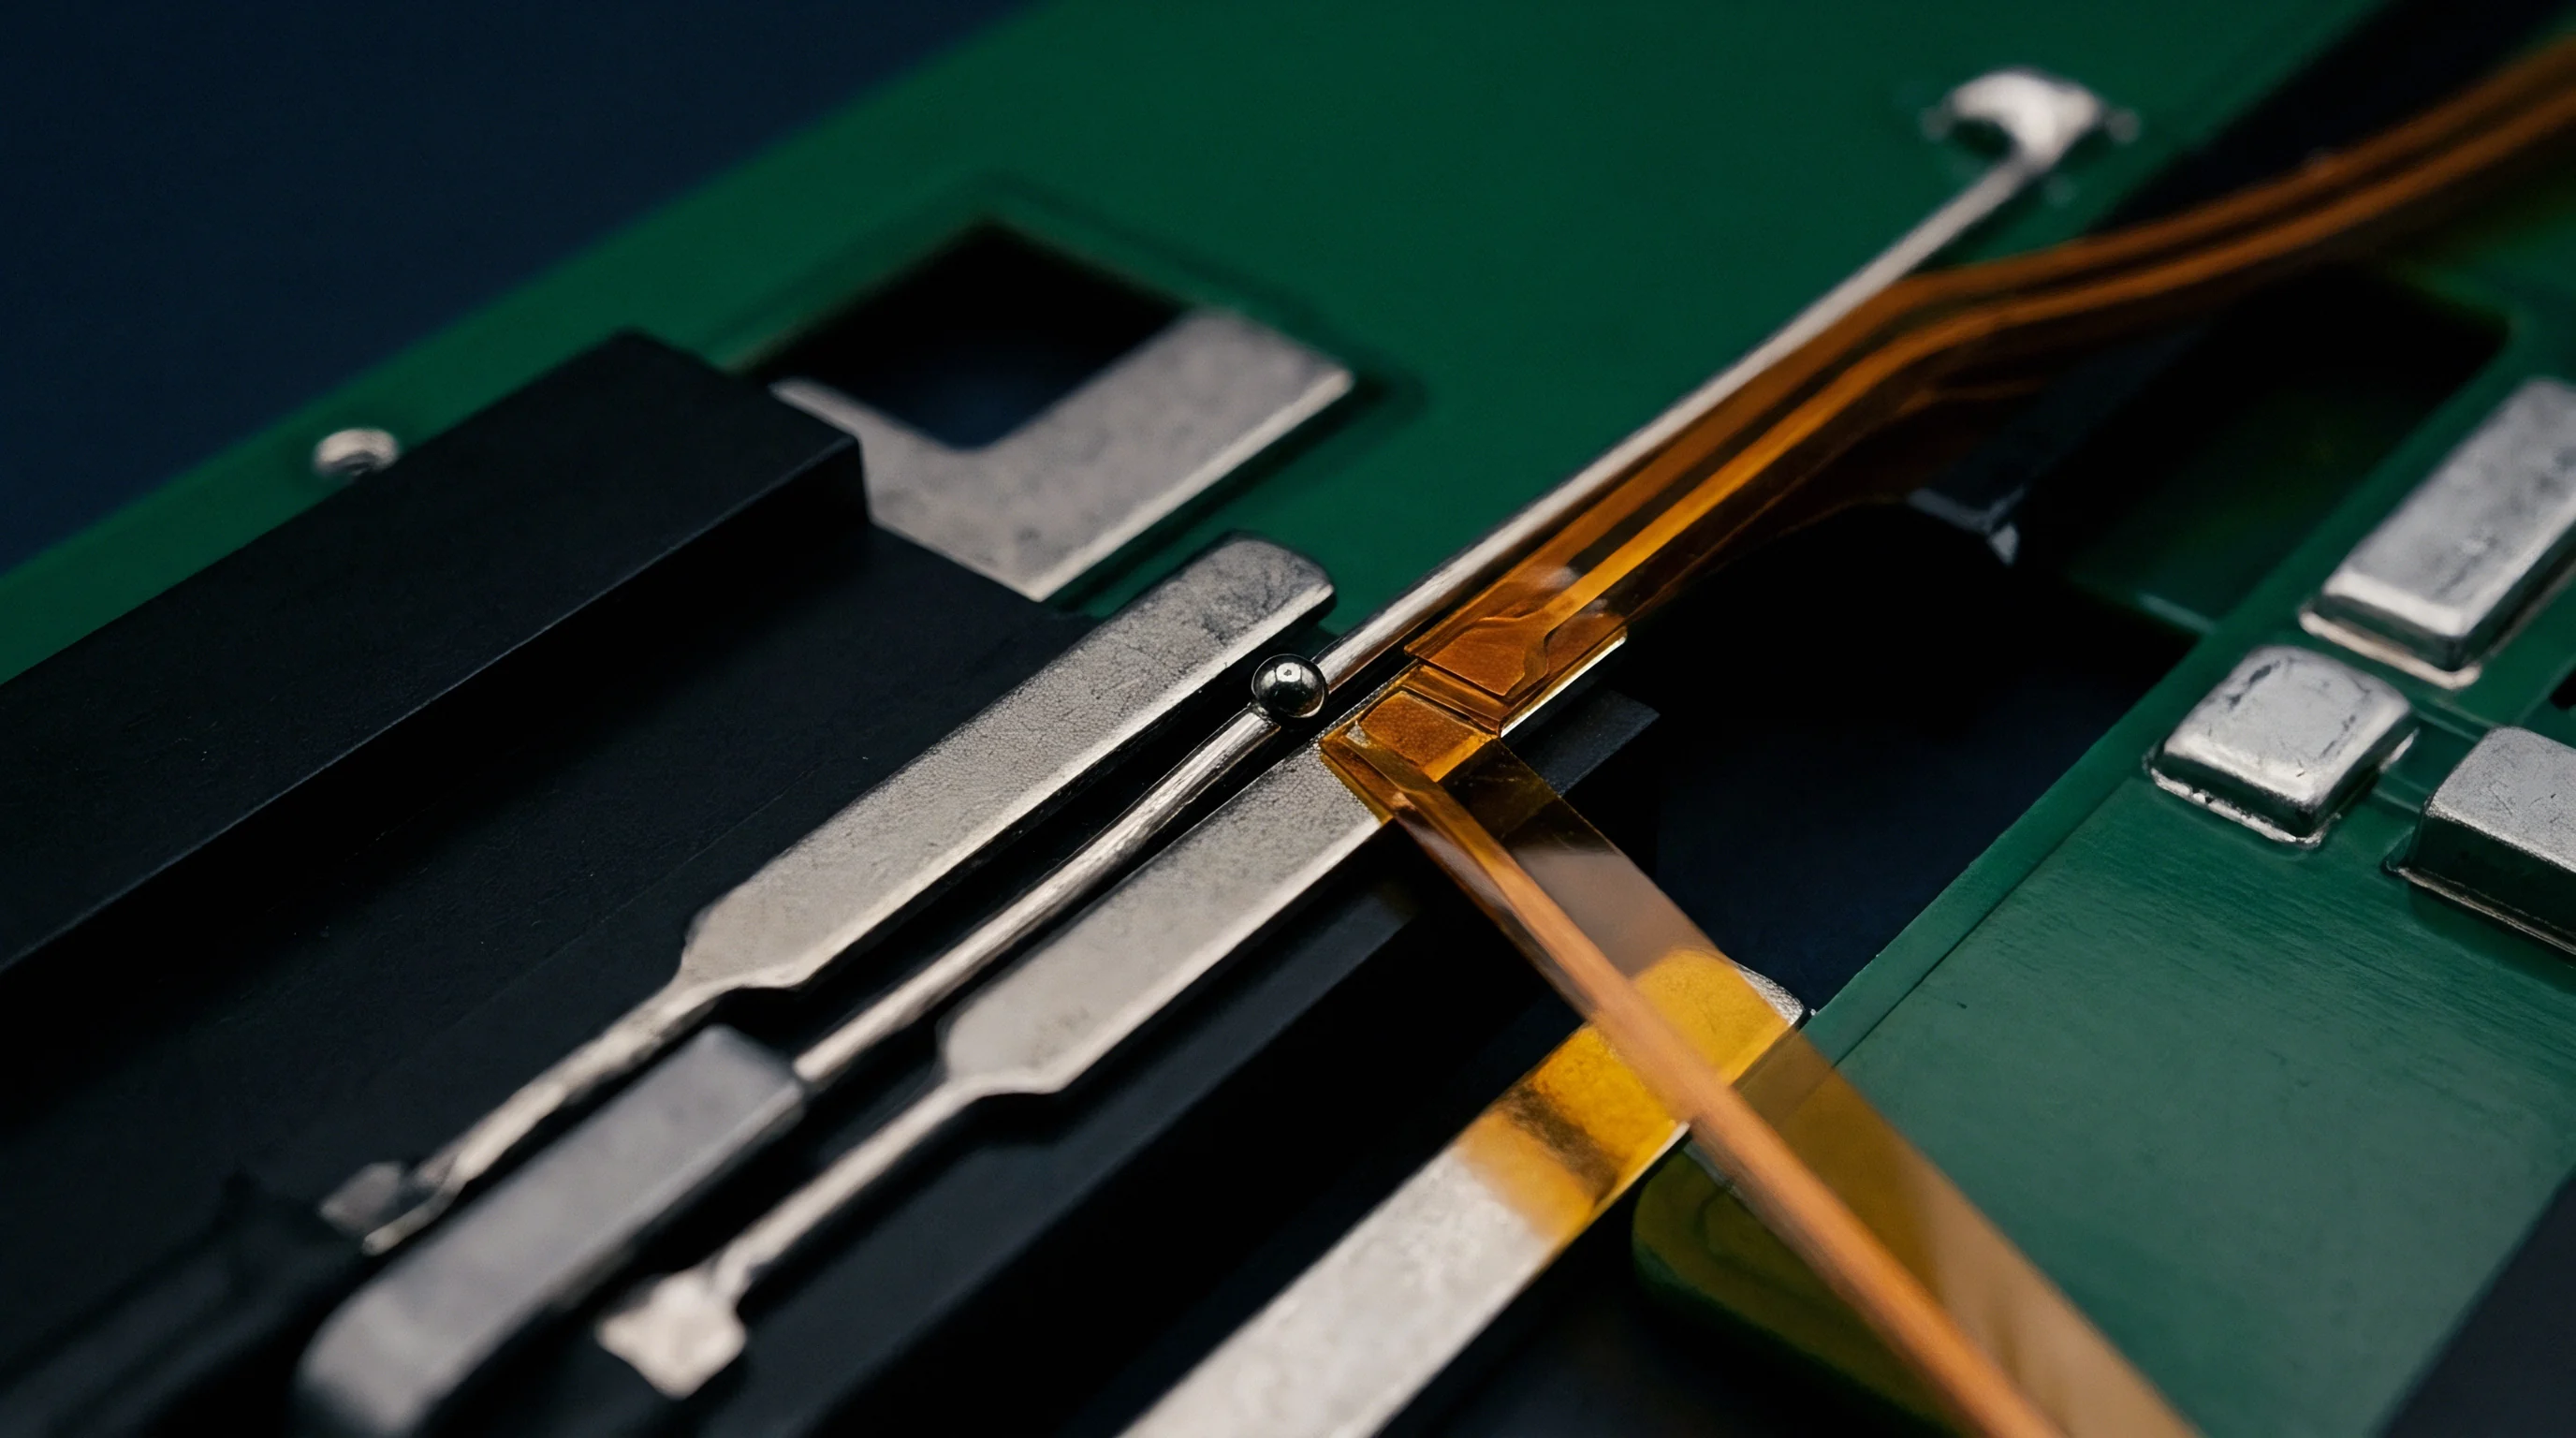
Substrate
Depositing thin film sensors directly onto turbomachinery components and superalloys avoids the mass penalties and adhesive temperature limits of traditional foil gauges. Above 700°C, the interface between ceramic dielectric and nickel superalloy faces severe thermo-mechanical stress. The gauge operates as a layered micro-stack in which each material brings its own elastic modulus, thermal expansion coefficient, and crystal structure.
To reliably transfer strain from alloy to piezoresistor, these thin films must stay bonded through thousands of thermal cycles.
A high-temperature thin film gauge stack relies on functional layers deposited in sequence. On top of the structural alloy base sit an insulating oxide, a sensor film, and protective passivation coatings. Picking the right combination means balancing electrical resistivity, breakdown strength, and crystal structure compatibility across the full operating range.
Designing functional layers for extreme heat means balancing conflicting physical properties across five primary zones in the stack:
- Base Structural Alloy carries the main mechanical load and acts as a heat sink, expanding between 13.0 and 16.5 ppm per degree Celsius like most polycrystalline superalloys.
- Bond Coat Layer transitions the surface chemistry from metal to ceramic, typically using MCrAlY alloys or reactive refractory metals laid down between 1.0 and 3.0 micrometers thick.
- Dielectric Isolation Layer prevents leakage from the sensor to the substrate, using 3.0 to 10.0 micrometers of dense alpha-alumina or yttria-stabilized zirconia to keep resistance above 100 Megaohms at 1000°C.
- Piezoresistive Sensing Layer converts strain to resistance changes, using stable alloys like palladium-13%chromium or platinum-13%rhodium patterned from 0.1 to 0.8 micrometers thick.
- Passivation Capping Layer prevents oxidation and volatilization of the active element, using dense silicon nitride or stoichiometric alumina coatings between 0.5 and 2.0 micrometers.
Early interface integrity hinges on surface prep. Polishing down to sub-nanometer roughness (Ra under 5 nanometers) stops localized stress spikes from seeding micro-voids as films deposit. Right before growth, high-density argon plasma sputter-cleaning strips off organic contaminants and native oxides.
But if ion beam energy during sputter etching goes above 500 electron volts, subsurface crystal damage degrades the fracture toughness of the joint. Keeping plasma clean bias below 350 volts maintains crystal lattice continuity across the metal-dielectric boundary without sacrificing bond strength.
Growth dynamics in magnetron sputtering set the initial stress in each layer. Pressure, substrate bias, and gas purity shape atomic packing density. Below 0.3 Pascals, energetic bombardment peens atoms tight, pushing compressive intrinsic stresses above 1.5 Gigapascals.
Above 1.2 Pascals, argon promotes loose columnar grain growth with high void density, creating tensile stress profiles that leave grain boundaries open to rapid oxygen transport at high temperature.
Post-deposition heat treatment changes the microstructure completely. Amorphous alumina crystallizes into the stable alpha phase above 800°C, bringing a localized density shift of about 8 percent. That volume contraction pulls intensely at the dielectric-bond coat boundary.
If the annealing routine fails to keep ramp rates below 2°C per minute through crystallization, micro-delamination cracks form along grain boundaries before the sensor ever sees service.
Thermal expansion mismatch across ceramic-metal interfaces generates shear stresses that scale linearly with temperature excursion and film thickness.
Insulation strength drops fast once heat mobilizes ionic charge carriers in the dielectric. Sodium and potassium impurities from lower-grade sputtering targets concentrate at grain boundaries under strong electric fields. At 900°C, a 5-micrometer alumina layer with 50 parts per million sodium loses three orders of magnitude of insulation resistance in 50 hours.
Using high-purity targets with total trace alkali metals below 5 parts per million eliminates the leakage paths that throw off strain bridge balance.
Substrate stability ultimately sets the baseline for the whole gauge package. If stress-relief heat treatment is skipped before deposition, residual machining stresses in the superalloy relax during that first 850°C thermal cycle. The resulting dimensional shift happens independent of strain, permanently ruining zero-point calibration.
Maintaining mechanical integrity across layers means matching thermal expansion while controlling grain boundary orientation throughout physical vapor deposition.

Cohesion
Mechanical equilibrium inside a multi-layer stack comes down to balancing growth stress against thermal mismatch stress. As substrate and film change temperature together, mismatched expansion coefficients generate differential strain at the joint. The resulting thermal stress scales with the integrated temperature change and film elasticity.
Because high-temperature gauges operate across spans over 1000°C, stress modeling is a core design requirement.
Working out residual stress profiles means evaluating elastic moduli, Poisson’s ratios, expansion coefficients, and intrinsic growth stress for every layer. Because properties change substantially over wide temperature ranges, realistic models require temperature-dependent integration rather than room-temperature snapshots.
| Material Layer | Elastic Modulus GPa at 25°C | Elastic Modulus GPa at 900°C | Mean CTE 10-6 K-1 from 25-900°C | Poisson Ratio | Intrinsic Stress MPa As-Deposited |
|---|---|---|---|---|---|
| Inconel 718 Substrate | 205 | 145 | 16.2 | 0.29 | 0 |
| MCrAlY Bond Coat | 175 | 120 | 14.8 | 0.30 | -120 |
| Alpha-Alumina Dielectric | 380 | 310 | 8.5 | 0.24 | -450 |
| 8YSZ Thermal Isolation | 210 | 155 | 10.5 | 0.25 | +180 |
| PdCr Sensor Film | 265 | 185 | 12.8 | 0.32 | -280 |
| Pt-13Rh Sensor Film | 171 | 115 | 10.3 | 0.38 | -150 |
| Silicon Nitride Cap | 310 | 260 | 3.2 | 0.26 | -850 |
Total normal stress in a heated thin film layer combines intrinsic growth stress and thermal mismatch stress. Calculating it relies on the biaxial modulus of the film and accounts for temperature-dependent expansion across the full profile.
Thermal stress formulation takes the structural form:
sigma_th = ( E_f / ( 1 – nu_f ) ) integral_T0_T1 ( alpha_sub(T) – alpha_film(T) ) dT
Where E_f is the elastic modulus of the film, nu_f is Poisson’s ratio for the film, alpha_sub(T) is the substrate’s instantaneous thermal expansion coefficient, and alpha_film(T) is that of the thin film.
For multi-layer stacks, modified Stoney equations relate total curvature to each layer’s stress contribution. When substrate thickness t_s is much larger than total film thickness sum(t_i), curvature changes evaluate as follows:
kappa = ( 6 / ( E_s’ t_s^2 ) ) sum_i ( sigma_i t_i )
Where E_s’ equals E_s / (1 – nu_s), the biaxial elastic modulus of the substrate, sigma_i is the net residual stress of layer i, and t_i is its thickness.
Interfacial shear stress peaks near free edges and structural transitions, such as the edges of patterned gauge tracks. Shear lag models show that peak shear stress occurs within roughly three film thicknesses of the track edge. The maximum shear stress tau_max scales with average normal film stress sigma_f and the ratio of film shear modulus G_f to dielectric thickness h_d:
tau_max = sigma_f sqrt( ( G_f t_f ) / ( E_f h_d ) )
A specific case illustrates how large these interfacial forces get. Consider a 0.5-micrometer palladium-13%chromium (PdCr) gauge deposited over a 5.0-micrometer alpha-alumina dielectric on an Inconel 718 substrate. As the stack cools from 900°C annealing down to 25°C room temperature, plugging in the temperature-dependent data yields these step-by-step stress levels:
First, take the CTE difference between the Inconel 718 substrate (16.2 x 10^-6 /K) and the alumina layer (8.5 x 10^-6 /K), giving delta-alpha of 7.7 x 10^-6 /K over a delta-T of -875 K. Room-temperature biaxial modulus for alpha-alumina is 380 GPa / (1 – 0.24), or 500 GPa. Multiplying these out gives -2.55 Gigapascals of compressive thermal stress in the alumina upon cooling.
Second, for the substrate and PdCr film (12.8 x 10^-6 /K), delta-alpha is 3.4 x 10^-6 /K over the same 875 K drop. With a room-temperature biaxial modulus for PdCr of 265 GPa / (1 – 0.32) = 389.7 GPa, thermal compressive stress in the sensor film comes to -1.16 Gigapascals.
Combining intrinsic deposition stress (-450 MPa for alumina, -280 MPa for PdCr) with thermal mismatch gives net room-temperature compressive stresses of -3.00 Gigapascals in the alumina and -1.44 Gigapascals in the PdCr. When interface fracture toughness drops, compressive fields this high trigger delamination buckling.
A compressive residual stress exceeding 2.5 Gigapascals in the insulating oxide initiates interface shear delamination during thermal cycling down to room temperature.
Delamination buckling occurs once compressive stress passes the Euler threshold for an unbonded segment of length 2b. Critical buckling stress sigma_c is:
sigma_c = ( pi^2 / 12 ) ( E_f / ( 1 – nu_f^2 ) ) ( t_f / b )^2
Once compressive stress sigma_f exceeds sigma_c, the film buckles away from the substrate, driving shear (mode II) and opening (mode I) strain energy release at the crack boundary. Energy release rate G for the buckled strip follows:
G = ( ( 1 – nu_f ) t_f / E_f ) ( sigma_f^2 – sigma_c^2 ) ( 1 + 0.26 ( 1 + nu_f ) ( sigma_c / sigma_f ) )
Delamination spreads when energy release rate G exceeds critical interfacial fracture toughness Gamma_ic. For sputtered alpha-alumina on polished superalloys, Gamma_ic normally measures between 5.0 and 15.0 Joules per square meter. But micro-cracks, contamination, or un-passivated surface flaws can drop Gamma_ic below 2.0 Joules per square meter, leading to adhesive failure during routine thermal cycling.
Ignoring how elastic moduli change with temperature underpredicts interfacial shear forces by up to 35 percent, often causing sensor delamination during the very first heat-up cycle.
Scratch
Assessing interlayer adhesion under lab conditions requires quantitative testing that isolates interface shear failure from bulk deformation. Standard tests apply controlled micro-loads to measure when cohesive cracking or adhesive delamination starts. These figures form the baseline for qualifying materials before sensor patterning.
Choosing an adhesion test means aligning the stress field in the test with the failure modes seen in service. Four standard test methods offer complementary data for qualifying film stacks.
| Test Method | Primary Measurement Metric | Standard Protocol Reference | Dominant Failure Mode Tracked | Sample Preparation Requirements |
|---|---|---|---|---|
| Micro-Scratch Testing | Critical Load L_c1, L_c2, L_c3 (N) | ISO 20502 / ASTM C1624 | Interfacial spallation, conformal track cracking | Polished flat coupon, Ra < 10 nm |
| Four-Point Bend Shear Lag | Interfacial Energy Release Rate G_ic (J/m²) | ASTM E2160 derivative | Steady-state interface crack propagation | Symmetric sandwich beam specimen |
| Nanoindentation Pop-In | Excursion Displacement & Work (nJ) | ISO 14577-4 | Through-thickness plastic shear yield | Cross-sectioned polished mount |
| Micro-Cantilever Deflection | FIB-milled Interface Toughness K_ic (MPa·m^0.5) | Custom micro-mechanical lab protocol | Pure Mode I/II fracture toughness | Focused Ion Beam micromachined pillar |
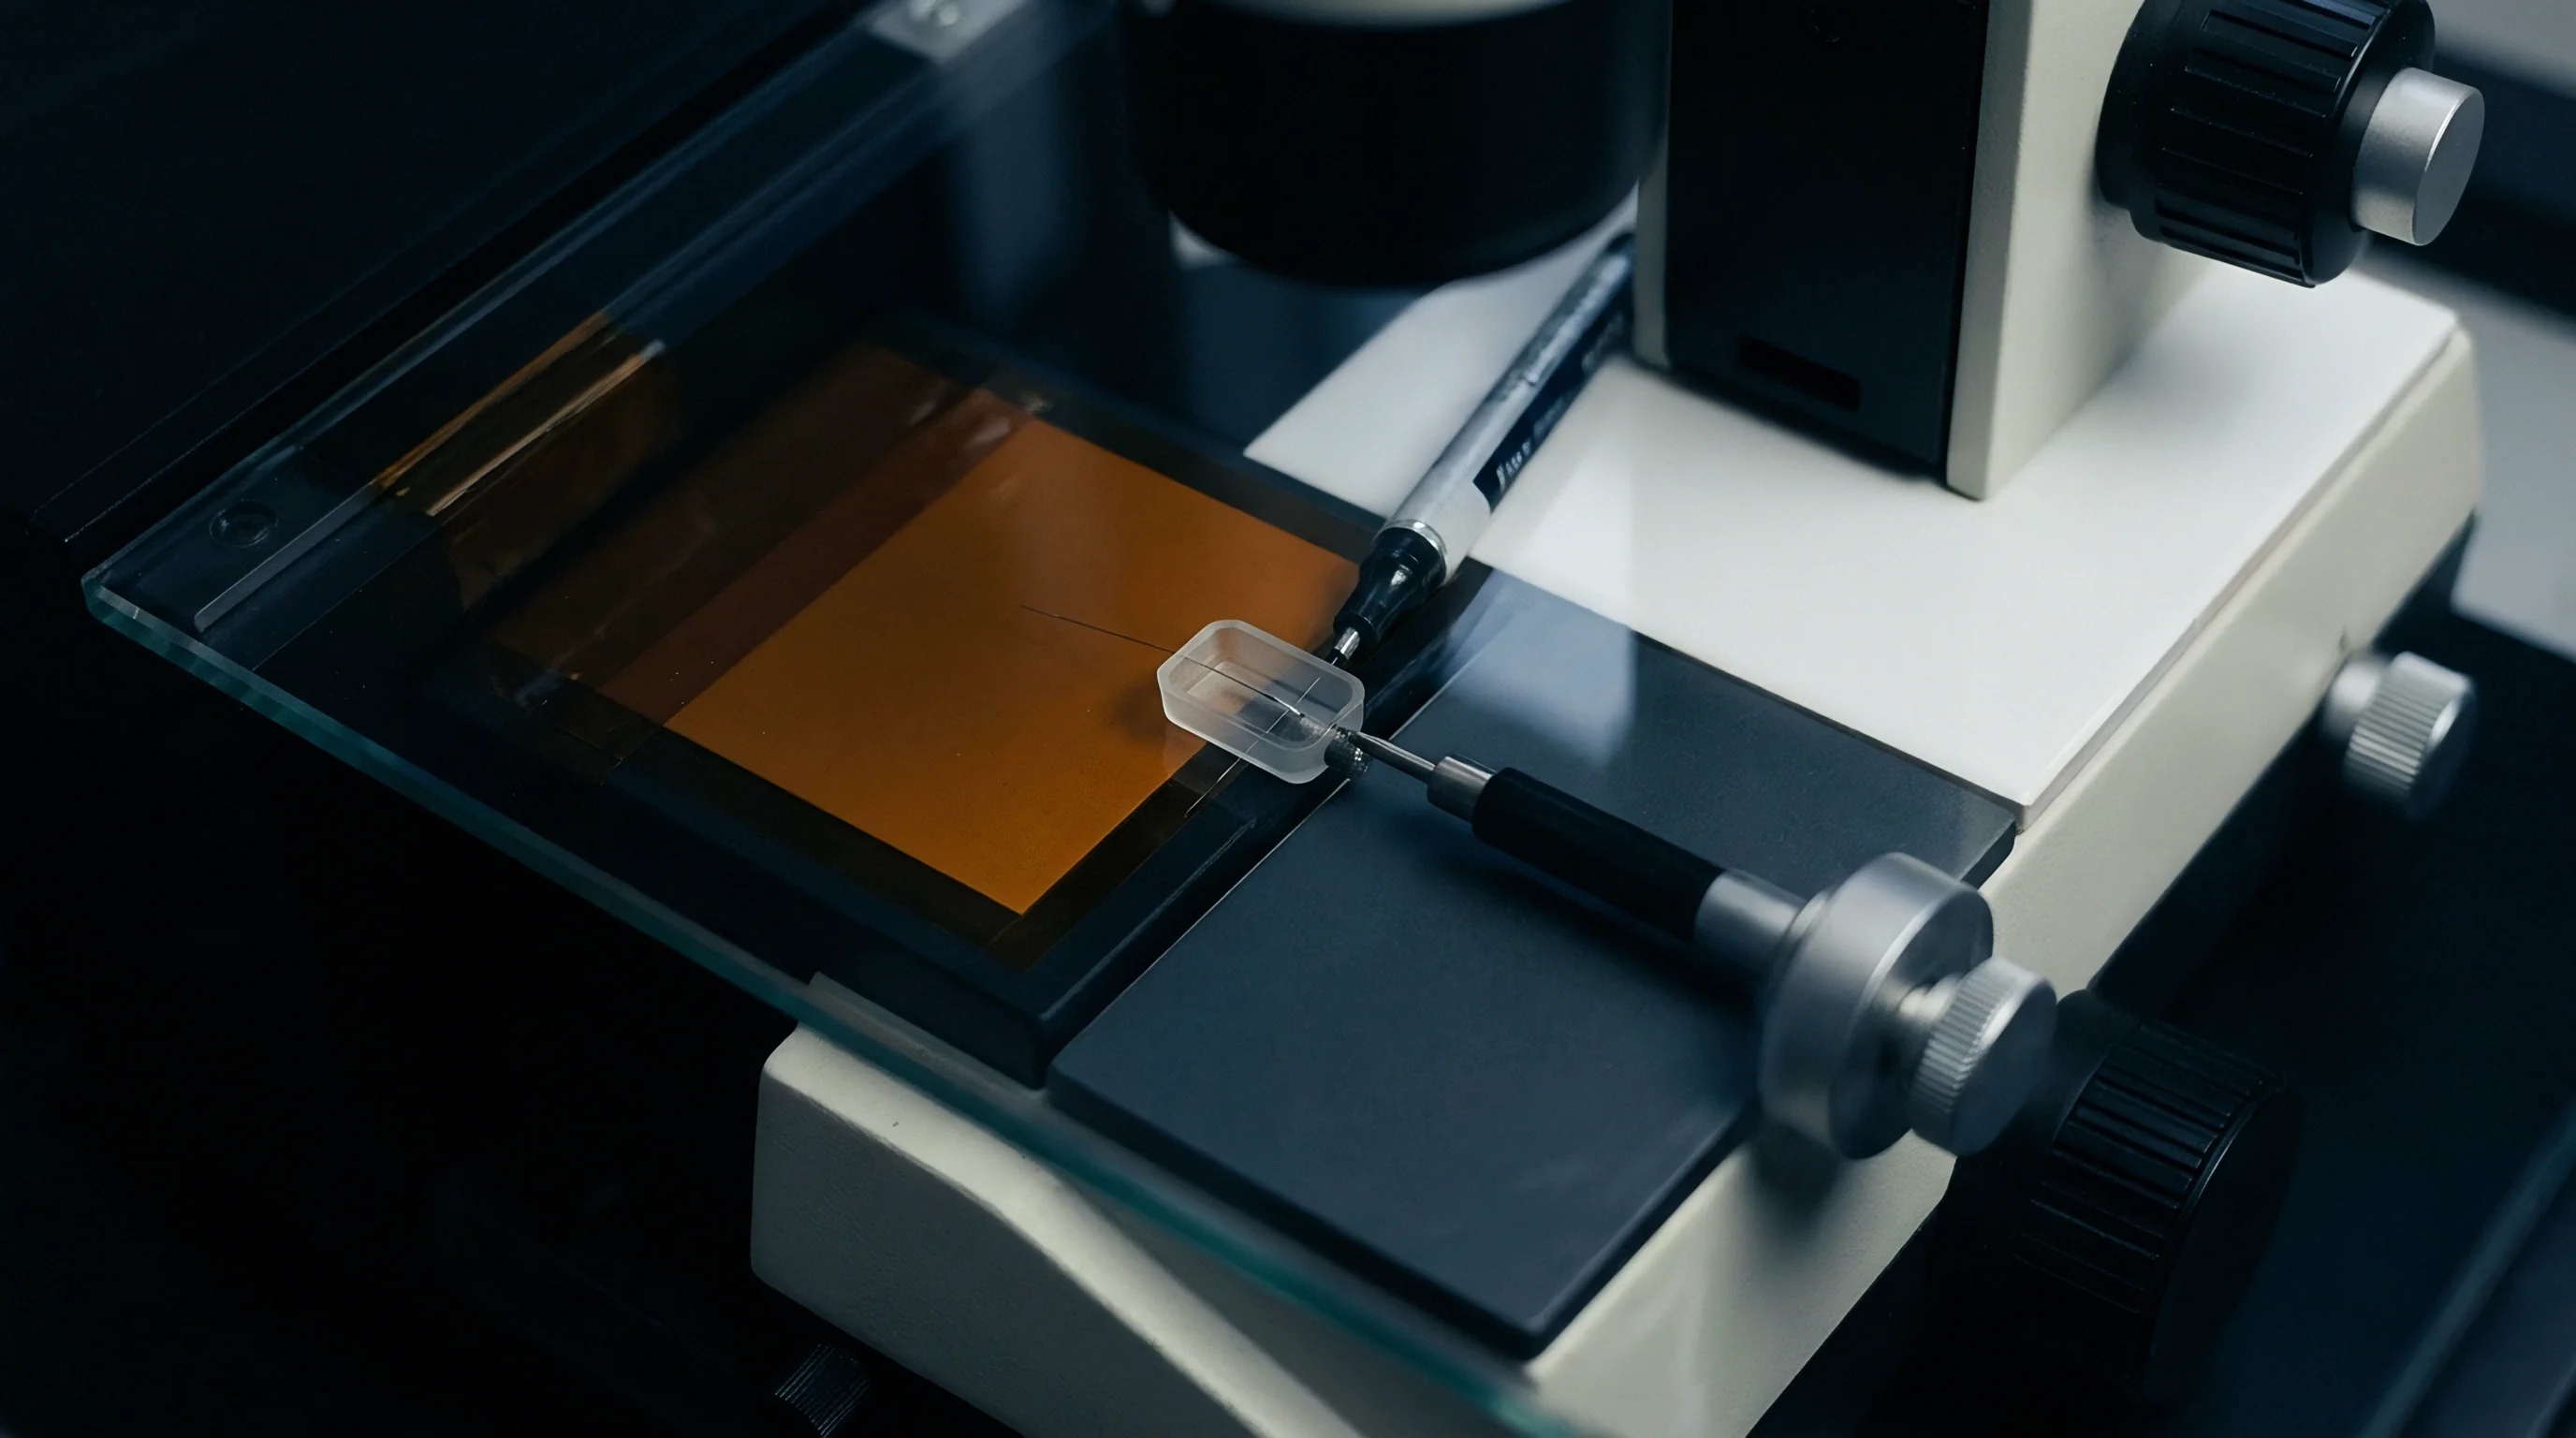
Micro-scratch testing under ISO 20502 and ASTM C1624 is the standard screening tool. A Rockwell C diamond stylus with a 100 to 200 micrometer tip radius moves across the surface under a ramped normal load. Optical microscopy, acoustic emission sensors, and tangential force measurement track three key critical load points.
Running an ISO 20502 micro-scratch test involves the following steps:
- Secure the coated coupon in the automated stage, ensuring surface tilt stays below 0.05 degrees across the full scan length.
- Check the stylus tip with an optical interferometer to confirm its radius is 100 +/- 5 micrometers without flats or embedded debris.
- Zero the acoustic emission sensors and tangential load cells, verifying a signal-to-noise ratio above 40 decibels under static contact.
- Run a progressive load from 0.5 Newtons up to 50.0 Newtons at 10.0 Newtons per minute while moving the stage at 5.0 millimeters per minute.
- Track acoustic amplitude, recording the first peak above baseline as critical load L_c1, which marks cohesive chevron micro-cracking in the dielectric layer.
- Record critical load L_c2 when continuous high-frequency acoustic bursts coincide with a sudden jump in friction coefficient derivative, indicating interfacial spallation along track edges.
- Confirm critical load L_c3 visually when the dielectric delaminates completely and exposes the underlying superalloy across the track width.
- Average the critical loads over at least five valid scratch runs, ignoring any tracks that cross pre-existing polishing scratches or surface inclusions.
Can Scratch Testing Predict Thermal Fatigue Life?
Scratch load values reflect initial mechanical bond strength, but they do not predict thermal fatigue life. Scratch tests apply localized contact shear at room temperature. Operating life at high temperature depends far more on chemical diffusion, creep relaxation in the superalloy, and growing interface oxidation stresses.
A stack with a strong room-temperature L_c3 of 35 Newtons can still delaminate completely within 100 thermal cycles if oxygen diffusion embrittles the bond coat interface. Micro-scratch testing is an effective receiving inspection tool, not a service life predictor.
Four-point bend testing provides a geometry-independent measure of interfacial fracture energy. Bonding the coated substrate to an uncoated backing beam of matching elastic properties creates a symmetrical sandwich. A notch cut through the upper beam guides a crack down to the interface, where it turns along the dielectric boundary.
Four-point loading then yields a region of steady interfacial crack growth.
Interfacial fracture energy G_ic is calculated from the critical bending moment M_c per unit width b:
G_ic = ( ( 1 – nu_s^2 ) M_c^2 ) / ( 2 E_s I_s ) ( 1 – ( I_s / I_comp ) )
Here E_s and nu_s are the substrate elastic constants, I_s is the moment of inertia for the single uncracked beam, and I_comp is that of the two-layer composite region. Removing residual stress terms from the steady-state equation makes this a clean baseline for comparing interface treatments.
Thermal delamination stems from bond preparation flaws rather than handling shock.

Diffusion
High heat drives atomic migration across material boundaries. This thermally activated transport changes the elemental distribution, stoichiometry, and phases across thin film interlayers. Chemical reactions among dielectric oxides, metallic bond coats, piezoresistive tracks, and the surrounding atmosphere weaken the mechanical bond and drift sensor resistance.
Solid-state diffusion follows Fick’s laws, with diffusion coefficient D obeying an Arrhenius relationship:
D = D_0 exp( – Q / ( R T ) )
Where D_0 is the frequency factor, Q is activation energy for diffusion, R is the gas constant, and T is temperature in Kelvin.
Chromium migration is a key failure mode in palladium-chromium (PdCr) gauges. At room temperature, palladium-13% weight chromium forms a stable piezoresistive element with a low temperature coefficient of resistance (TCR). Above 700°C, strong thermodynamic driving forces push chromium atoms rapidly toward the surface to form chromium oxide.
Depleting chromium from the bulk changes the alloy balance. Once local chromium drops below 10 weight percent, TCR climbs rapidly, causing thermal output to drift. At the same time, chromium reaching the surface reacts with ambient oxygen to form porous Cr2O3 scale.
The volume expansion from oxidation generates tensile stresses that chip away the protective capping layer.
Interdiffusion at the substrate interface degrades the bond coat. Inconel 718 consists of nickel, iron, chromium, niobium, and molybdenum. During long exposures at 900°C, nickel migrates outward into the MCrAlY bond coat while aluminum diffuses inward into the substrate.
This two-way flux creates a vacancy imbalance known as the Kirkendall effect.
Kirkendall voids coalesce along the interface between bond coat and alumina dielectric, growing from 50 to 500 nanometers in size. This voiding reduces actual contact area, cutting fracture toughness Gamma_ic by up to 60 percent after 200 hours at 950°C. The void network acts like an established crack system, allowing delamination under relatively low thermal mismatch stress.
Oxygen transport through the dielectric is another major vulnerability. Dense alpha-alumina blocks oxygen effectively below 900°C, but vapor-deposited films often contain column boundaries, grain defects, or metastable phases that act as fast paths. Oxygen species migrate down these short circuits to reach the underlying MCrAlY bond coat.
At the bond coat, oxygen reacts with aluminum to form a thermally grown oxide (TGO) scale of alpha-alumina. TGO growth follows parabolic kinetics, where thickness h_tgo scales with exposure time t:
h_tgo = sqrt( k_p t )
Where k_p is the parabolic oxidation rate constant for the given alloy and temperature.
TGO growth creates substantial internal stress. Converting aluminum to ceramic alumina involves a volume expansion ~ the Pilling-Bedworth ratio for aluminum is 1.28. Because the surrounding material constrains this expansion, compressive growth stress inside the TGO reaches up to 1.0 Gigapascal at operating temperature.
Cooling down combines this growth stress with thermal mismatch, producing strong out-of-plane tensile forces across the oxide boundary.
Interfacial Kirkendall void accumulation reduces net bonded contact area, causing critical adhesion energy to decay exponentially with high-temperature exposure time.
Phase transformations in the dielectric layer also cause sharp volume changes. Yttria-stabilized zirconia (YSZ) used for thermal isolation will transform if yttria levels drop too low. As it cools through 950°C, unstabilized zirconia shifts from tetragonal to monoclinic phase, expanding 3 to 5 percent in volume.
That sudden expansion produces localized shear strains that snap nearby sensor tracks immediately.
Continuous subsurface chemical transport shifts the stress state at the interface, making post-deposition room-temperature inspection a poor indicator of long-term stability.
Whether atomic layer deposition (ALD) barriers can suppress grain boundary oxygen transport above 1100°C in oxygen-rich environments remains an open question ~ or whether stress-induced lattice distortion will inevitably open new diffusion paths.

Decay
Mechanical stress and chemical degradation impair strain readings long before a gauge delaminates completely. Micro-cracking, partial debonding, and shear relaxation degrade how efficiently strain transfers from substrate to piezoresistor. This shows up as gauge factor loss, wider hysteresis, thermal output wander, and severe zero drift.
Strain transfer depends on shear continuity across every layer. Ideally, axial strain in the substrate passes through bond coat and dielectric into the gauge grid without loss. Once interface shear strength degrades from micro-voids or partial debonding, shear lag sets in within the dielectric.
Theoretical strain transfer efficiency k_trans for a gauge of length 2L under uniaxial strain is given by:
k_trans = 1 – ( cosh( Gamma L ) / cosh( Gamma L ) )
Where shear lag parameter Gamma depends on stack geometry and material stiffness:
Gamma = sqrt( ( G_d ) / ( E_f t_f t_d ) )
Where G_d is dielectric shear modulus, E_f is gauge film elastic modulus, t_f is gauge thickness, and t_d is dielectric thickness. As micro-cracking reduces effective shear modulus G_d, Gamma drops and pulls k_trans below unity. Lower strain transfer lowers the effective Gauge Factor (GF), causing the sensor to systematically under-report strain.
| Uncertainty Component Source | Standard Uncertainty Value | Probability Distribution Type | Sensitivity Coefficient | Combined Uncertainty Contribution |
|---|---|---|---|---|
| Dielectric Shear Lag (G_d Decay) | 1.45% of reading | Rectangular | 1.00 | 0.837% of reading |
| Interfacial Kirkendall Voiding | 2.10% of reading | Normal (k=1) | 0.85 | 1.785% of reading |
| Piezoresistor Cr Migration Drift | 4.2 microstrain/hr | Normal (k=1) | 250 hrs | 1050 microstrain |
| Thermal Output Hysteresis (Cyclic) | 125 microstrain | Triangular | 1.00 | 51.0 microstrain |
| Reference Instrument Calibration | 0.15% of reading | Normal (k=2) | 1.00 | 0.075% of reading |
Zero-point drift is the largest source of error in static high-temperature measurement. It combines metallurgical composition changes in the piezoresistor with stress relaxation across the interlayers. At 900°C, unpassivated PdCr gauges drift faster than 15 microstrain per hour over their first 50 hours before settling to a linear rate near 3.5 microstrain per hour.
Thermal output ~ or apparent strain ~ is the resistance change caused solely by temperature. It combines the alloy’s TCR with the expansion mismatch between gauge and substrate:
epsilon_apparent = ( ( alpha_sub – alpha_gauge ) + ( TCR / GF_0 ) ) delta_T
Here GF_0 is nominal room-temperature gauge factor. When thermal cycling degrades the interface, strain fields around the gauge track become non-uniform, causing thermal output hysteresis. Cycling to 900°C and back to 25°C can leave an unrecovered offset over 300 microstrain, ruining calibration.
Qualification screening must catch unstable sensor lots before they are installed on expensive hardware.
Production batches should undergo standard acceptance checks prior to integration:
- Baseline Insulation Check measures dielectric resistance at 100 Volts DC, rejecting sensors below 500 Megaohms at room temperature or below 50 Megaohms at 800°C.
- Thermal Cycling Stabilization ramps test coupons five times from 100°C to 950°C at 20°C per minute, requiring zero-point shift between cycles 2 and 5 to remain under 50 microstrain.
- Gauge Factor Verification measures output on a calibrated four-point bending beam at 200°C increments up to max temperature, capping allowable GF drop at 3.0 percent across the full range.
- Micro-Scratch Acceptance Screening requires a minimum critical delamination load L_c3 of 25 Newtons on witness coupons co-deposited with the batch.
Building an uncertainty budget requires compiling individual contributions per ISO/IEC Guide 98-3 (GUM). Applying a coverage factor of k=2 gives an expanded uncertainty representing a 95 percent confidence interval.
For a gauge operating at 900°C over 250 hours, combined calculations show that chemical drift and shear lag dominate total error. Expanded uncertainty reaches +/- 4.8 percent of reading for dynamic strain and +/- 2150 microstrain for static strain, underlining how crucial interlayer stability is to reliable measurement.
According to ISO 10012 Section 7.2.3, “The organization shall ensure that measurement error and drift identified during calibration testing are incorporated into risk calculations when sensor performance degrades past specified acceptance boundaries.”

Contract
Specifying high-temperature gauges for procurement requires explicit acceptance criteria in the contract. Vendors frequently quote room-temperature numbers while leaving out long-term drift, thermal hysteresis limits, and adhesion thresholds under actual operating conditions. A proper technical specification translates physical interface requirements into clear contractual terms.
Purchasing docs must define receiving inspection, witness coupon rules, and sampling limits. Test standards, failure thresholds, and re-test rules need to be spelled out to avoid disputes after delivery.
Technical specifications should include six mandatory requirements:
- Witness Coupon Co-Deposition requires suppliers to run witness coupons in the same chamber batch as the parts, matching alloy, surface finish, and thermal history.
- Interfacial Critical Load Floor mandates that witness coupons tested to ISO 20502 show micro-scratch delamination loads L_c3 above 30 Newtons as-deposited and above 18 Newtons after a 100-hour soak at 900°C.
- Dielectric Purity Certification requires target material analysis showing trace alkali metals (Na, K, Li) below 5 parts per million and total heavy metals below 20 parts per million.
- Thermal Drift Limits caps isothermal zero drift at 900°C to 5.0 microstrain per hour after a 24-hour burn-in.
- Apparent Strain Hysteresis Limit requires completed gauges cycled between 25°C and 900°C at 10°C per minute to keep hysteresis loops within 150 microstrain at any temperature.
- Batch Rejection Criteria stipulates that if over 5 percent of sample coupons fail scratch or insulation checks, the entire lot is rejected without re-sorting privileges.
Deposition pricing scales directly with interface testing requirements. Unscreened coating without witness testing is cheaper up front, but leaves all thermal failure risk with the buyer. Full qualification packages ~ with high-temperature scratch testing, post-anneal void analysis, and 100-hour drift verification ~ add noticeable cost to the order, but paying for certified qualification prevents expensive failures during full-scale engine testing.
Across multiple deposition runs, full incoming verification raises upfront sensor cost by roughly 35 percent while cutting high-temperature test cell abort risks by over 80 percent.
Contracting documents should clearly split unit pricing from ongoing verification and calibration expenses. Buyers who leave adhesion specs out of their procurement contracts carry the full cost of test rig downtime when unqualified layers delaminate in service.