Transducer Lot Acceptance Thermal Dwell Sampling Protocols
Verify transducer internal core thermal equilibrium with calculated multi-time-constant dwells before executing c=0 acceptance sampling against guardbanded limits.
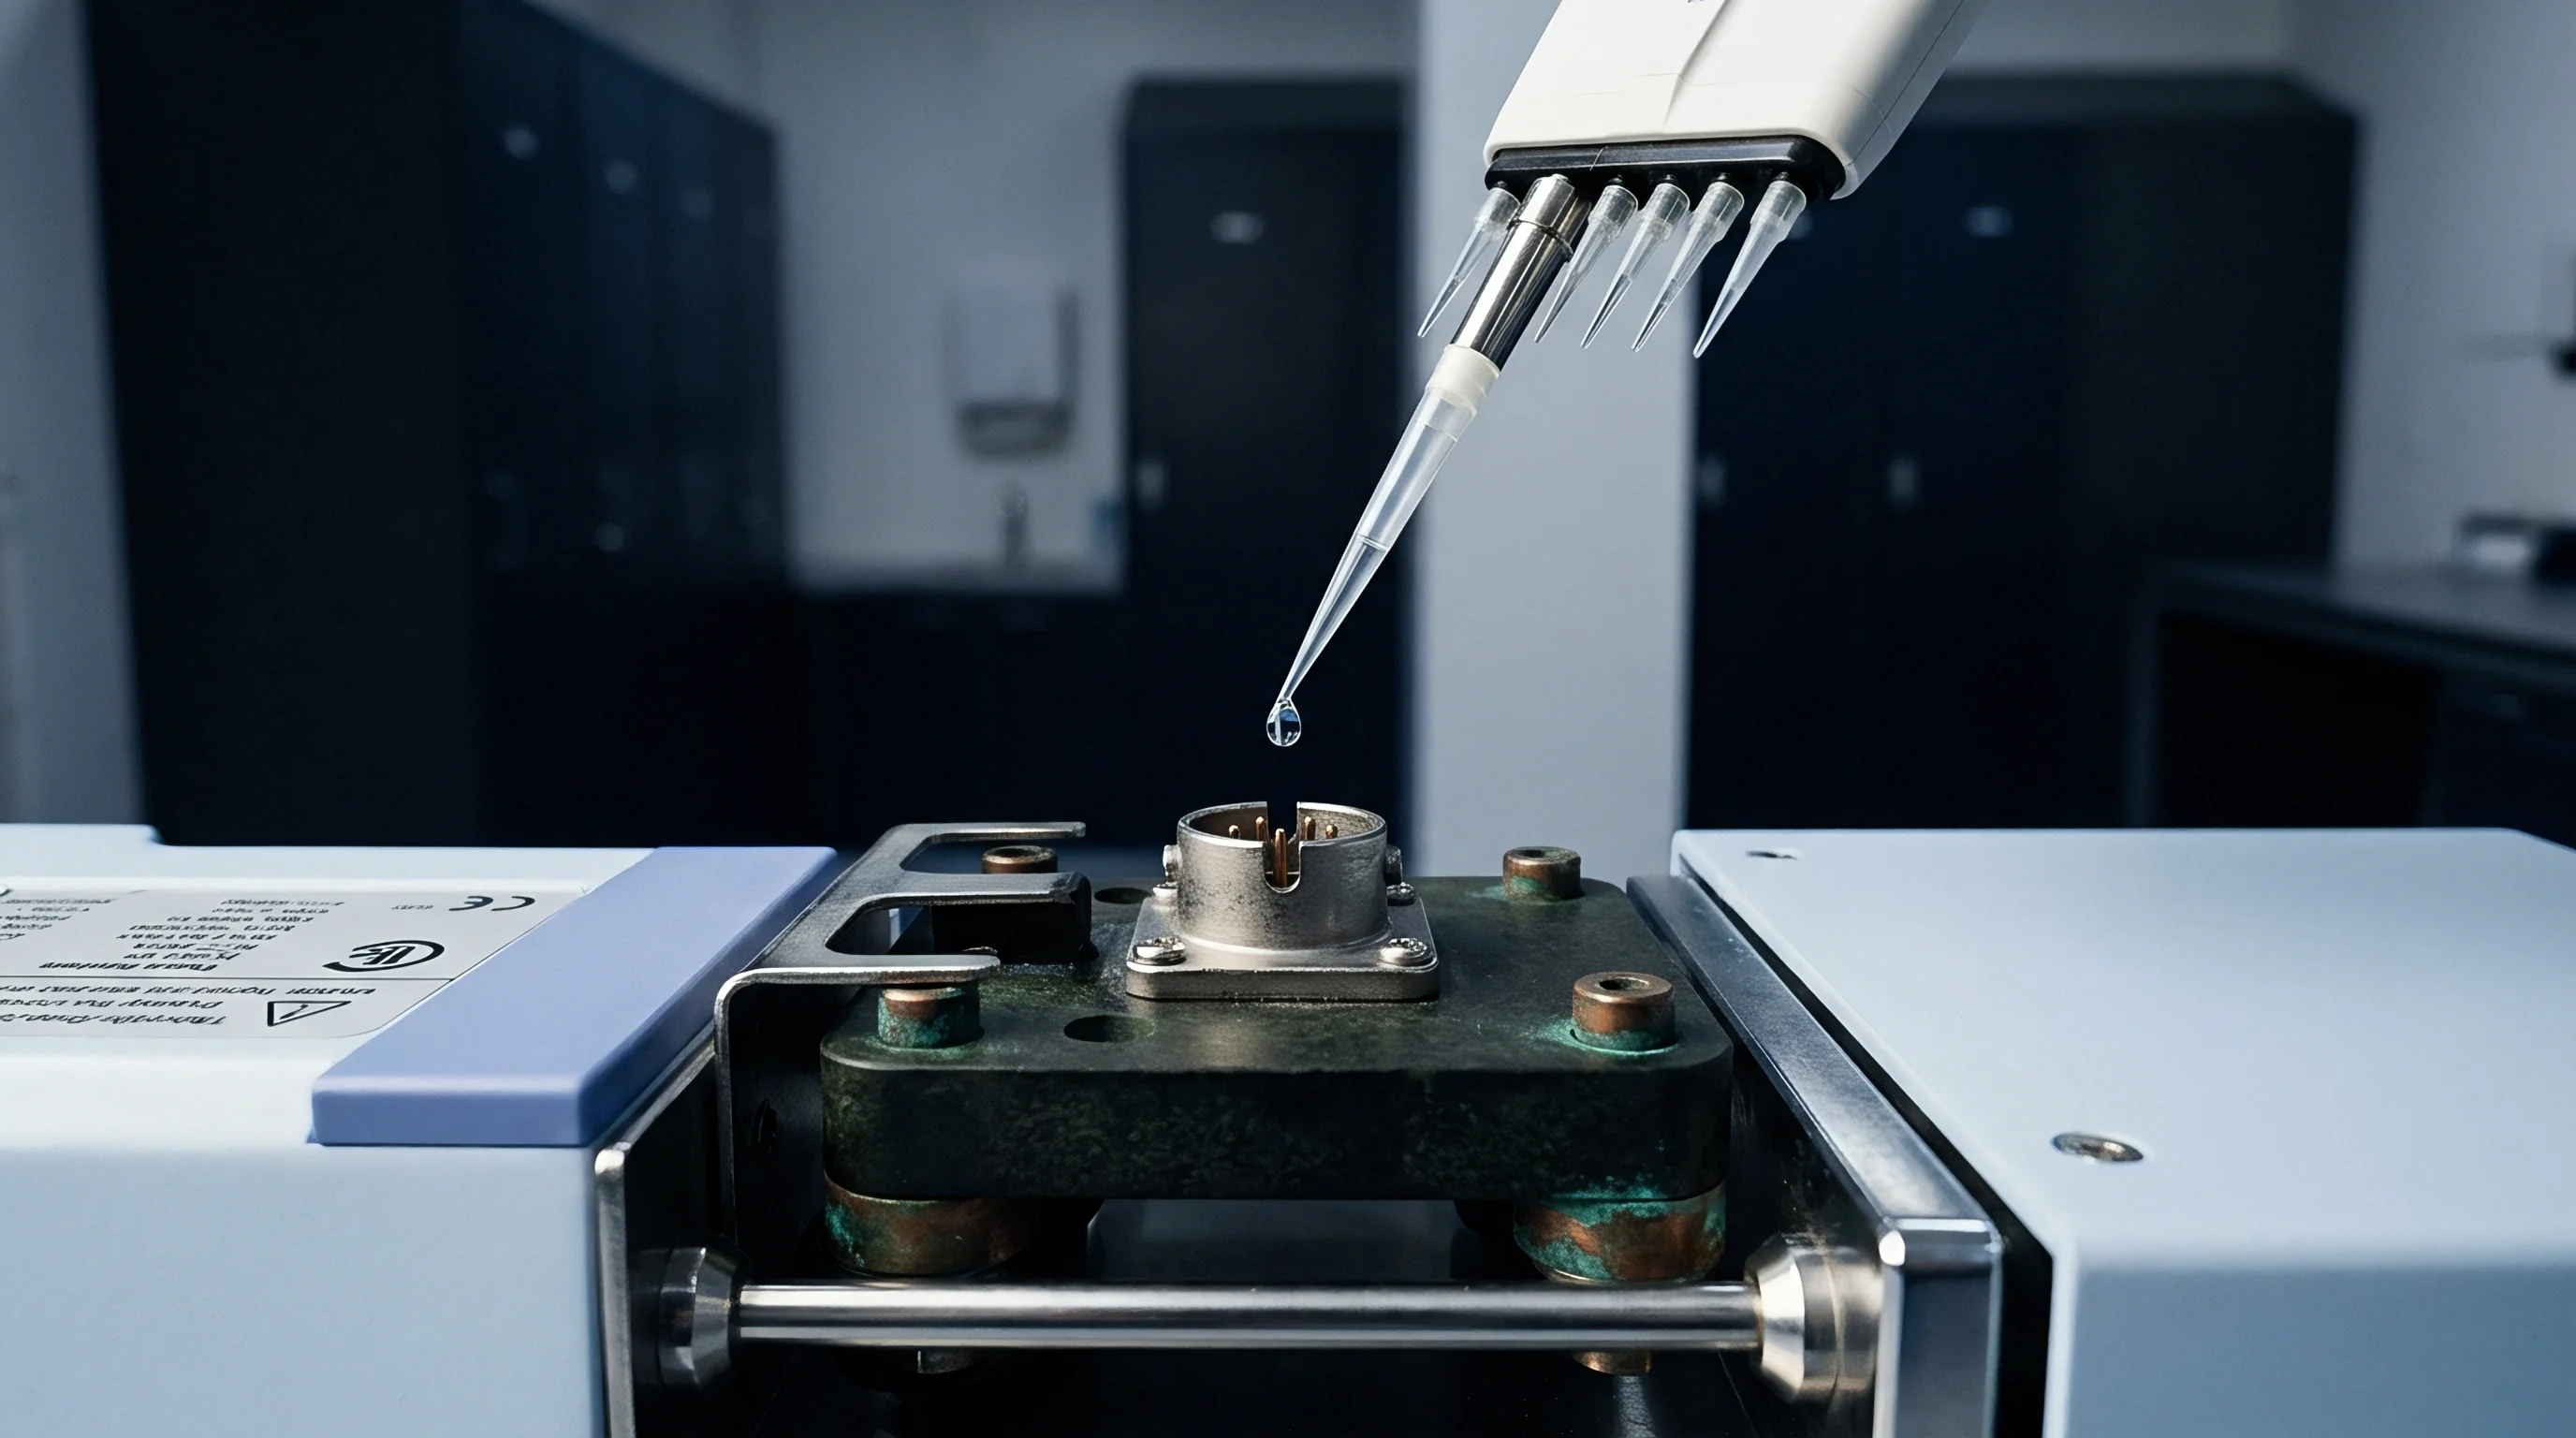

Soak

Thermal Equilibrium Verification Criteria
Thermal dwell begins only when the core sensing element matches chamber air within a documented boundary. Surface temperature probes fail to reveal internal thermal equilibrium across heavy stainless steel pressure ports or encapsulated piezoresistive headers. An internal temperature gradient of 0.5 degrees Celsius across a differential silicon die introduces bridge imbalance that mimics true pressure drift.
Verification protocols require embedded dummy transducers fitted with core thermocouples to log the true thermal time constant of the mechanical assembly under varying air velocities.
Chamber air reaches setpoint rapidly. Metal housing lags behind. For an isolated pressure transmitter weighing 450 grams, air setpoint stabilization at 125 degrees Celsius occurs inside eight minutes, whereas the internal oil fill and diaphragm stack require 42 minutes to cross the 99 percent thermal stabilization threshold.
Premature initiation of the dwell clock yields false span shifts during lot acceptance, rejecting stable production batches. Dwell intervals range between 30 and 120 minutes depending on mass, housing volume, and internal potting compounds.
A dwell timer started upon chamber air stabilization corrupts thermal span verification by capturing structural expansion gradients rather than steady state sensor performance.
Chamber air speed alters convective heat transfer coefficients across the lot. Packed test fixtures create stagnant boundary layers on central carriers while perimeter transducers experience forced convection exceeding two meters per second. This thermal disparity causes uneven soak durations across a single tray.
Uniformity surveys conforming to IEC 60068-2-14 define working zones within plus or minus 1.0 degree Celsius. Transducer fixtures outside this volume yield invalid acceptance data.
Reaching steady state eliminates dynamic pyroelectric and piezoresistive transient artifacts. Piezoresistive bridges show significant offset anomalies during active heating cycles due to disparate thermal expansion coefficients among silicon, glass frit, and kovar headers. Once thermal stabilization finishes, these transient strains dissipate, exposing true uncompensated thermal zero shift.
Protocol specifications isolate this steady state offset before pressure or force excitation applies.
The operational consequence lands on cycle efficiency. Extending soak durations past five time constants ties up capital equipment without tightening measurement uncertainty. Halving the duration injects transient noise into calibration records, triggering supplier disputes.
A protocol anchors soak termination to direct physical measurement rather than arbitrary elapsed time.

Sampling
Acceptance Schemes under Varied Lot Sizes
Lot acceptance testing relies on statistical risk allocation between buyer and vendor. Standard sampling tables balance inspection overhead against defect escape probabilities. ANSI/ASQ Z1.4 normal single sampling plans define sample size code letters and acceptance quality limits for non-destructive inspection stages.
When testing exposes transducers to long thermal dwell profiles, test bay throughput constraints dictate reduced sample sizes coupled to tighter acceptance numbers.
Zero-defect sampling schemes derived from squareroot-of-N-plus-one logic lack statistical defensibility for safety-critical instrumentation. An acceptance number of zero (c=0) plans developed by Nicholas Squeglia provide equivalent consumer protection with substantially smaller sample counts than standard attribute tables. For a lot size of 1,200 pressure transducers, a standard normal inspection level II with an AQL of 0.4 percent demands 125 units with one permitted defect.
An indexed c=0 plan achieves comparable lot protection using 32 units, rejecting the shipment on a single non-conformance.
| Lot Range | ANSI Z1.4 Normal II (AQL 0.65) | ANSI Z1.4 Tightened (AQL 0.65) | Squeglia c=0 (AQL 0.65) | Squeglia c=0 (AQL 0.25) |
|---|---|---|---|---|
| 151 to 280 | 32 units (Ac=0, Re=1) | 32 units (Ac=0, Re=1) | 13 units (Ac=0, Re=1) | 29 units (Ac=0, Re=1) |
| 281 to 500 | 50 units (Ac=1, Re=2) | 50 units (Ac=0, Re=1) | 16 units (Ac=0, Re=1) | 34 units (Ac=0, Re=1) |
| 501 to 1,200 | 80 units (Ac=1, Re=2) | 80 units (Ac=0, Re=1) | 19 units (Ac=0, Re=1) | 42 units (Ac=0, Re=1) |
| 1,201 to 3,200 | 125 units (Ac=2, Re=3) | 125 units (Ac=1, Re=2) | 23 units (Ac=0, Re=1) | 50 units (Ac=0, Re=1) |
| 3,201 to 10,000 | 200 units (Ac=3, Re=4) | 200 units (Ac=1, Re=2) | 29 units (Ac=0, Re=1) | 60 units (Ac=0, Re=1) |
Attribute inspection categorizes parts strictly as pass or fail against fixed error bands. Variable sampling per ANSI/ASQ Z1.9 utilizes measured continuous performance data, calculating lot mean and standard deviation relative to upper and lower specification limits. Variable plans achieve identical statistical confidence with roughly one-third the sample size of attribute screening.
A batch of 500 load cells requires 35 units under variable inspection compared to 80 under attribute rules, drastically curtailing chamber operational hours.
Variable sampling plans demand normal distribution of the evaluated parameters across the lot. Thermal zero coefficient data frequently exhibits mild skewness caused by batch-level silicon wafer dopant gradients. If normality tests fail the Kolmogorov-Smirnov test at the 0.05 alpha level, the quality engineer discards variable sampling and reverts to attribute screening.
Retaining variable plans under skewed data produces unjustified lot releases.
ISO 2859-1 switching rules govern transitions between normal, tightened, and reduced inspection based on vendor history. When two out of five consecutive lots experience rejection under normal inspection, the buyer moves receiving inspection to tightened tables. Tightened thermal screening eliminates non-zero acceptance numbers, raising dwell sample sizes.
Suppliers absorb the cost of delayed batch clearings until five consecutive lots pass incoming screens without non-conformances.

Dwell
Soak Duration Calculation Principles
Specifying arbitrary soak intervals introduces uncontrolled uncertainty into lot acceptance. Accurate dwelling balances thermal diffusion rates through varied transducer materials. Analytical evaluation relies on the Biot number, representing the ratio of internal conductive resistance to external surface convective resistance.
If the Biot number falls below 0.1, the assembly behaves as a lumped capacitance system, heating uniformly throughout its mass.
Industrial pressure and force transducers combine dense metals and insulating ceramics, pushing the Biot number above 1.0. Heat transfer models must resolve internal spatial temperature profiles over time. The fundamental time constant relates system mass, surface area, material density, specific heat, and fluid convection coefficients.
Fourier field analysis dictates total soak time for cylindrical assemblies. The equation for transient heat conduction through multi-layered geometries defines the thermal diffusion rate:
t = – (rho V c_p / (h A_s)) ln((T_t – T_inf) / (T_0 – T_inf))
The variable rho represents component density in kilograms per cubic meter, V is volume, c_p is specific heat capacity in Joules per kilogram Kelvin, h is the convective heat transfer coefficient in Watts per square meter Kelvin, A_s is effective surface area, T_t is core temperature at time t, T_inf is environmental chamber temperature, and T_0 is initial temperature. Transducer housings using 17-4 PH stainless steel show thermal diffusivities near 4.4 square millimeters per second. Internal electronics potting silicones display diffusivities near 0.15 square millimeters per second, acting as thermal insulators that slow internal stabilization.
A minimum dwell duration equivalent to five calculated time constants ensures the core transducer element reaches 99.3 percent of the chamber ambient step change.
Calculating stabilization across a subsea depth transmitter demonstrates dwell modeling. The assembly weighs 1.2 kilograms with an outer diameter of 45 millimeters, a length of 140 millimeters, and internal silicone gel encapsulation around the sensing element. Convective airflow in the chamber runs at 1.5 meters per second, producing a convective coefficient h of 38 Watts per square meter Kelvin.
The overall effective assembly time constant calculates to 14.2 minutes. Three time constants yield 95.0 percent convergence, leaving a 2.5 degree error during a 50 degree thermal excursion. Five time constants demand 71 minutes of dwell to guarantee residual thermal error stays below 0.35 degrees Celsius.
The supplier argued that thirty minutes was the standard factory duration across all catalog models.

Shift

Thermal Zero and Sensitivity Drift Mechanics
Thermal excursions induce two distinct error modes in precision transducers: Thermal Zero Shift and Thermal Sensitivity Shift. Thermal zero shift represents a parallel translation of the input-output transfer curve across temperature, independent of applied measurand. Thermal sensitivity shift alters the slope of the calibration curve, scaling proportionately with input stimulus.
Isolating these mechanisms during lot acceptance requires interleaved reference measurement sequences at cold, ambient, and elevated soak plateaus.
Zero shift originates primarily from mechanical packaging stresses. Differential coefficients of thermal expansion between structural materials generate localized bending moments across strain gauges or capacitive diaphragms. Grade 316L stainless steel expands at 16.0 microstrain per degree Celsius, whereas silicon elements expand at roughly 2.6 microstrain per degree Celsius.
Header joints brazed at high temperatures freeze residual stresses that relax or amplify as test temperatures cycle between minus 40 and 125 degrees Celsius.
- Mechanical zero hysteresis occurs when elastomeric seals or packaging adhesives undergo viscoelastic creep under thermal dwell, failing to return to base electrical balance upon re-stabilization at room temperature.
- Bridge resistance drift tracks metallurgical degradation of internal thin-film resistors, causing uncompensated span offsets exceeding 0.02 percent of full scale per thermal cycle.
- Potting compound pressure develops as curing resin thermal expansion volumetric coefficients exceed metal enclosure volumes, exerting hydrostatic loads directly onto the die.
- Fill fluid degassing introduces compliant gas pockets into oil-filled capsules, decoupling diaphragms and causing temperature-dependent span errors during long soak periods.
Sensitivity shifts stem from fundamental material properties. The piezoresistive gauge factor of doped silicon drops systematically with increasing temperature, exhibiting coefficients between minus 0.15 and minus 0.2 percent per degree Celsius. Uncompensated sensors lose significant signal amplitude at upper thermal dwell points.
Signal conditioning electronics incorporate compensation resistors or digital correction algorithms in EEPROM look-up tables to neutralize these physical drops.
Lot acceptance protocols evaluate compensation performance by validating accuracy against the manufacturer Total Error Band specification. While datasheets isolate Thermal Error Band as a distinct line item, field performance depends on composite uncertainty including non-linearity, thermal zero shift, thermal span shift, and thermal hysteresis. Acceptance sampling fails any unit whose combined deviation exceeds the allowable boundary during dwell transitions.
The standard contract line states that lot acceptance thermal testing must execute per ISO 10012 measurement management controls, invalidating acceptance lots processed on reference instruments lacking accredited calibrations across the specified thermal spectrum.

Audit

Which Sequence Validates True Thermal Hysteresis?
A simple three-point temperature cycle masking path dependency fails to uncover severe mechanical hysteresis. Transducer materials absorb strain energy along different crystal dislocations depending on whether the temperature plateau approaches from a cooling or a heating trajectory. A robust qualification protocol enforces closed-loop cyclical testing that visits ambient conditions between thermal extremes.
The optimal thermal validation path executes a five-step baseline cycle: ambient baseline, cold dwell soak, ambient recovery, hot dwell soak, and final ambient return. Verification readings occur at the conclusion of every dwell interval. Comparing the initial ambient baseline to intermediate and final ambient measurements uncovers permanent structural set, zero return shift, and seal distortion introduced by the dwell extremes.
| Step Stage | Target Temperature | Minimum Dwell Time | Data Verification Points |
|---|---|---|---|
| 1. Initial Reference | 23 degrees Celsius plus or minus 2 | 45 minutes post stabilization | Zero, 50 percent, 100 percent Span |
| 2. Minimum Rating | Minus 40 degrees Celsius | 75 minutes post stabilization | Zero, 50 percent, 100 percent Span |
| 3. Midpoint Return | 23 degrees Celsius plus or minus 2 | 60 minutes post stabilization | Zero, 50 percent, 100 percent Span |
| 4. Maximum Rating | 125 degrees Celsius | 90 minutes post stabilization | Zero, 50 percent, 100 percent Span |
| 5. Final Ambient | 23 degrees Celsius plus or minus 2 | 60 minutes post stabilization | Zero, 50 percent, 100 percent Span |
Pressure transducers intended for aerospace fuel systems show tight margins. In a worked analysis, evaluate a 10-bar absolute pressure sensor rated at 0.1 percent Full Scale composite accuracy from minus 40 to 125 degrees Celsius. Permissible total error spans 10 millibar.
At minus 40 degrees Celsius, the transducer reads 9.994 bar at full load. At 125 degrees Celsius, it reads 10.008 bar. The unit meets individual temperature limits.
Upon returning to Step 5 ambient baseline, the zero output registers an offset of plus 14 millibar above the Step 1 baseline due to internal glass frit strain relaxation. The lot acceptance test records a failure despite compliant readings at temperature extremes.
Verification fixtures must isolate applied measurement pressure from line-temperature effects. Hydraulic or pneumatic lines entering the thermal chamber conduct ambient heat into or out of the transducer body, creating local heat sinks. High-pressure stainless steel tubing requires a minimum of one meter coiled inside the chamber to ensure the pressurizing medium reaches thermal parity with the chamber air before entering the test unit port.
Omitting intermediate ambient recovery steps saves four hours of chamber operation while blinding quality verification to plastic deformation within internal bond wires and silicon diaphragms.

Margin
Uncertainty Budgets inside Environmental Chambers
Lot acceptance testing inside an environmental chamber degrades the test measurement uncertainty ratio. In ambient metrology laboratories, a 4:1 test uncertainty ratio remains standard. Introducing wide thermal variations into the test environment impairs reference sensor precision, shifts cable impedances, and destabilizes excitation power supplies.
Unless the measurement setup uncertainty is quantified per JCGM 100 guidelines, the buyer risks accepting out-of-tolerance transducers or rejecting compliant product.
Test measurement uncertainty incorporates multiple physical components that expand when lines cross chamber walls:
- Reference calibrator temperature coefficient alters deadweight tester piston areas or resonant silicon quartz gauge baselines when operating outside controlled room conditions.
- Chamber spatial temperature gradient creates systematic offset between monitoring thermocouples and internal transducer sensing dies.
- Excitation lead wire resistance variation introduces uncompensated voltage drops in four-wire strain gauge bridges across long temperature-rated wiring harnesses.
- Data acquisition system cold junction compensation drifts inside portable logging racks exposed to changing ambient temperatures near chamber exhaust ports.
Guardbanding provides the engineering resolution to expanded test uncertainty. Under standard consumer risk paradigms, the nominal acceptance boundary contracts by the expanded uncertainty value U at a 95 percent confidence level (coverage factor k=2). When a transducer specification dictates an allowable error band of plus or minus 0.25 percent Full Scale, and the calculated chamber test uncertainty totals 0.06 percent Full Scale, the effective acceptance limit tightens to plus or minus 0.19 percent Full Scale.
Acceptance boundaries must contract by the expanded test system uncertainty to prevent supplier risk transfer during lot screening.
Suppliers frequently contest guardbanded acceptance thresholds, arguing that compliant units falling within the uncertainty zone represent commercial losses from false rejection. Contract terms eliminate this dispute by citing ISO 14253-1 decision rules, establishing that the party performing the verification bears the burden of measurement uncertainty unless explicitly altered in procurement documents.
Deploying reference standards inside the environmental chamber exposes expensive calibrators to thermal fatigue. Skilled test engineers locate reference barometers and pressure controllers outside the hot and cold zones, routing isolated, trace-heated pneumatic manifolds into the chamber interior. This arrangement confines temperature coefficient drift entirely to the device under test, preserving laboratory-grade test uncertainty ratios without complex mathematical corrections.
Improperly characterized thermal measurement uncertainty leaves quality agreements vulnerable to endless reconciliation testing when receiving inspection numbers diverge from factory release documentation.

Yield

Commercial Tradeoffs in Screening Protocols
Tightening thermal dwell sampling protocols escalates procurement costs and manufacturing lead times. Environmental chamber time represents a capital-intensive bottleneck in transducer production facilities. Running a 100 percent screening protocol with eight-hour multi-temperature cycles can exceed the core fabrication cost of the sensor itself.
Sourcing authorities must evaluate the balance between sampling depth and the financial exposure of downstream field failures.
A detailed cost analysis clarifies this commercial balance. Consider an annual procurement volume of 5,000 industrial piezoresistive pressure transmitters priced at 220 dollars per unit under standard batch sampling. Implementing a mandatory 100 percent screening protocol requiring five-point thermal dwell testing adds 48 dollars per unit in test chamber depreciation, liquid nitrogen consumption, technician labor, and electrical energy.
This increases landed unit cost by 21.8 percent.
Conversely, adopting an aggressive c=0 sampling plan across lot sizes of 500 units demands testing only 16 samples per batch, reducing testing cost to roughly 3.50 dollars per delivered unit. If the end application carries low replacement costs, such as non-critical HVAC monitoring, attribute sampling provides optimal commercial efficiency. In offshore subsea production, safety relief valves, or turbine control systems, a single sensor failure incurs extraction and downtime penalties exceeding 150,000 dollars, rendering the 48 dollar screening premium financially mandatory.
Destructive and non-destructive thermal stress limits dictate protocol design. While thermal dwell testing to catalog limits is non-destructive, accelerated stress dwells performed 20 degrees Celsius above rated operating boundaries accelerate component aging. High temperatures induce micro-crack propagation in thin-film sputtering layers and embrittle internal fluoroelastomer sealing rings, shortening operating lifespan.
Screening protocols must remain strictly within design boundaries unless dedicated qualification lots are purchased specifically for destruction.
When procurement teams increase lot acceptance thermal dwell durations without auditing the supplier chamber infrastructure, vendors quietly subcontract testing to commercial laboratories. This move introduces logistical delays, inflates shipping costs, and creates blind spots in calibration traceability records.
Drift

Field Drift Correlation to Thermal Test Escapes
Sensors that pass static ambient acceptance testing often exhibit accelerated zero drift during their first year in service. This operational failure correlates directly with inadequate thermal dwell screening during factory release. Residual mechanical stresses locked inside the diaphragm assembly gradually relax over thousands of hours at operational temperatures, manifesting as an incurable baseline wander that automated zero trims cannot track.
Accelerated life testing relies on the Arrhenius reaction rate model to link short-term high-temperature dwell performance with multi-year field stability. The acceleration factor equation quantifies aging kinetics based on operational and test temperatures:
AF = exp((E_a / k_B) ((1 / T_use) – (1 / T_test)))
The variable E_a represents the process activation energy in electron volts, k_B is Boltzmann constant (8.617 times 10 to the power of minus 5 electron volts per Kelvin), T_use is field operating temperature in Kelvin, and T_test is dwell screening temperature in Kelvin. For silicon sensor wire bonds and thin-film metallization interfaces, activation energy values typically cluster around 0.7 electron volts. Subjecting a sensor to an elevated dwell of 125 degrees Celsius accelerates chemical aging and stress relaxation by a factor of 43 relative to a 40 degree Celsius field environment.
A transducer soaking at 125 degrees Celsius for 48 hours accumulates the equivalent of 2,064 hours of continuous operational stress. This thermal pre-conditioning strips away the steep initial phase of the infant mortality curve, stabilizing internal mechanical interfaces. Transducers shipped without this thermal conditioning undergo that relaxation in the field, consuming their specified annual drift allocation within the first ninety days of deployment.
Procurement documents that specify tight accuracy classes while omitting thermal dwell burn-in parameters purchase an unearned number. The sensor meets its 0.05 percent Full Scale accuracy claim during receipt testing, passes incoming audit, and wanders outside specification by month six. Establishing mandatory thermal pre-dwell protocols transfers the cost of early aging stabilization back to the manufacturing cycle where it belongs.
Field returns will continue to expose unmonitored supplier process alterations until incoming inspection regimens incorporate multi-hour thermal dwells to verify that zero return boundaries survive genuine environmental stress.