Standard Isothermal Dynamic Mechanical Analysis for Structural Epoxy Characterization
Standard isothermal dynamic mechanical analysis measures structural epoxy viscoelasticity by isolating instrument compliance and phase lag from true resin modulus.


Grip
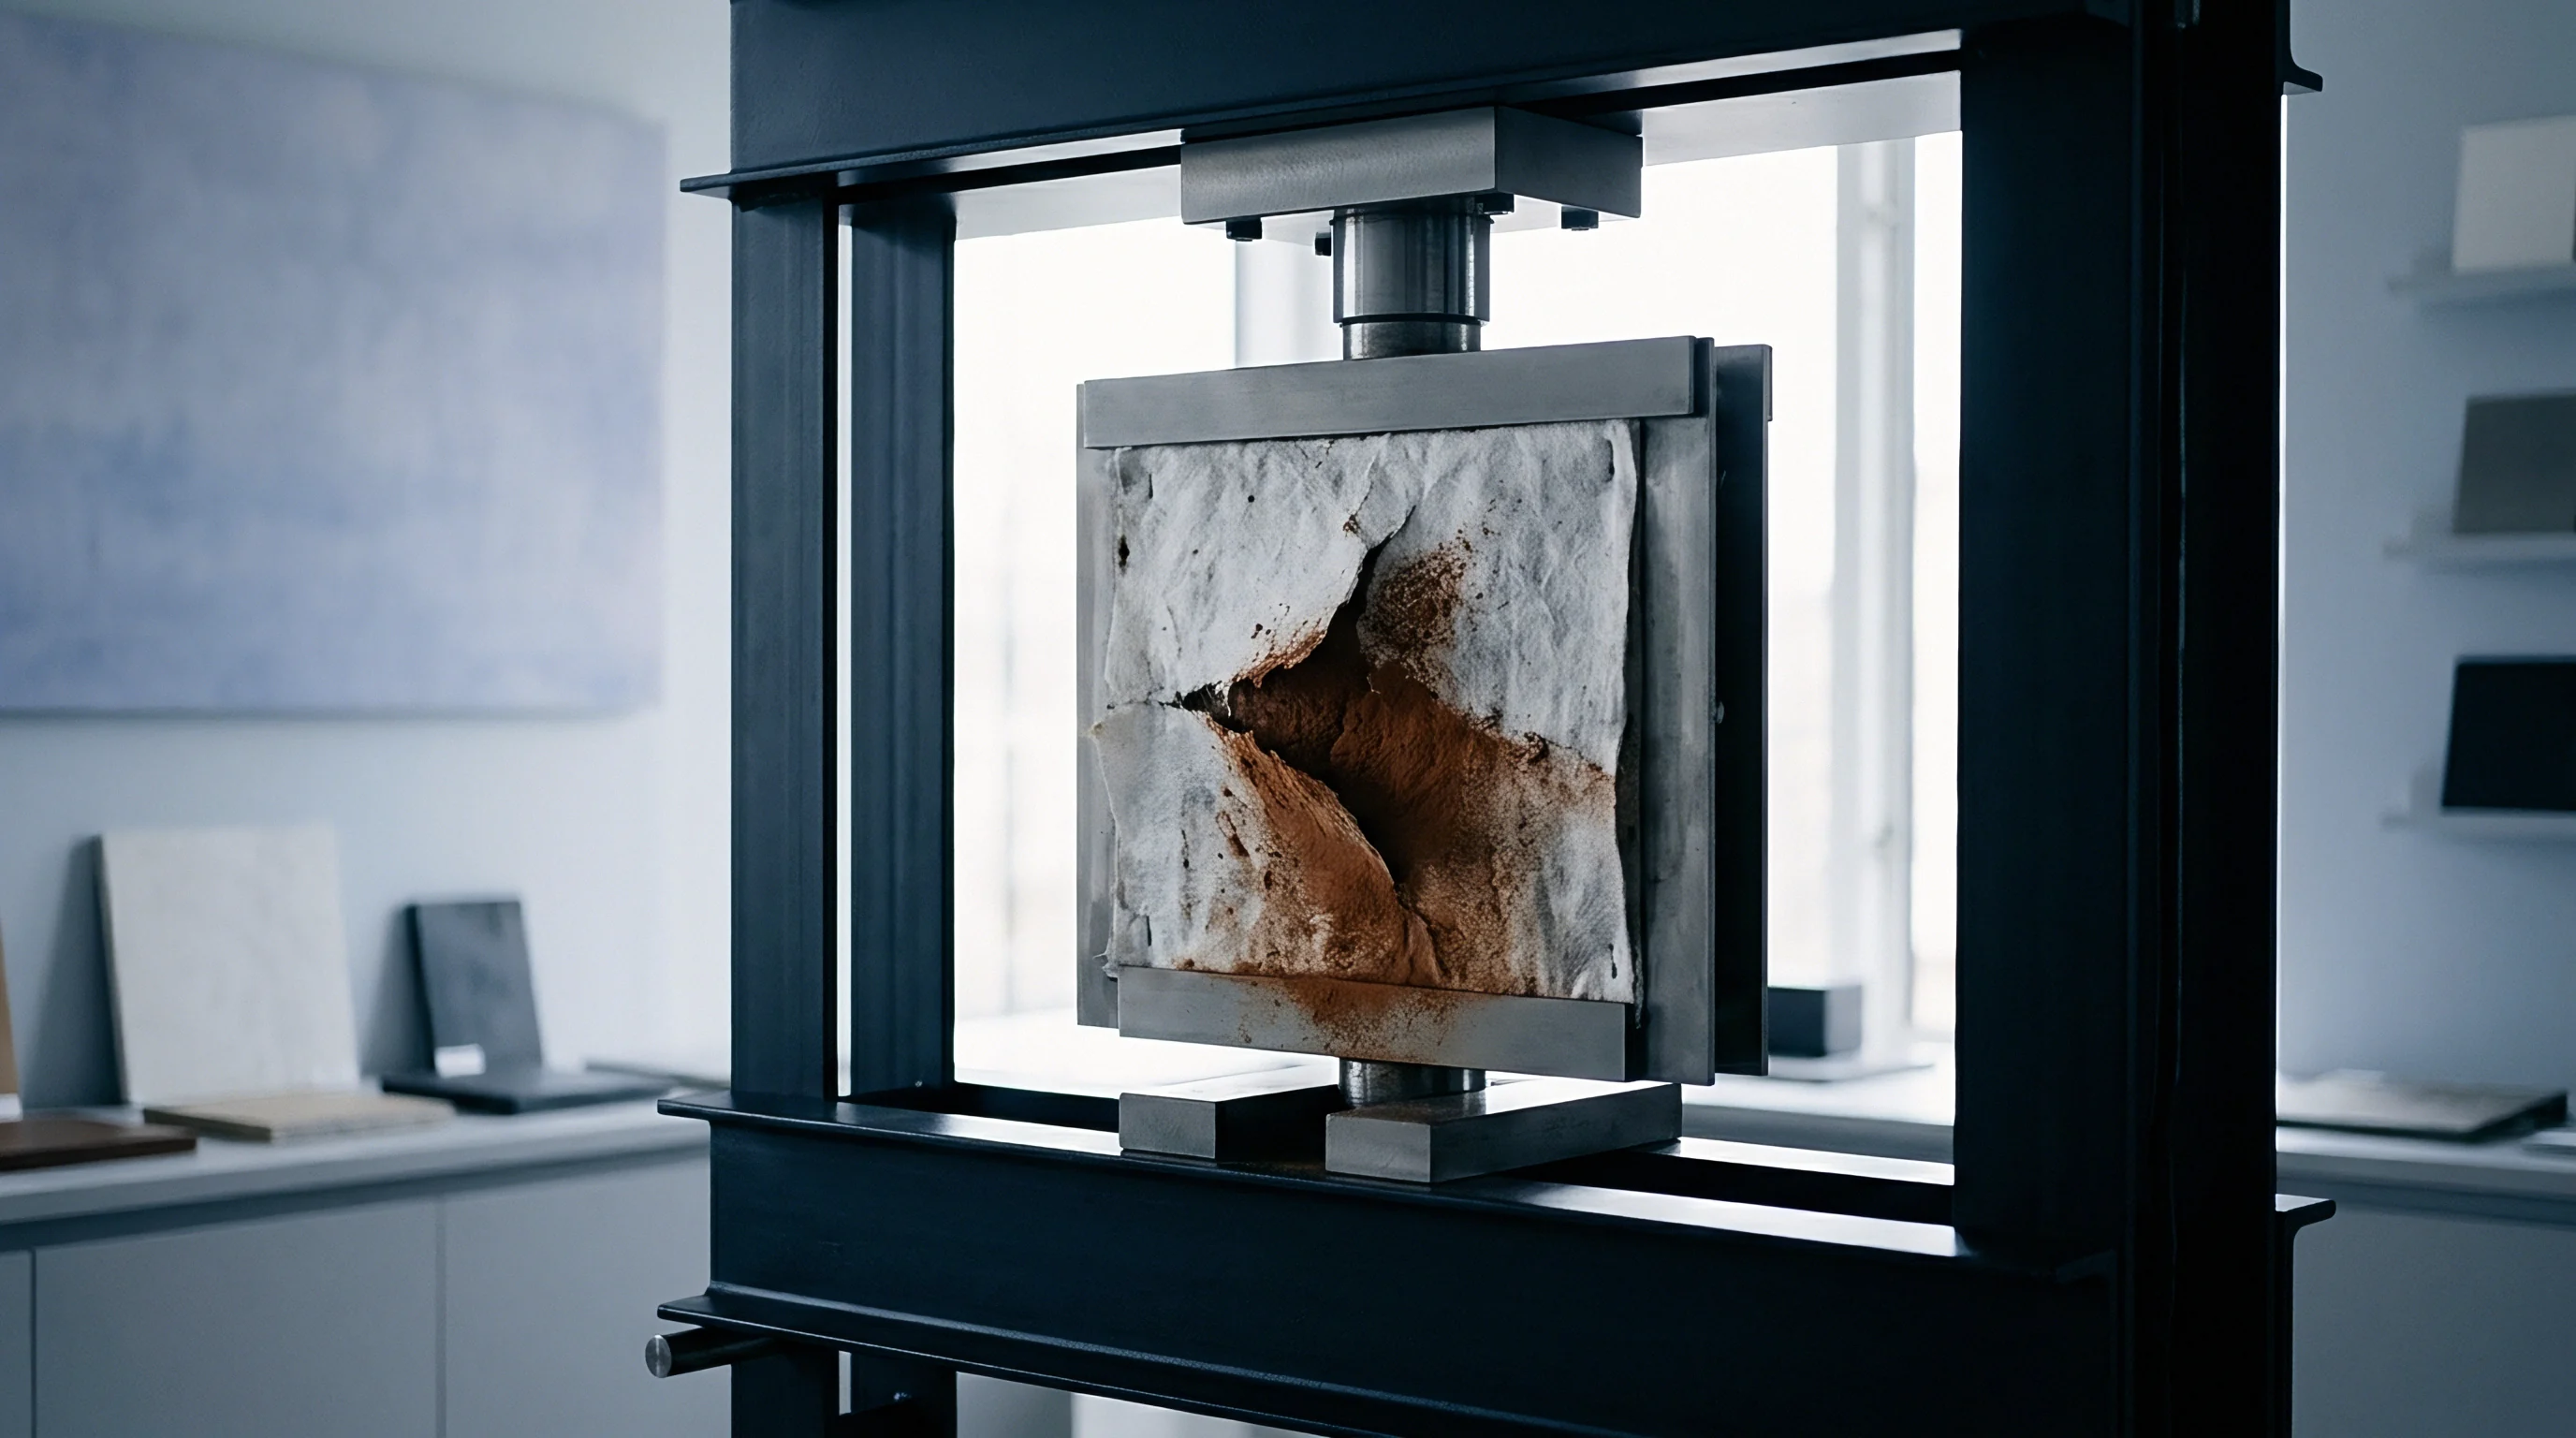
Fixture Compliance in Solid Cantilever Geometry
Dynamic mechanical analysis evaluates the storage modulus, loss modulus, and damping factor tan delta of structural epoxies under oscillatory load. In dual or single cantilever geometry, instrument compliance skews raw displacement data whenever the cross-sectional stiffness of a cured epoxy bar nears that of the clamping frame itself. Clamping frames retain a finite mechanical compliance ~ typically 0.0001 to 0.0003 millimeters per Newton depending on drive-shaft geometry and tie-bar construction.
If analysis software assumes an infinitely rigid frame, the displacement transducer captures frame deformation right along with specimen deflection. Below fifty degrees Celsius, this systematic error depresses the measured storage modulus by eight to fifteen percent across the glassy plateau. While ASTM D4065 and ASTM D5023 set the procedural boundaries for flexural dynamic testing, neither standard automates hardware compliance subtraction for custom specimen geometries.
Specimen aspect ratio dictates how much shear deformation interferes with pure bending. For structural formulations of bifunctional diglycidyl ether of bisphenol-A crosslinked with aromatic diamines, a length-to-thickness ratio under ten depresses flexural storage modulus artificially because shear inflates apparent displacement. Calibrating the clamp assembly requires running a known reference material ~ such as an isotropic sheet of certified poly(methyl methacrylate) or a precision ground spring steel shim ~ at identical clamping torques.
Setting torque to 0.8 Newton-meters with a calibrated miniature driver prevents specimen slip without causing compressive micro-cracking in brittle, high-crosslink glassy networks.
Thermal expansion in clamping fixtures during isothermal soaks introduces baseline drift into dynamic force readings. Standard frames built from stainless steel expand during steps to elevated isothermal plateaus, whereas clamps machined from low-expansion titanium alloys stay dimensionally stable within three micrometers across a sweep from twenty to two hundred degrees Celsius. As the epoxy expands through secondary sub-ambient transitions, clamping screws tend to back off, causing a sudden drop in measured stiffness that is easily mistaken for early material degradation.
Clamping torque variations above twenty percent alter measured glassy modulus by more than five percent across three-point bending configurations.
Dynamic mechanical testing requires disciplined coupon preparation. Cast plates of structural epoxy need wet sawing with a precision diamond wheel, followed by edge grinding using 600-grit silicon carbide abrasive. Surface micro-cracks left by dry machining act as stress concentrators under oscillation, provoking premature micro-yielding at dynamic strain amplitudes as low as 0.05 percent.
While thick bars suppress edge effects, thin films amplify clamping errors, leaving specimen seat stability largely dependent on clamping pressure.
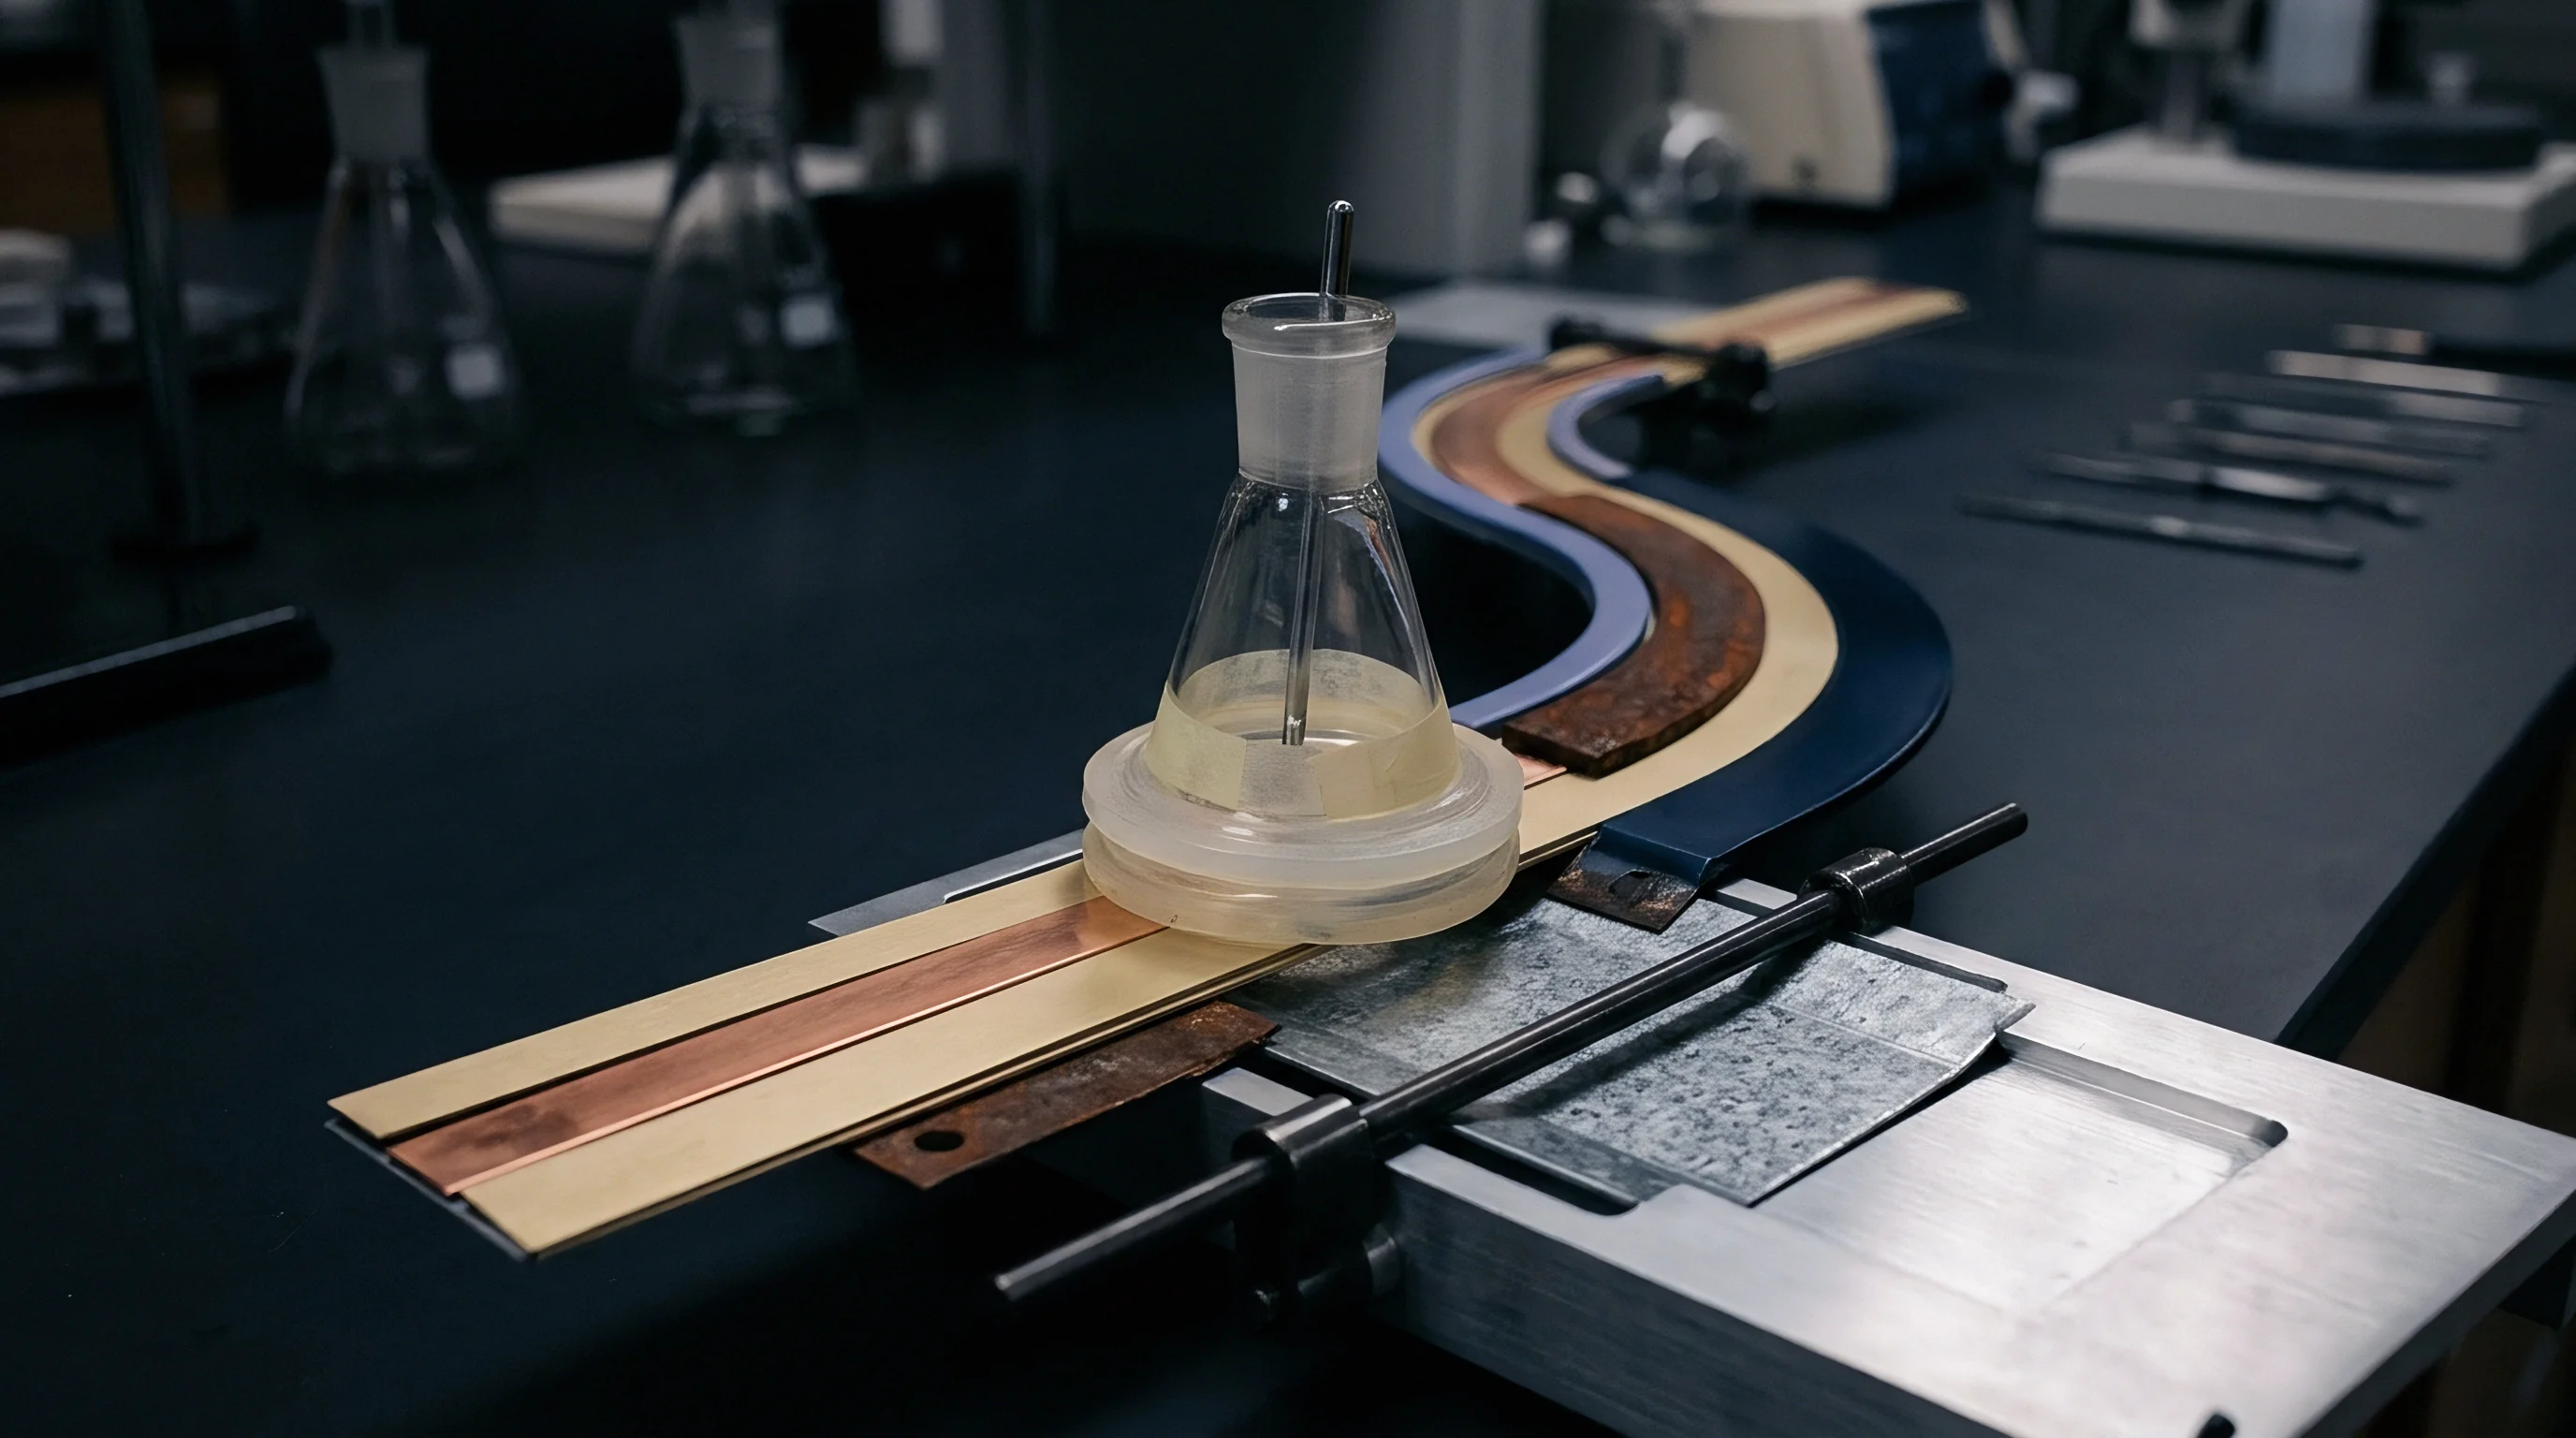

Transducer

Dynamic Force and Phase Angle Calibration Mechanics
A dynamic mechanical analyzer operates as an electromechanical rheometer measuring two primary quantities: dynamic force amplitude and the phase lag between excitation and response. Characterizing a structural epoxy matrix requires resolving phase angles between 0.1 degrees in the glassy state and forty degrees through the glass-rubber transition zone. Force detection relies either on a linear variable differential transformer paired with an electromagnetic motor or on a separate piezoelectric load cell on the fixed clamp.
Any non-linearity in the core position of the displacement sensor introduces harmonic distortion into the sinusoidal response curve, shifting the calculated loss modulus upward by three to seven percent.
Traceable dynamic force measurement requires direct static deadweight calibration alongside dynamic mass-spring verification. Under ISO/IEC 17025 accreditation scopes, calibration laboratories verify force transducers with class E2 stainless steel weights spanning ten millinewtons to twenty-four newtons. Dynamic calibration validates the phase lag correction.
Signal conditioning filters and analog-to-digital converters impose an intrinsic electronic delay between zero and fifteen microseconds. At an oscillation frequency of one hundred hertz, an uncorrected ten-microsecond delay produces an angular error of 0.36 degrees ~ effectively doubling the apparent tan delta of an unyielding structural epoxy at room temperature.
| Uncertainty Contributor | Calibration Standard Reference | Observed Instrument Deviation | Expanded Uncertainty Coverage Factor k Equal Two |
|---|---|---|---|
| Force Transducer Linearity | OIML R111 Class E2 Weights | plus minus 0.015 N | plus minus 0.032 N |
| Displacement Scale Factor | Laser Interferometer Traceable Stage | plus minus 0.08 um | plus minus 0.18 um |
| Electronic Phase Lag Correction | Digital Waveform Synthesizer Reference | plus minus 0.012 deg | plus minus 0.028 deg |
| Temperature Setpoint Uniformity | PT100 Sensor Class 1 10 DIN | plus minus 0.15 C | plus minus 0.35 C |
Modulus calculations reflect transducer drift directly.
Thermal stability within the transducer housing governs drift during long isothermal holds. High-performance instruments house the sensor in water-cooled blocks held at twenty degrees Celsius plus minus 0.02 degrees via an external recirculating bath. During a four-hour isothermal dwell at one hundred and eighty degrees Celsius, heat conducting up the ceramic drive shaft expands internal sensor mounts.
The resulting zero-point drift in the static tracking motor shifts the mean dynamic force target and alters specimen prestrain.
ASTM D7028 outlines dynamic mechanical procedures for establishing the glass transition temperature of polymer matrix composites. Before compliance audits run on structural resins, the standard requires verifying the phase baseline against a purely elastic reference showing zero mechanical loss, such as an aerospace-grade titanium specimen. Writing standard clause 8.4 directly into vendor contracts forces third-party laboratories to deliver raw, uncorrected phase lag data alongside final modulus curves, preventing post-processing routines from smoothing away transducer saturation.


Vitrification

Isothermal Cure Dynamics and Modulus Development
Structural epoxies undergoing isothermal polymerization pass through two distinct physical stages: gelation and vitrification. Gelation marks the transition from liquid resin to a macroscopic network, where steady-state shear viscosity diverges while the glass transition temperature remains below the isothermal cure temperature. As crosslinking proceeds, shrinking molecular weight between crosslinks pushes the glass transition temperature higher.
Vitrification occurs the moment this glass transition temperature reaches the isothermal cure temperature, locking unreacted groups into a diffusion-controlled glassy state.
Dynamic mechanical analysis tracks this kinetic development through real-time viscoelastic measurements during isothermal dwell. Storage modulus climbs four orders of magnitude, rising from roughly 0.1 megapascals in the pre-gel fluid to 2.8 gigapascals in the vitrified glass. Loss modulus exhibits a localized peak at gelation, followed by a much larger peak at vitrification.
Once vitrification takes over, the tan delta curve drops sharply as molecular mobility shuts down and reaction rates plunge by ninety percent within seconds.
| Time Interval Minutes | Storage Modulus G Prime MPa | Loss Modulus G Double Prime MPa | Loss Factor Tan Delta | Cure State Description |
|---|---|---|---|---|
| 12.0 | 0.08 | 0.32 | 4.00 | Pre-Gel Viscous Liquid |
| 34.5 | 1.25 | 1.25 | 1.00 | Gelation Point Frequency Invariant |
| 58.0 | 45.0 | 88.0 | 1.95 | Viscoelastic Network Development |
| 115.0 | 1450.0 | 210.0 | 0.14 | Vitrification Glass Formation |
| 240.0 | 2750.0 | 48.0 | 0.017 | Diffusion Controlled Vitrified Plateau |
Running dynamic mechanical tests on reacting structural epoxies creates fixture trade-offs. Disposable parallel plates in a dynamic rheometer accommodate the liquid-to-solid transition cleanly. Torsional rectangular clamps require pre-cured solid bars, ruling out the liquid phase but yielding cleaner data across the vitrified plateau.
A temperature drift of two degrees during an isothermal hold shifts the vitrification time boundary by twelve minutes.
Minor deviations in isothermal dwell temperatures do not average out over long qualification cycles; the discrepancy compounds when evaluating downstream fracture toughness and environmental resistance.

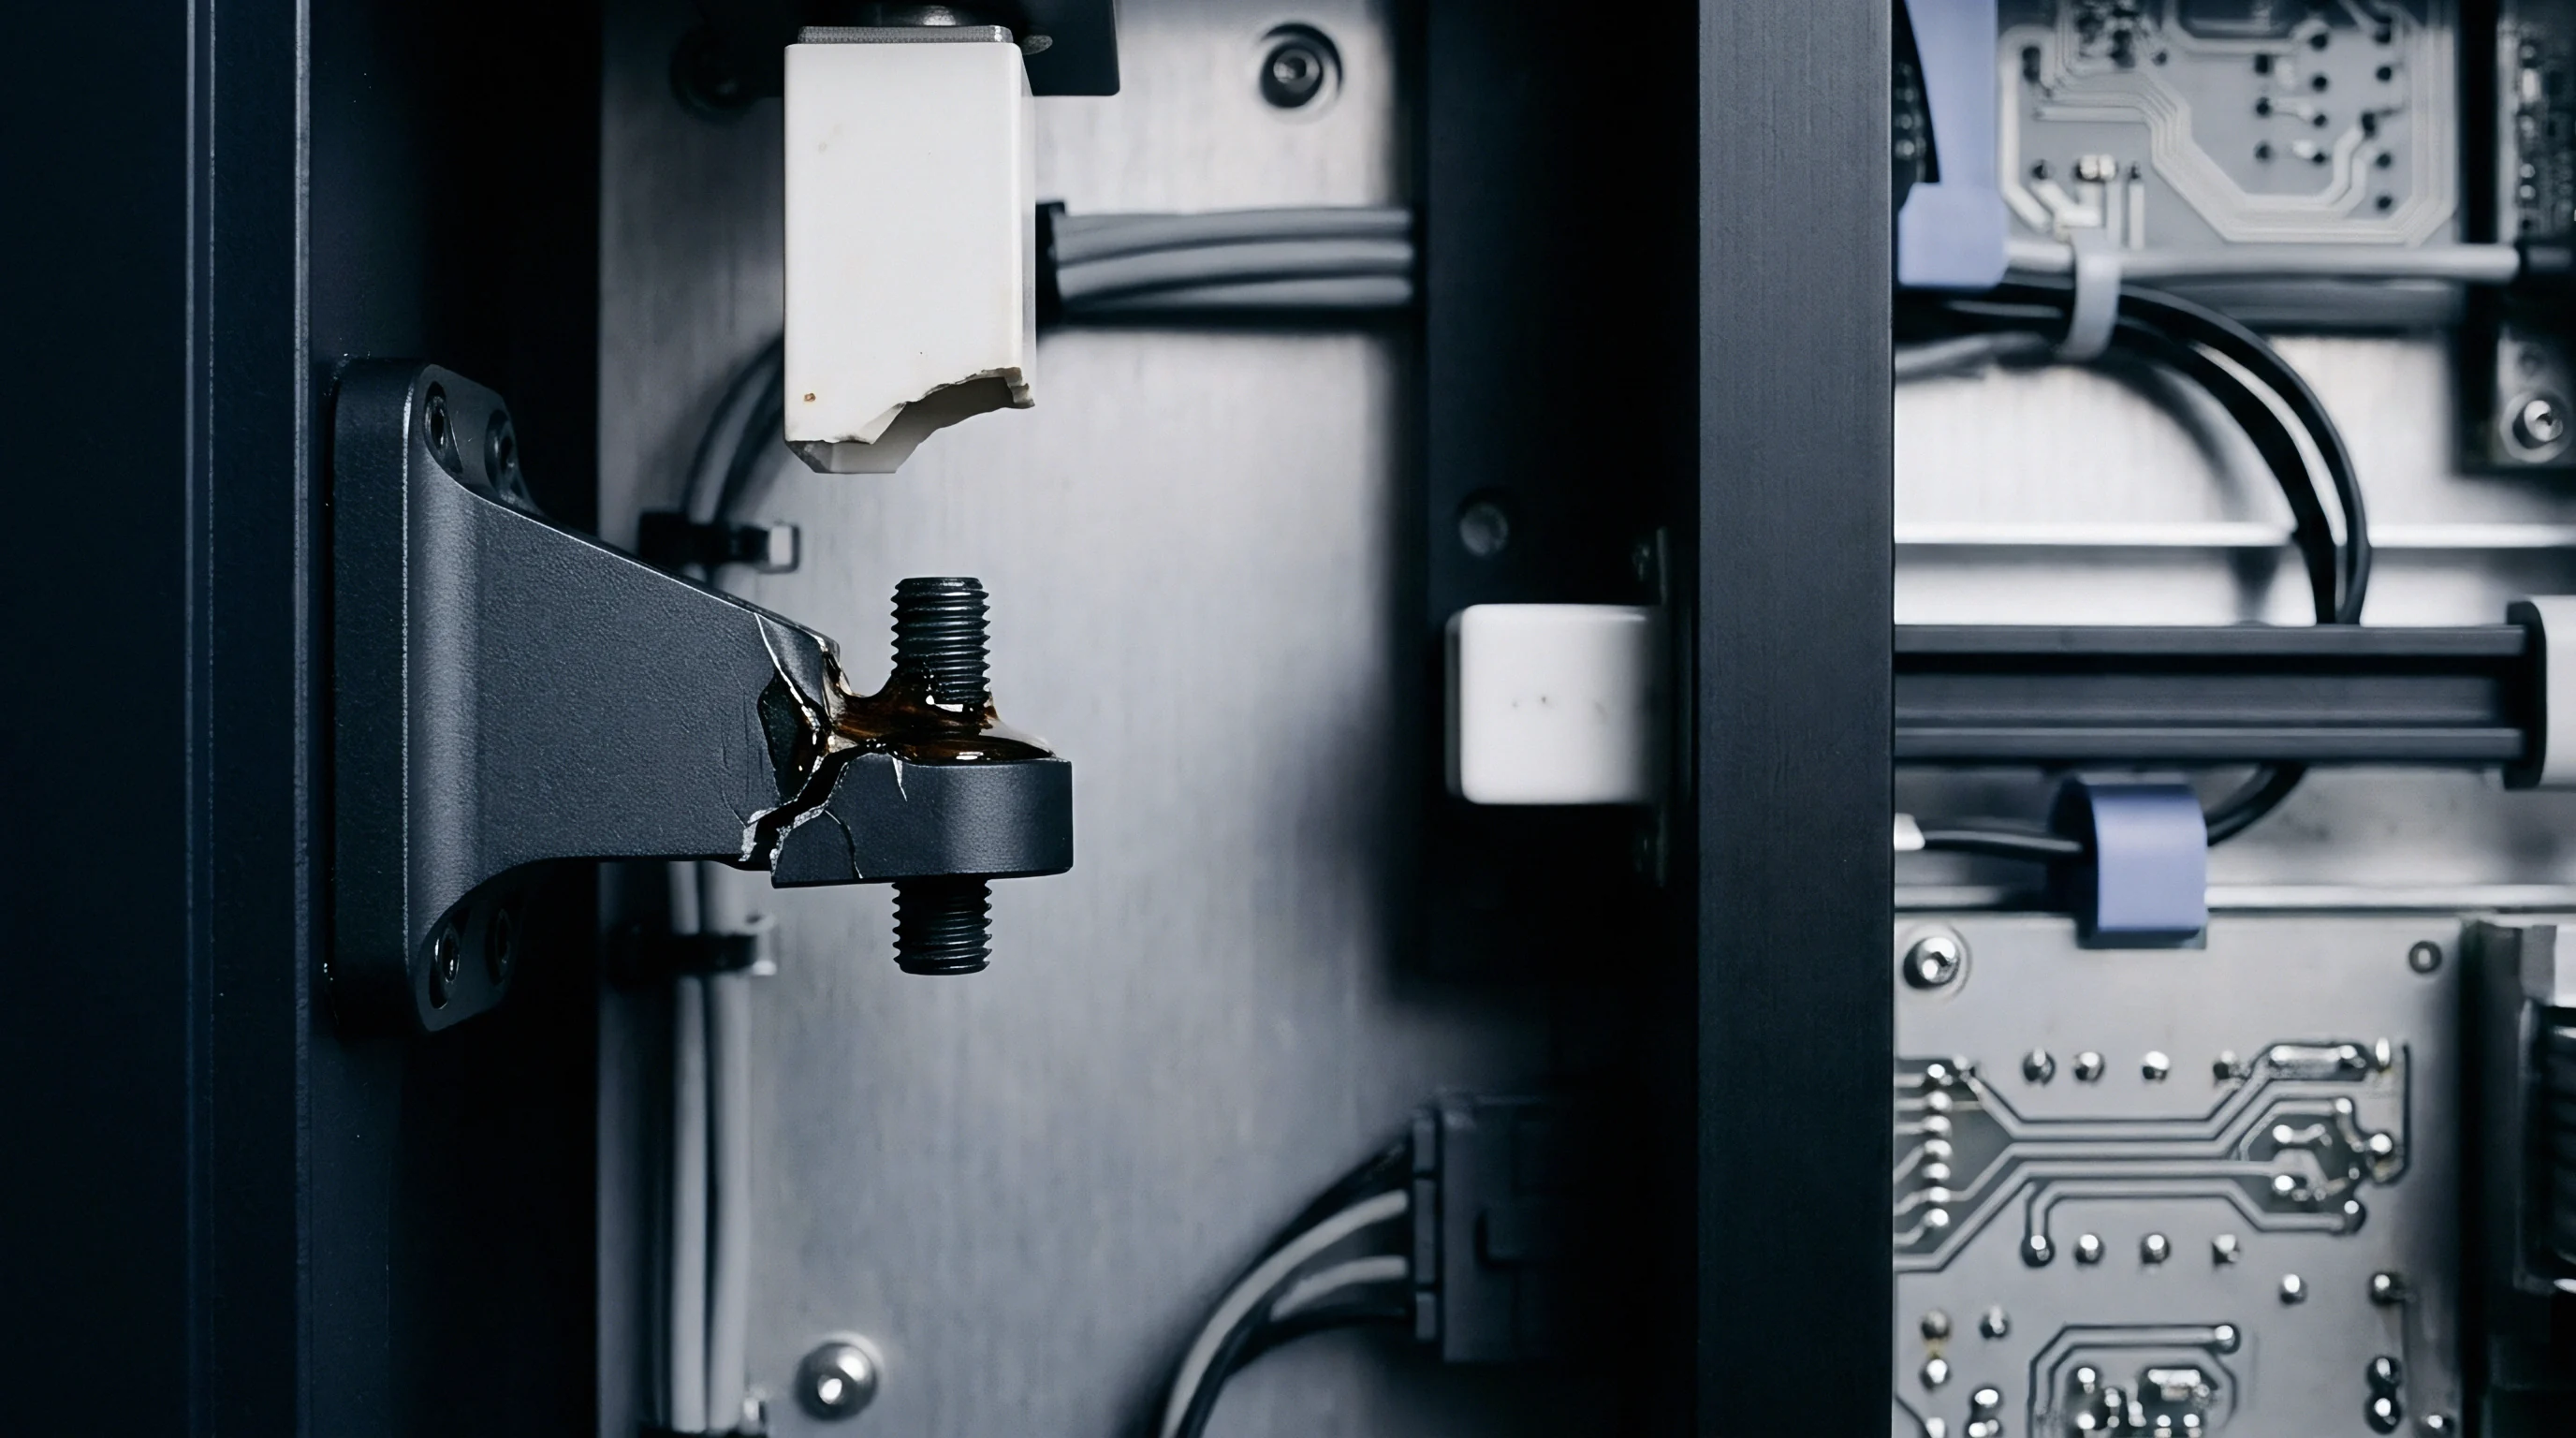
Dispersion
Frequency Multiplexing and Viscoelastic Master Curves
The viscoelastic behavior of a structural epoxy depends on both temperature and loading frequency. High-frequency oscillation prevents polymer chain segments from uncoiling within a single cycle, shifting the apparent glass transition temperature higher. In isothermal testing, frequency multiplexing steps through discrete frequencies ~ typically from 0.01 hertz to one hundred hertz ~ while keeping the chamber temperature strictly controlled, mapping the relaxation spectrum of the crosslinked network.
Multiplexing also resolves secondary sub-glass relaxations. Structural epoxies typically show a beta relaxation between minus seventy and minus thirty degrees Celsius at one hertz, driven by local crankshaft rotations of glycidyl segments and unreacted amine ends. Measuring this beta transition provides a baseline for impact resistance and micro-yielding thresholds in sub-ambient or cryogenic service.
The apparent activation energy for this process ranges from fifty to eighty kilojoules per mole, calculated from an Arrhenius plot of peak frequency against inverse temperature.
- Time-Temperature Superposition constructs broad-spectrum master curves from discrete isothermal frequency sweeps by applying horizontal shift factors across the logarithmic frequency axis.
- Williams-Landel-Ferry Formulation models shift factors above the glass transition temperature using empirical constants tied to fractional free volume expansion.
- Arrhenius Kinetics Equation describes shift factor progression below the glass transition where cooperative segmental chain motion ceases and localized cage hopping dominates.
- Cole-Cole Complex Representation plots loss modulus against storage modulus to verify the existence of a single thermal relaxation mechanism across all test decades.
Master curves project laboratory performance across frequency spans far beyond the physical range of mechanical analyzers. An aerospace component exposed to acoustic engine vibration at two kilohertz cannot be tested directly on standard mechanical frames without severe resonance interference. Master curves constructed from isothermal sweeps between twenty and one hundred and eighty degrees Celsius bridge that operational gap, projecting high-frequency storage modulus and energy dissipation.
Master curves lose validity when micro-phase separation or unreacted curing agent alters the physical relaxation spectrum across the target temperature span.
Time-temperature superposition assumes the material behaves in a thermorheologically simple manner. Heavily filled epoxy matrices containing mineral particles, silica nanoparticles, or core-shell rubber modifiers violate that premise. The particle-matrix interphase introduces secondary relaxation modes with distinct temperature dependencies, scattering horizontal shift factors and driving discrepancies between predicted and verified dynamic properties.
Epoxy crosslinks resist rapid strain across relaxation times that span multiple decades, while damping peaks broaden under spatial confinement.
Accelerated frequency multiplexing faces unresolved questions over how reliably it forecasts physical aging and micro-void coalescence across twenty years of structural service without relying on uncalibrated mathematical extrapolations.

Acceptance
Verification Protocols for Aerospace and Wind Energy Supply Chains
Receiving inspection for structural epoxies used in aerospace laminates and utility-scale wind turbine blades relies on dynamic mechanical analysis before resin drums enter production. Incoming material checks focus on three parameters: the onset temperature of storage modulus drop, the tan delta peak temperature, and the room-temperature glassy storage modulus. Testing laboratories frequently report divergent glass transition values for identical batches due to conflicting heating rates, fixture geometries, or curve-evaluation conventions.
- Specimen Conditioning Step dries all machined epoxy coupons in a desiccator cabinet at twenty-three degrees Celsius for forty-eight hours to eliminate plasticizing moisture.
- Clamping and Torque Verification secures the test coupon into three-point bending or dual cantilever grips using a calibrated digital torque wrench set to 0.75 Newton-meters.
- Strain Sweep Baseline Execution verifies linear viscoelastic limits by sweeping dynamic strain amplitude from 0.005 percent to 0.2 percent at room temperature.
- Isothermal Stabilization Hold soaks the specimen at the target qualification temperature for twenty minutes to achieve internal thermal equilibrium before data logging starts.
- Multi-Frequency Dynamic Run collects dynamic data across five frequencies between 0.1 and ten hertz while maintaining dynamic force above two newtons.
- Data Acceptance Threshold Audit checks recorded storage modulus against lot certification boundaries before issuing digital sign-off into enterprise quality records.
Standard bodies define the glass transition temperature using three different markers: the onset of storage modulus drop, the inflection point of the modulus curve, or the peak of tan delta. In amine-cured structural epoxies, the spread between storage modulus onset and the tan delta peak spans fifteen to twenty-five degrees Celsius. Sourcing agreements that specify a glass transition temperature without defining the exact evaluation method leave procurement vulnerable to marginal resin shipments.
A two percent moisture uptake in structural epoxy depresses the dynamic glass transition temperature by fourteen degrees Celsius.
Omitting clamp geometry, dynamic strain amplitude, or the exact glass transition derivation parameter from purchase orders leads to the acceptance of under-cured or off-ratio resin lots, risking laminate delamination and warranty recalls on critical structural assemblies.