Silicon Pressure Cell Fill Oil Volume Verification Methods
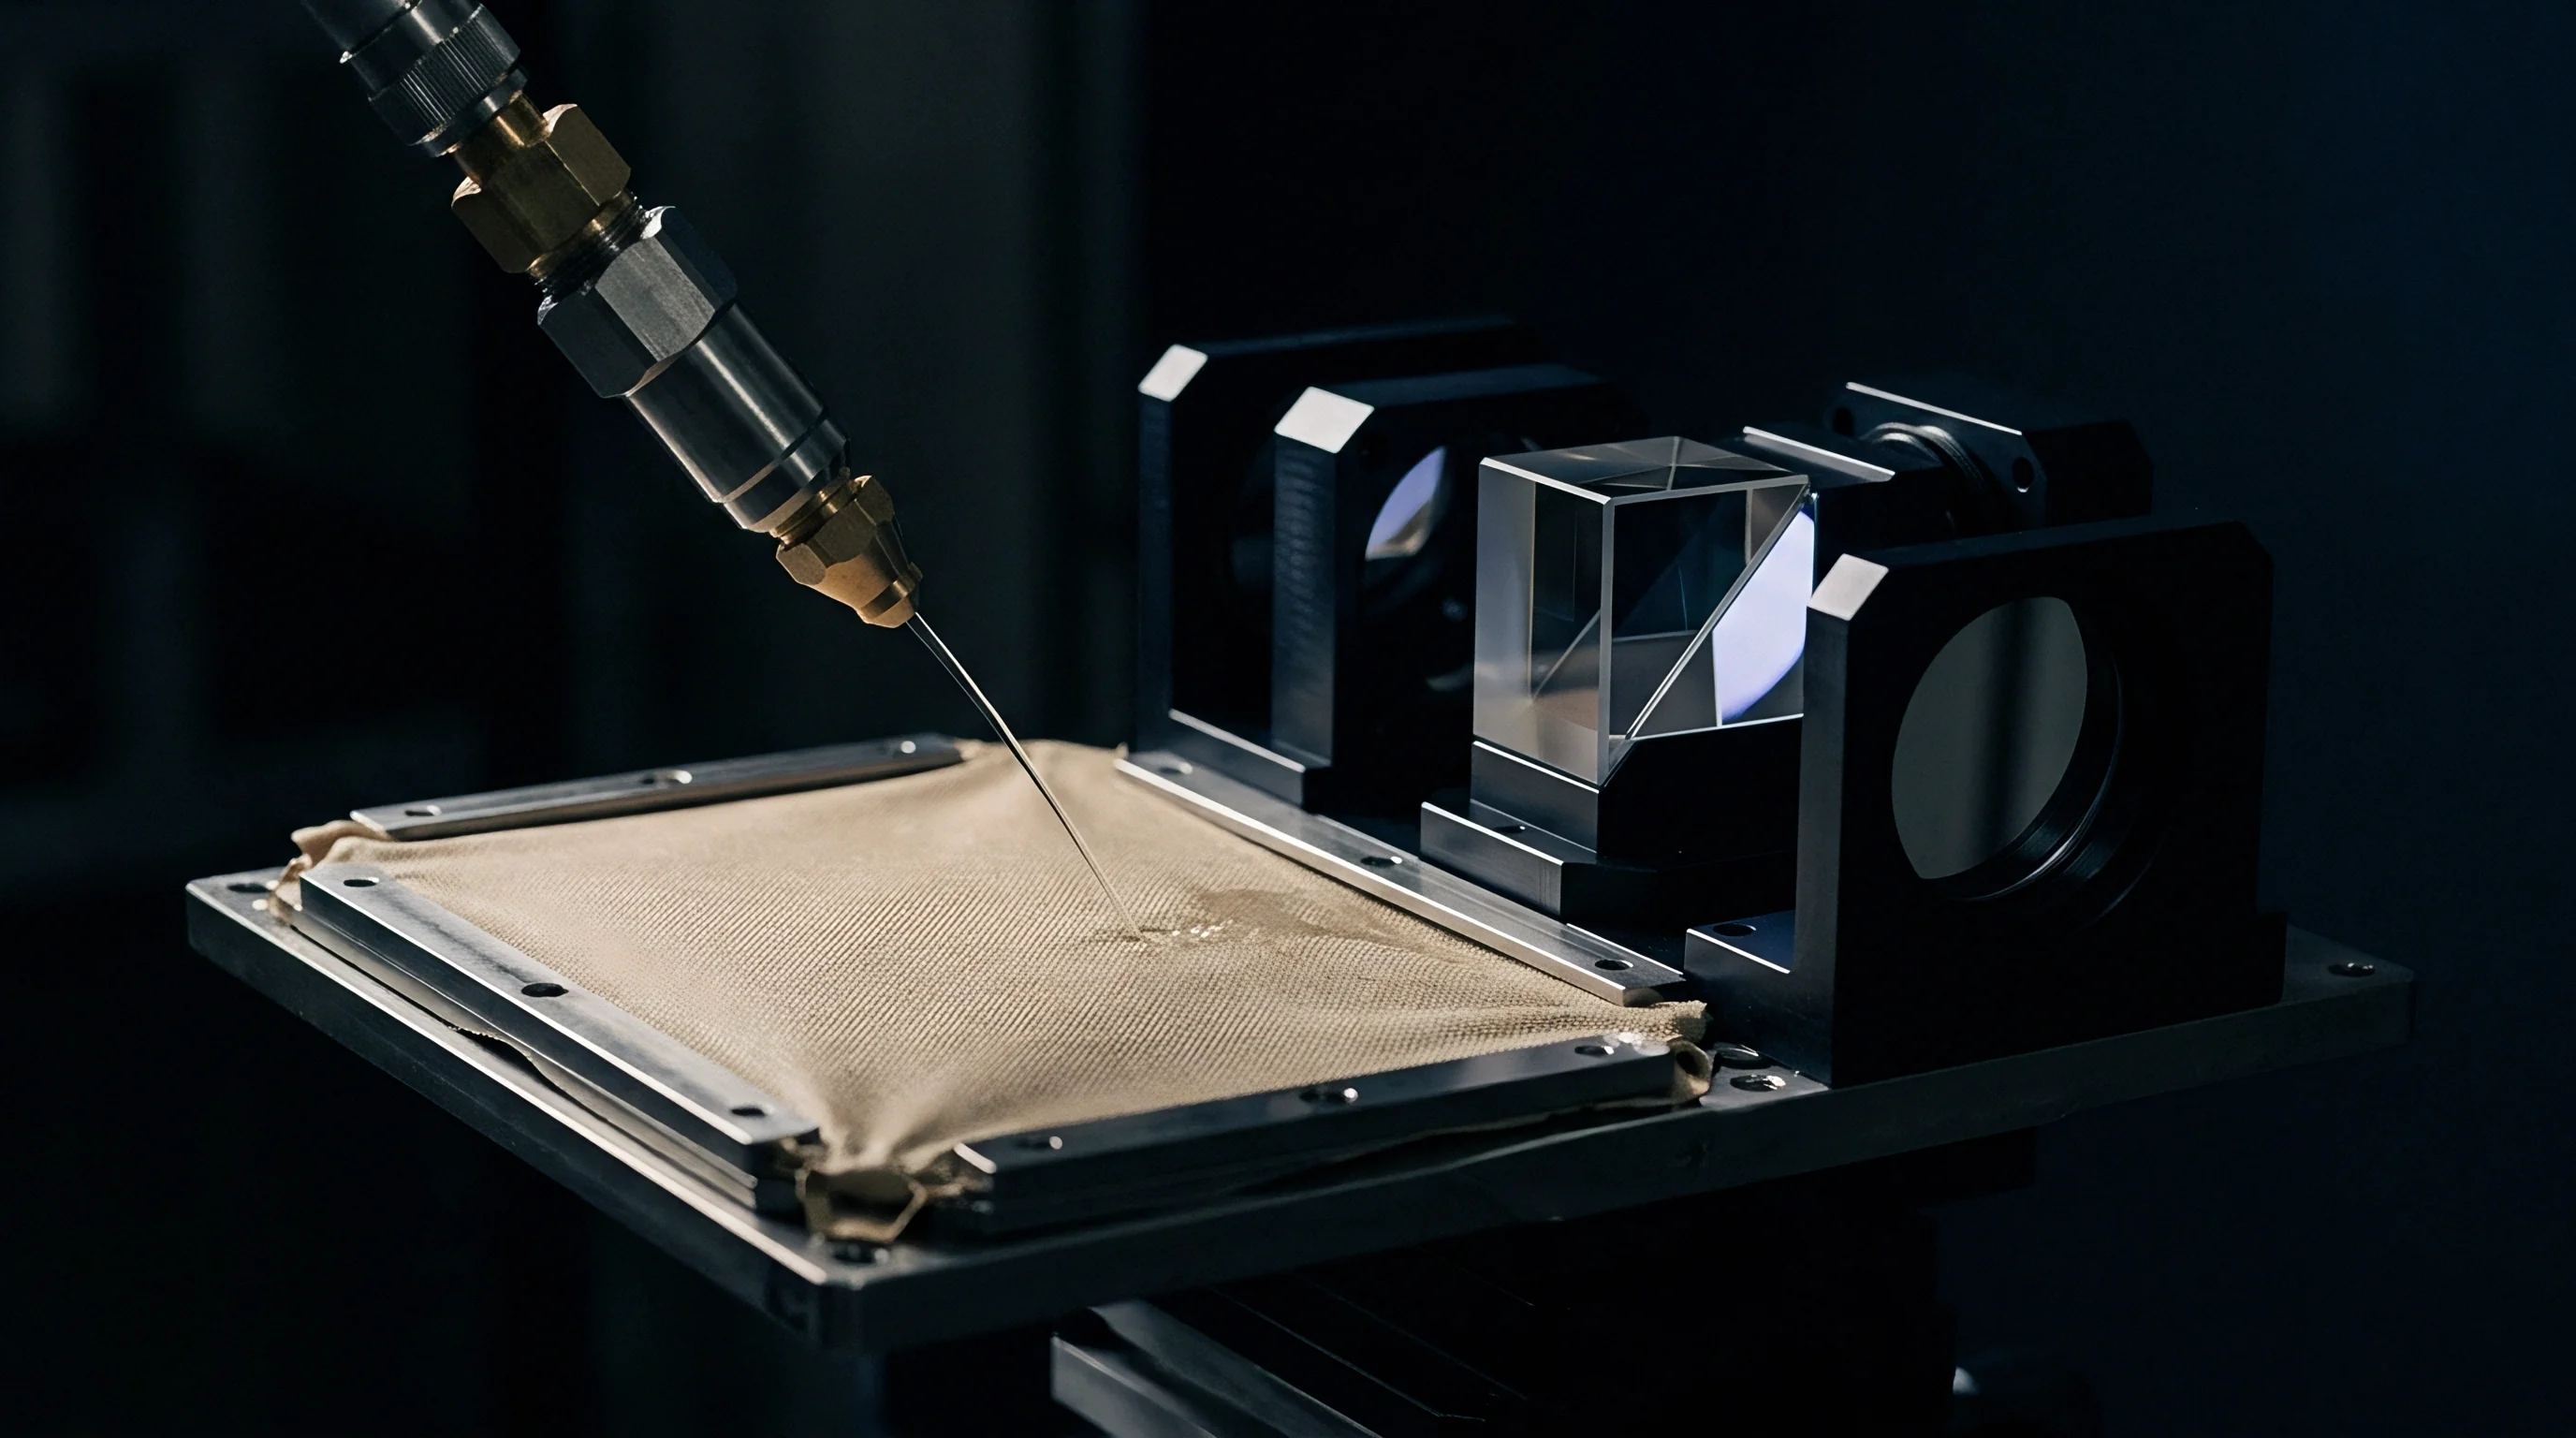
Confirm fill oil volume using pre- and post-injection micro-gravimetric mass checks combined with non-contact laser interferometric diaphragm dome profiling.
Fluid
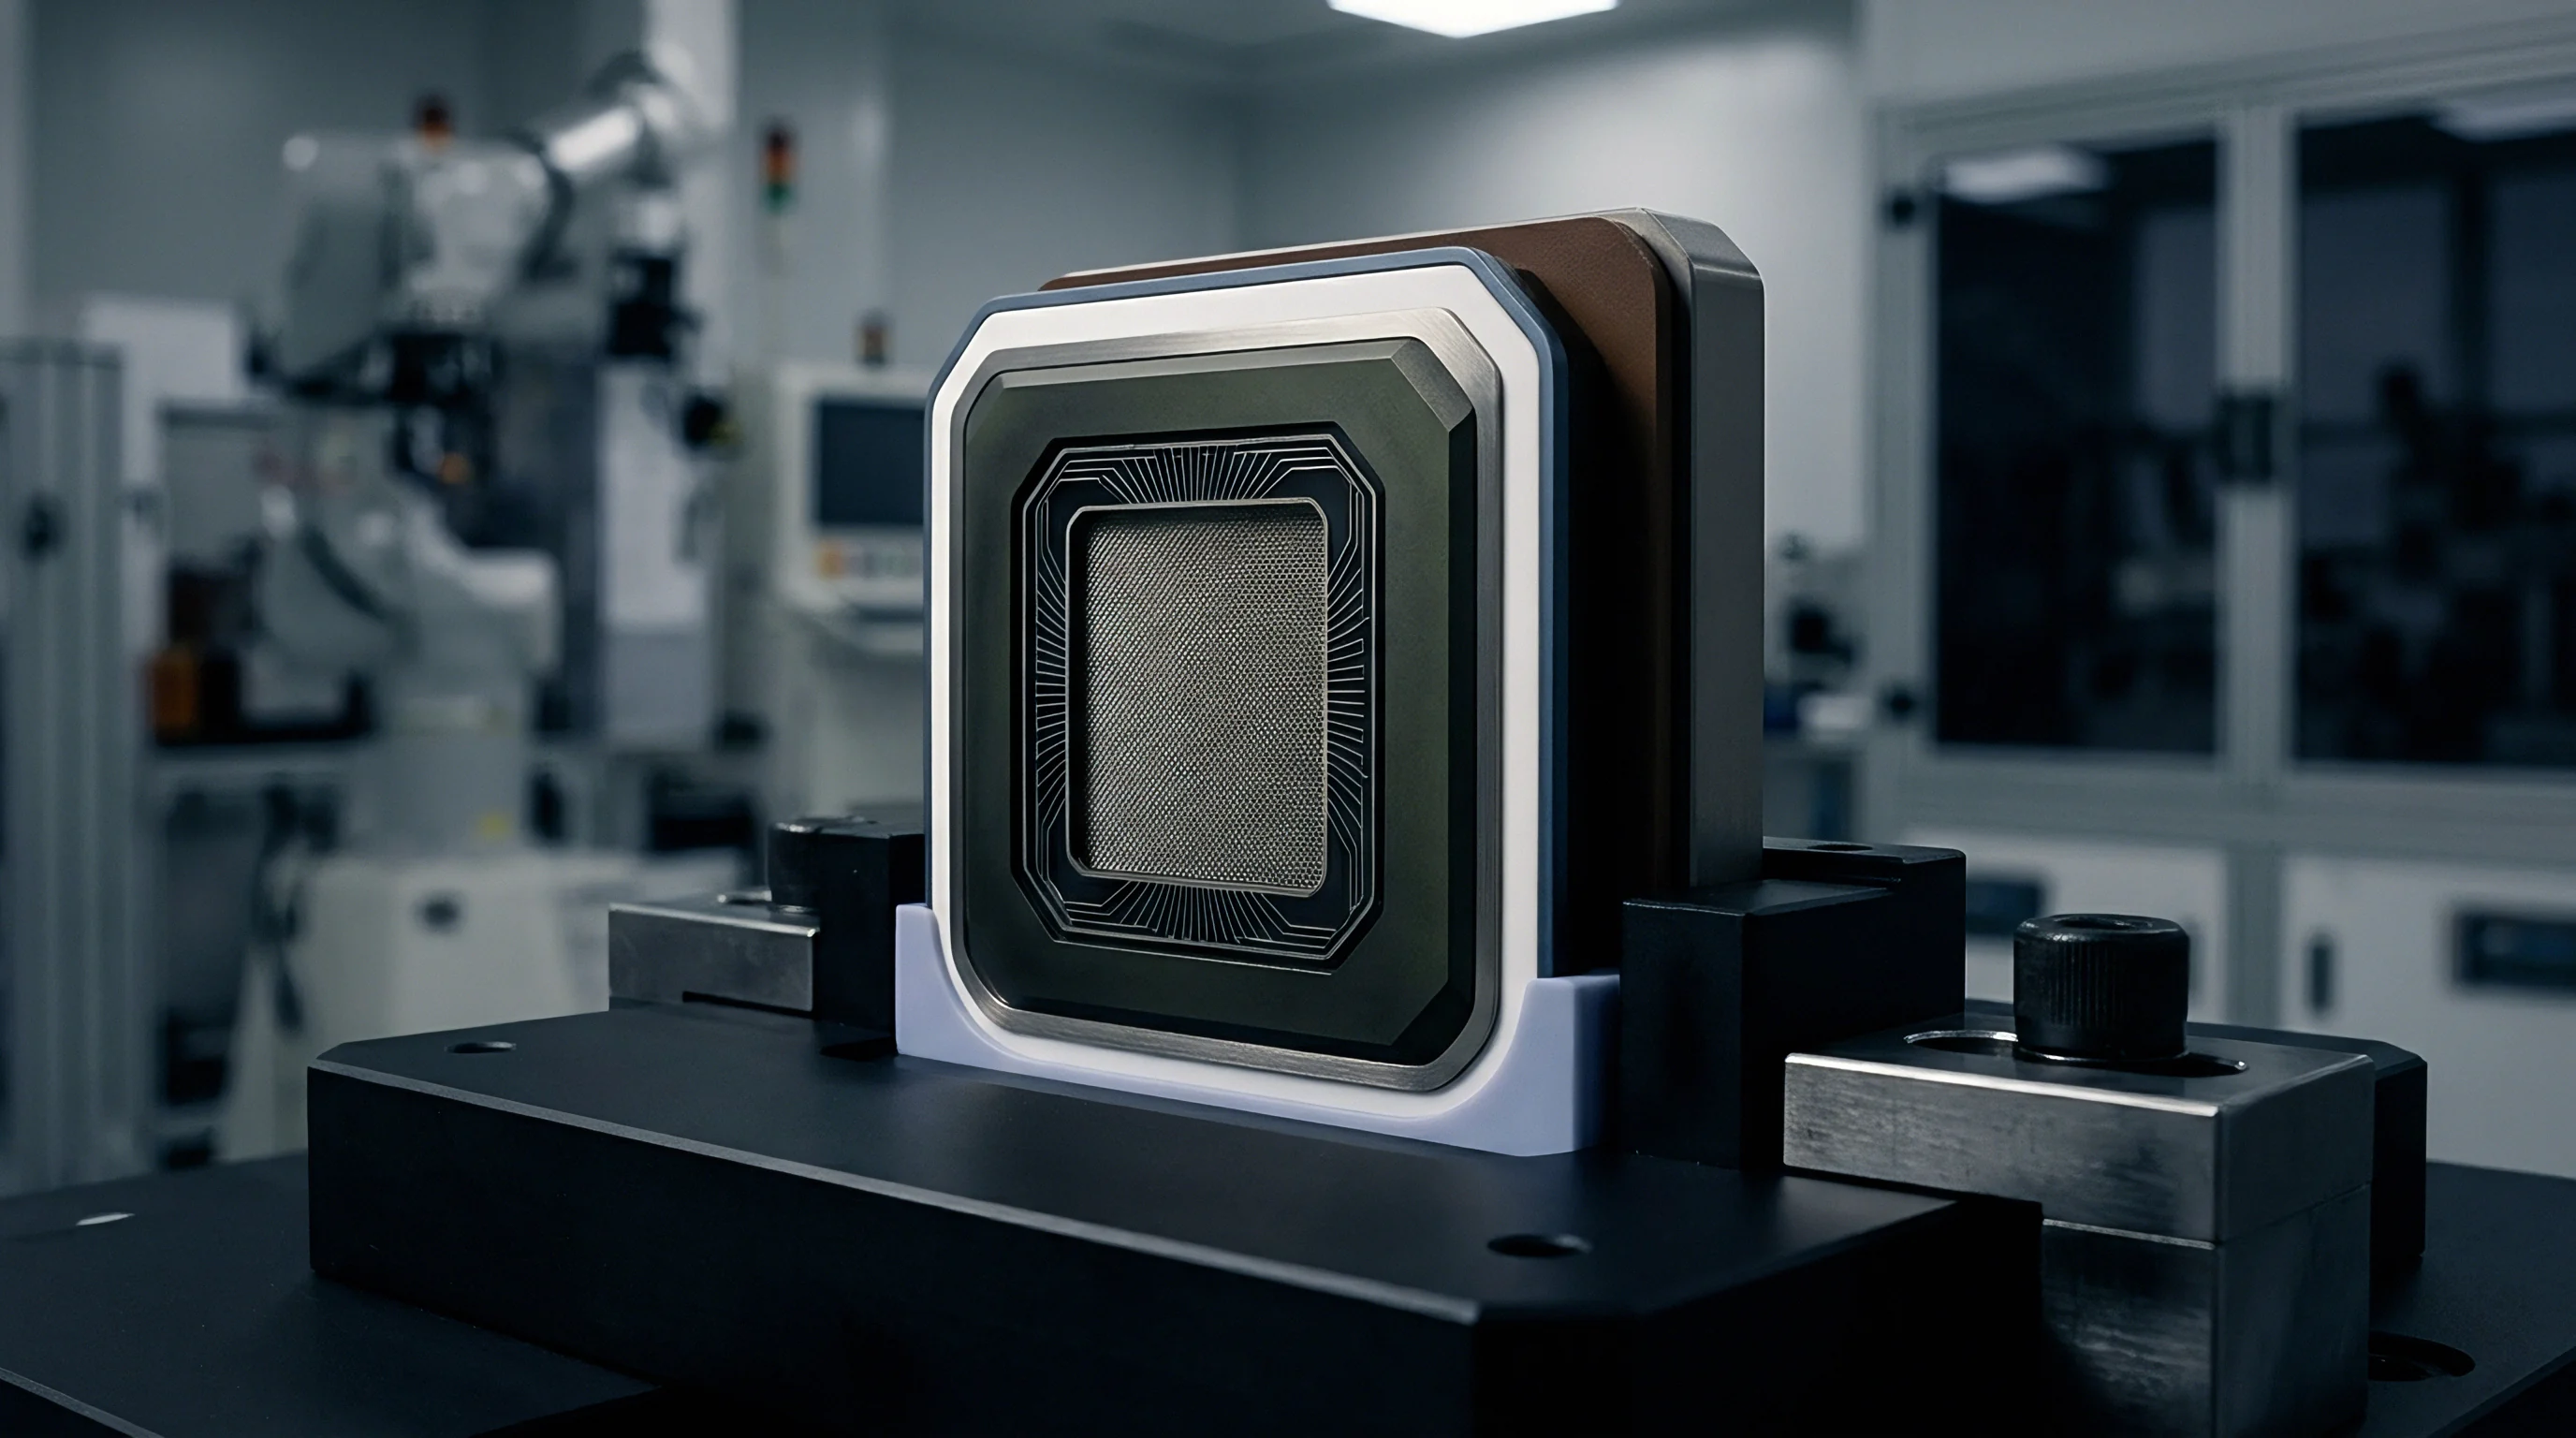
Isolated piezoresistive silicon pressure sensors rely on an incompressible internal transfer medium to convey hydraulic force from an isolating diaphragm to an internal sensing die. The fill volume within the micro-cavity behind the flexible metallic membrane directly dictates the sensor performance profile. Small changes in liquid volume alter dynamic response, zero temperature coefficients, and static linearity.
Micro-cavity volumes in industrial pressure cells range between five and fifty microliters, where a deviation of a single microliter represents a substantial percentage of the total oil charge.

Internal Cavity Geometry and Mass Allocation
Design specifications fix the total internal space behind a flexible metallic membrane to less than twenty microliters in standard pressure transmitters. Precision machining tolerances across the header assembly, glass feedthroughs, and silicon chip mount create natural cell-to-cell cavity volume variations. Oil volume determines thermal stability.
Filling protocols target complete fluid saturation without trapping non-condensable gas or over-distending the thin isolation barrier. Overfilling pushes the metallic membrane outward beyond its natural neutral plane, shifting the baseline mechanical strain state on the piezoresistive bridge.
Underfilling leaves micro-voids or introduces insufficient hydraulic fluid to transmit pressure across the full operating stroke. Under low ambient pressure or vacuum conditions, incomplete fluid fill leads to diaphragm bottoming against the internal header seat, causing flat-line output errors and non-linear signal responses. Correct fill mass balances mechanical compliance and thermal expansion capacity across the operational temperature range.
A fill volume error of zero point five microliters in a ten microliter cavity shifts zero thermal drift by more than zero point twelve percent of full scale span per ten degrees Celsius.
Physical Properties across Operational Fill Media
Selected hydraulic oils present distinct kinematic viscosity, thermal expansion coefficients, and gas solubility limits that alter sensor behavior. Silicone oils such as polydimethylsiloxane remain common for general industrial cells due to wide thermal stability and predictable expansion rates. Fluorinated fluids or hydrocarbon lubricants serve specialized roles in oxygen service or high-temperature chemical environments.
Density changes with ambient temperature.
| Fill Fluid Type | Density at 25°C (g/cm³) | Thermal Expansion Coefficient (1/K) | Kinematic Viscosity at 25°C (cSt) | Nominal Cavity Volume (µL) | Volumetric Tolerance Window (µL) |
|---|---|---|---|---|---|
| Silicone Oil (DC 200, 10 cSt) | 0.935 | 0.00096 | 10.0 | 12.5 | ±0.35 |
| Fluorolube (FS-5) | 1.860 | 0.00082 | 5.0 | 12.5 | ±0.20 |
| Halocarbon 0.8 | 1.700 | 0.00091 | 0.8 | 10.0 | ±0.25 |
| Synthetic Hydrocarbon (PAO) | 0.820 | 0.00085 | 15.0 | 15.0 | ±0.40 |
Thermal coefficients dictate volume changes. When operating temperature rises, the oil expands faster than the metallic housing. The expansion forces the isolating diaphragm outward, introducing temperature-induced zero shift.
Underfilling causes internal oil cavitation under rapid pressure transients, permanently damaging piezoresistive silicon bridges.

Density
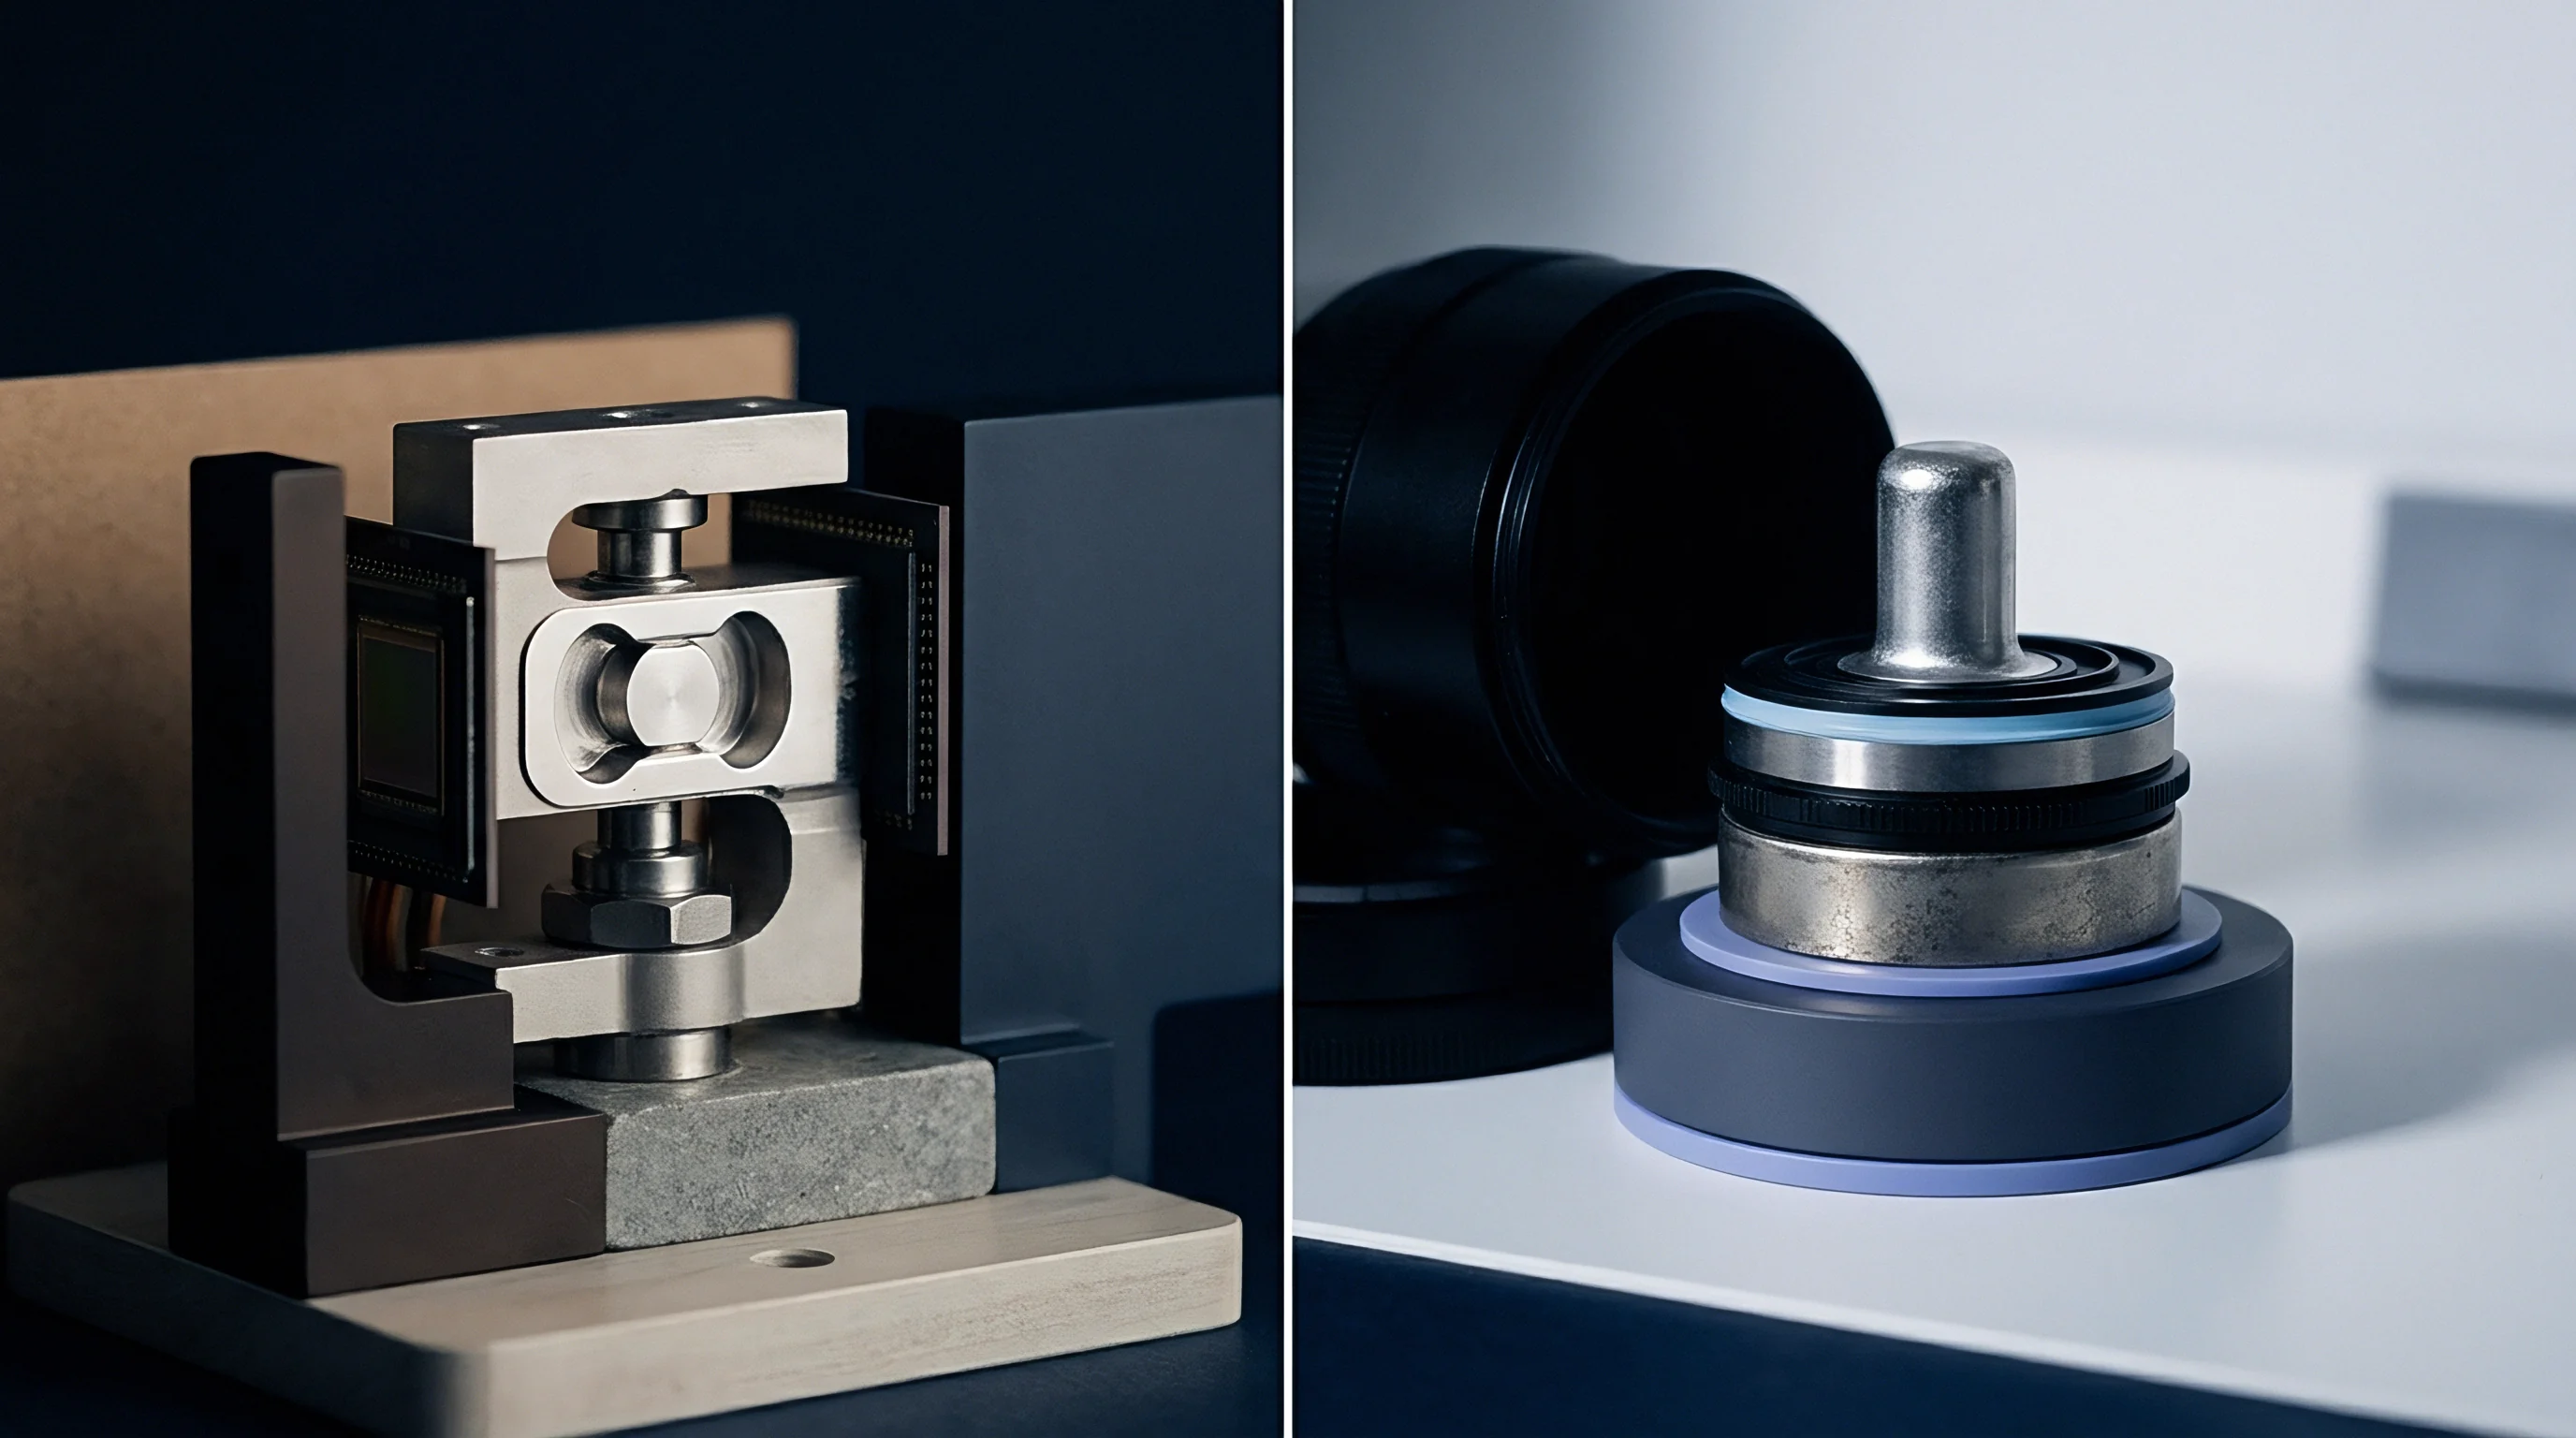
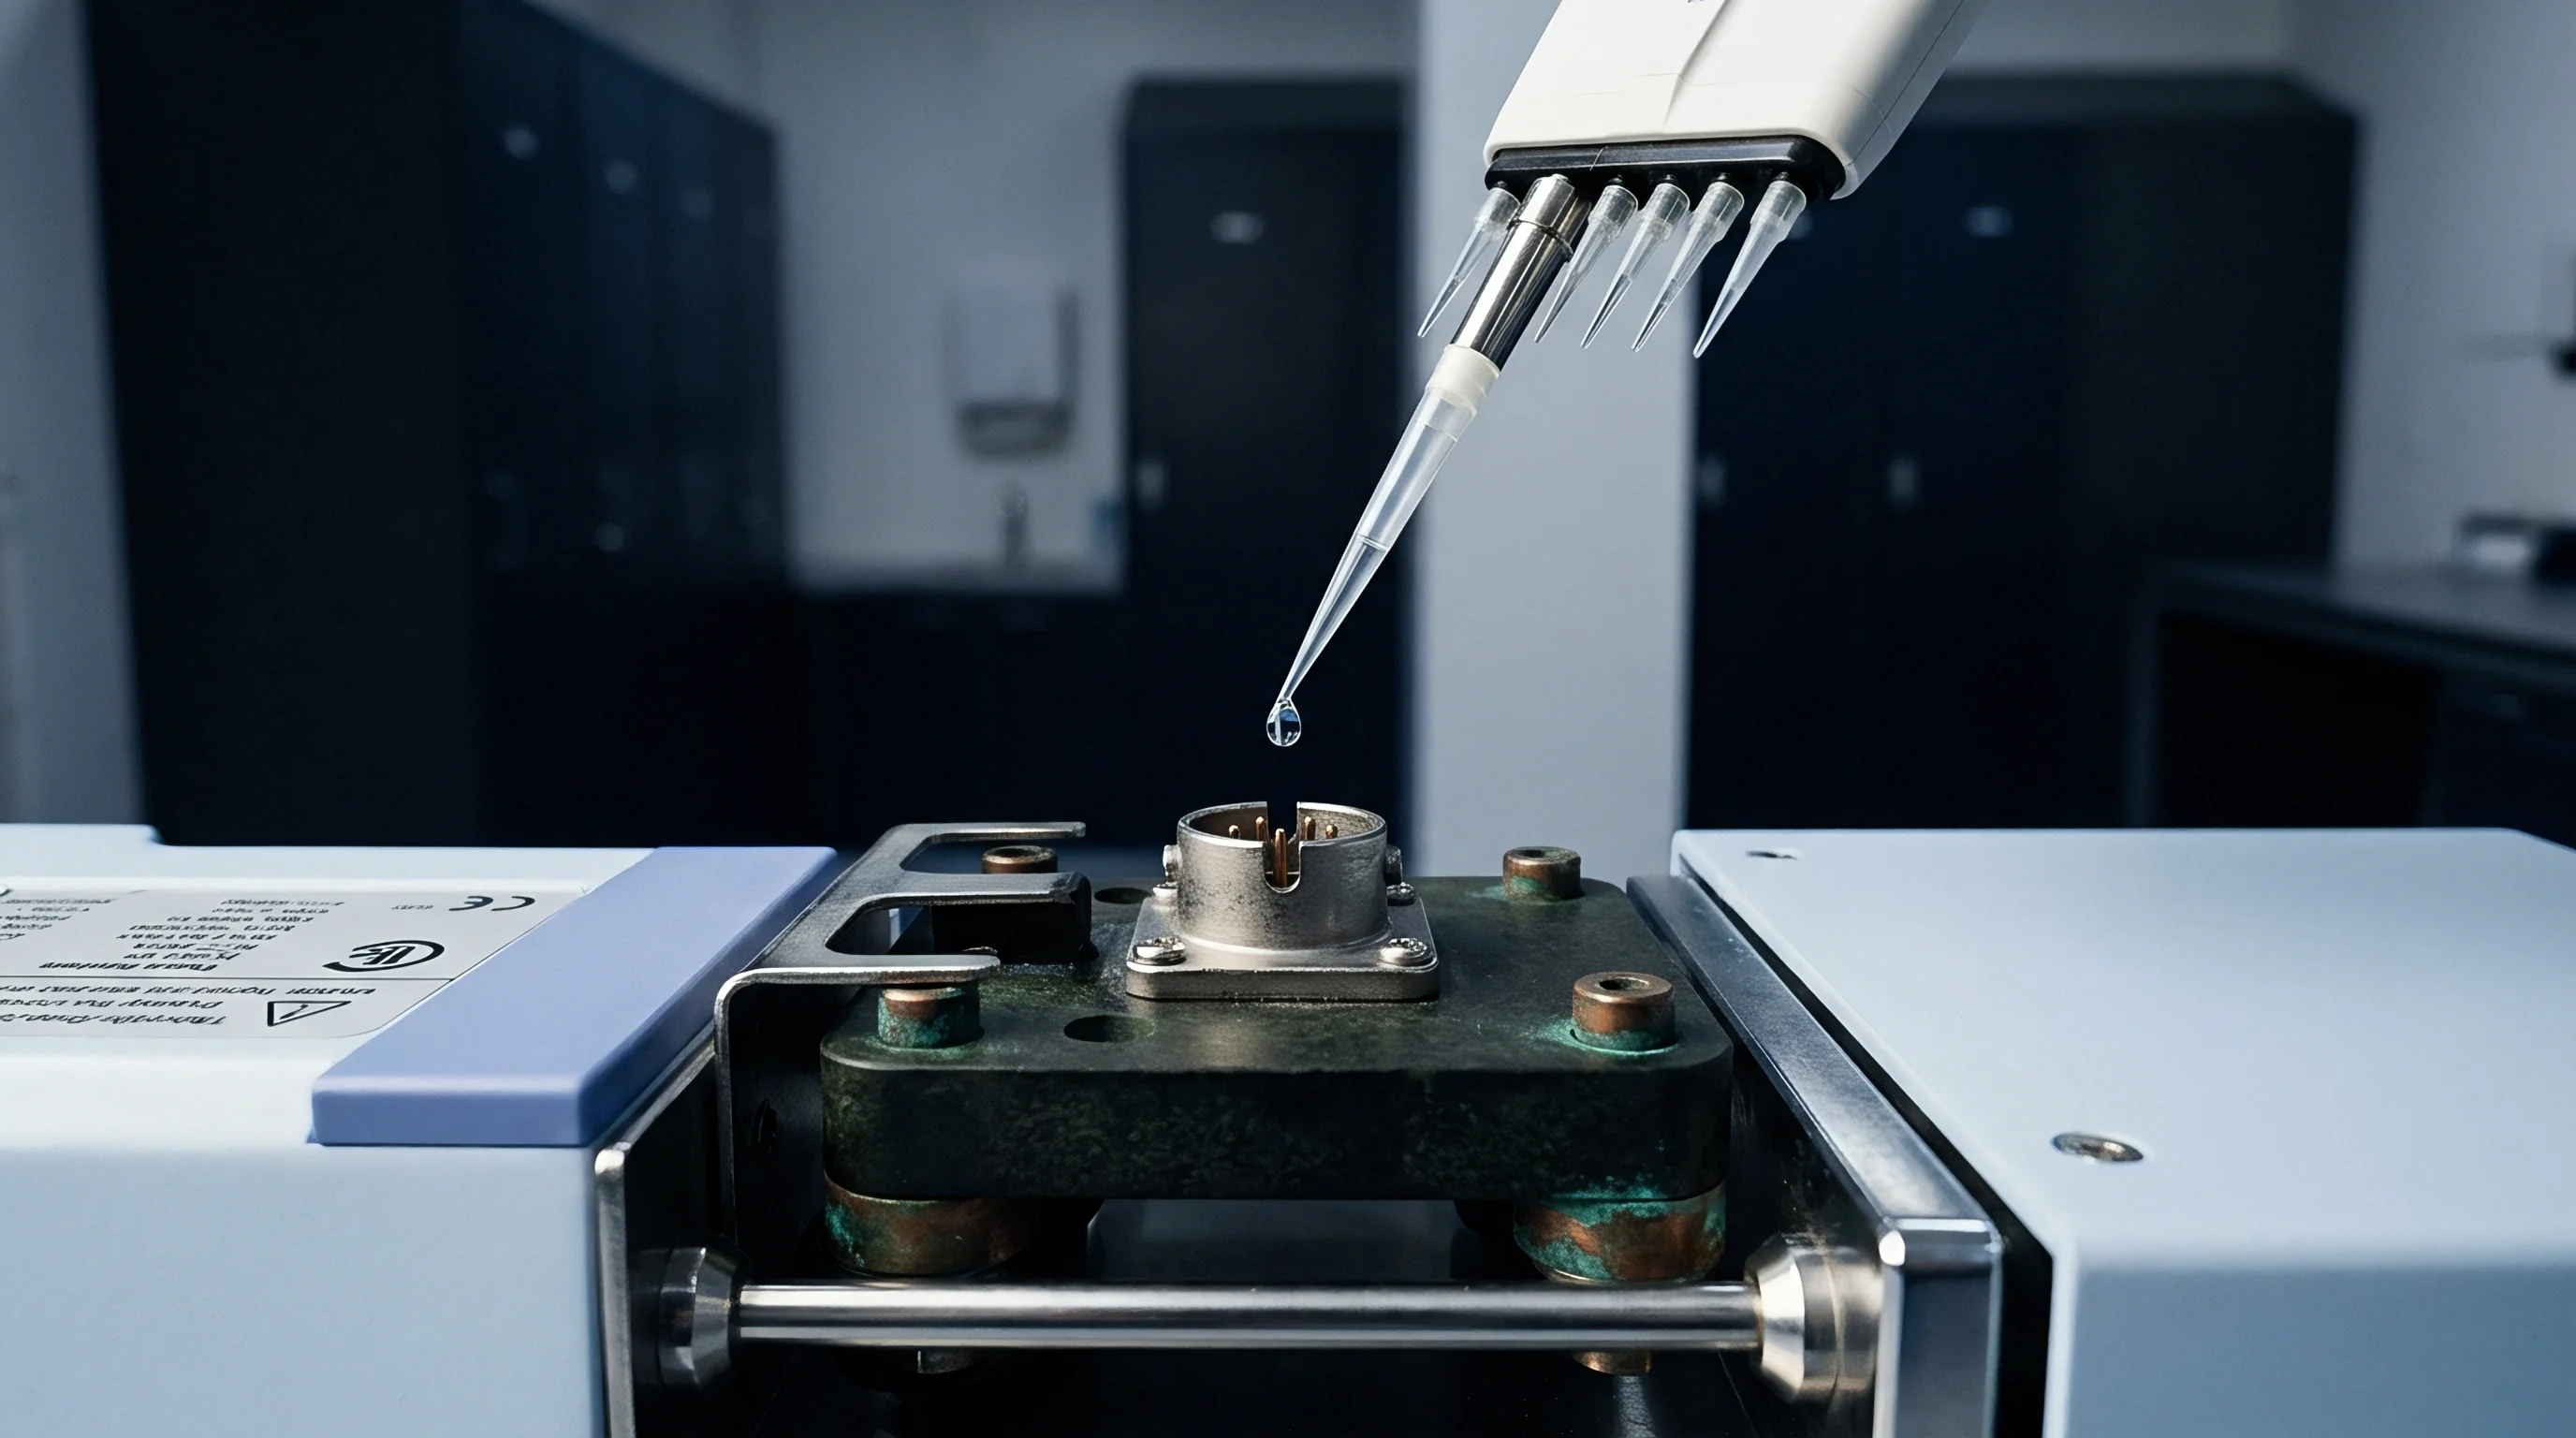
Gravimetric analysis provides the most direct laboratory pathway to confirm the exact mass of oil transferred into an isolated pressure module. Measuring the raw core before and after fluid injection yields the precise oil mass when fluid density at laboratory room temperature is accounted for. Precision balances require acoustic isolation.
Thermal shifts distort mass readings.

Gravimetric Balance Setup and Tare Routine
Micro-analytical weighing devices operating at sub-microgram resolution demand climate-controlled containment enclosures to prevent convective air currents from corrupting measurements. Clean conditions prevent external particulates from settling on the sensor shell during weighing sequences. Taring procedures must account for micro-structural component variances before oil filling begins.
The cell body sits inside the weighing chamber until thermal equilibrium matches ambient room conditions.
- Position the dry pressure cell assembly onto the micro-balance pan inside the draftswept enclosure.
- Allow five minutes for electrostatic charge dissipation and thermal equilibration before logging the dry baseline mass.
- Transfer the unit to the vacuum oil filling station using clean cleanroom tweezers.
- Inject the designated fill oil under deep vacuum conditions until the internal header cavity fills completely.
- Seal the fill port using resistance welding or ball-seal swaging methods.
- Return the sealed unit to the micro-balance pan and record the wet mass.
- Subtract the dry baseline mass from the wet mass to isolate net oil fill mass.
Sub-microliter fill volumes require mass resolution down to zero point zero one milligrams. Air buoyancy corrections apply when fluid density deviates significantly from steel calibration weights. Ambient room temperature, barometric pressure, and relative humidity feed into the buoyancy equation to maintain gravimetric accuracy.
ISO 10012 Section 7.2 dictates that calibration protocols for micro-gravimetric instruments specify thermal equilibration times prior to batch acceptance measurements.
Suppliers frequently defend fill mass variations by claiming that fluid viscosity changes during cold-injection procedures make needle dispense repeatability impossible to hold tighter than five percent across automated assembly shifts.

Deflection
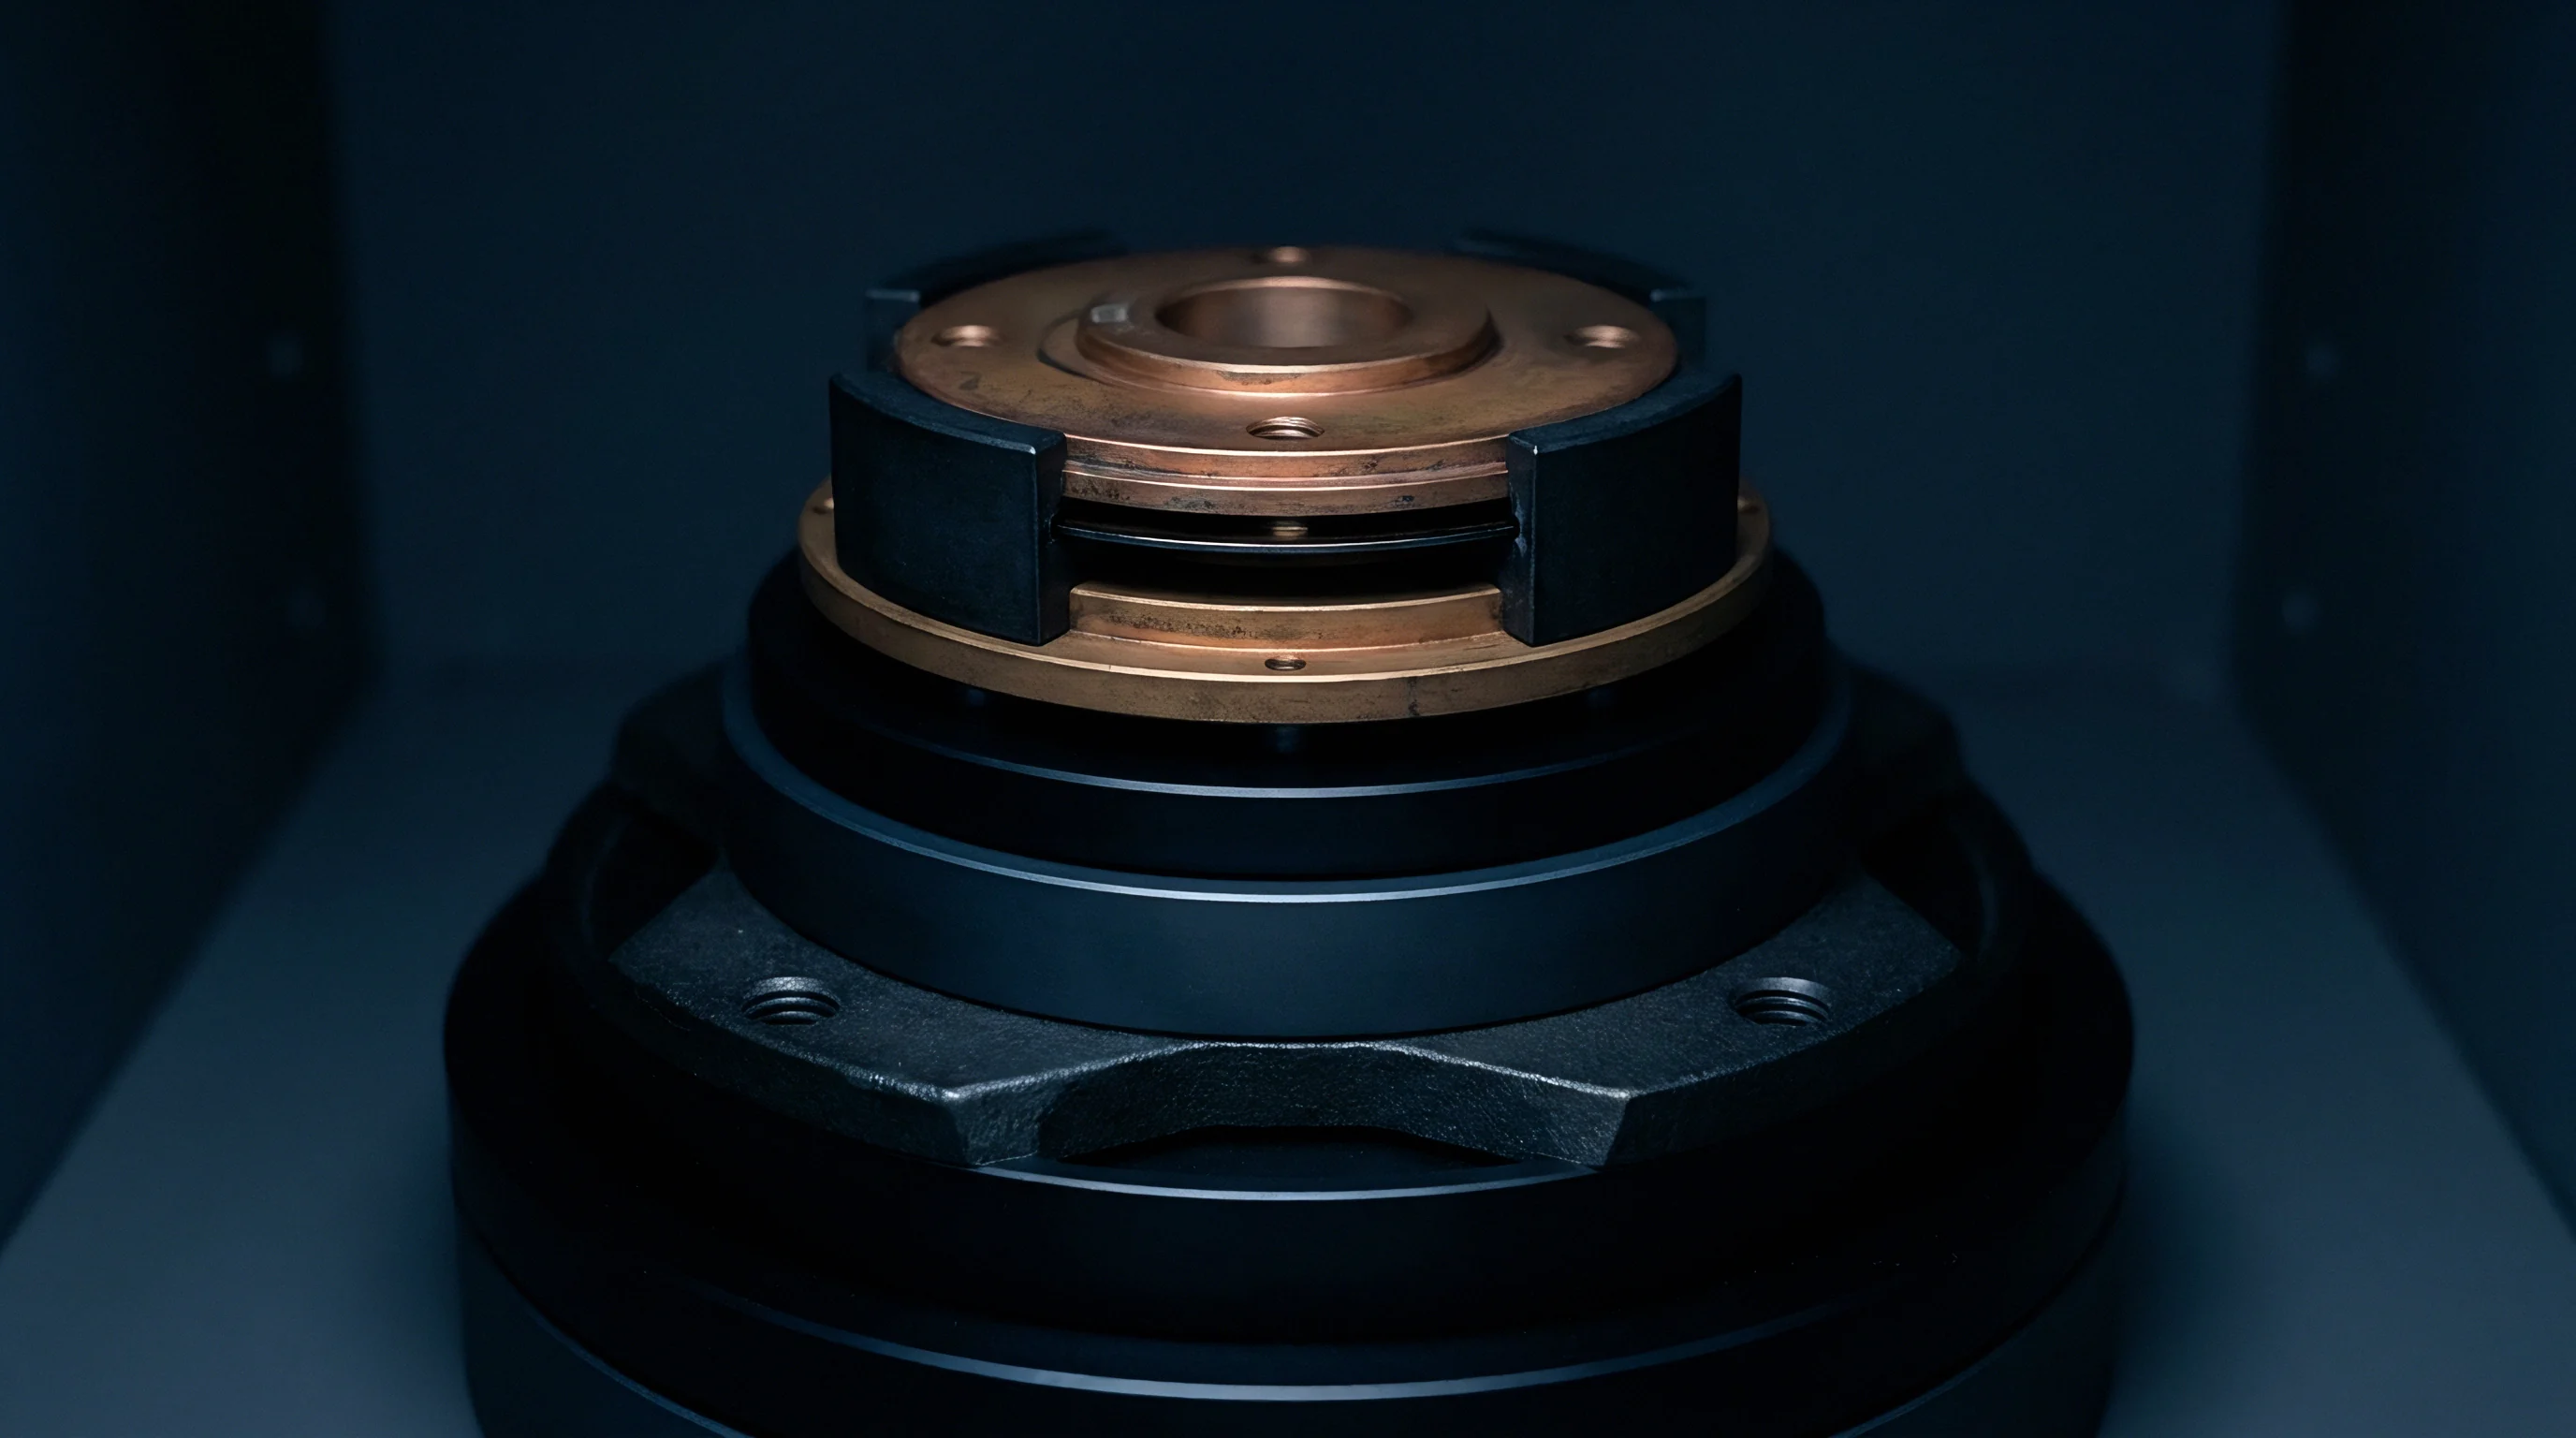
Optical surface profiling measures the resting profile of the thin isolating diaphragm to evaluate internal hydraulic volume without breaching the oil cavity. The metallic membrane forms a predictable surface dome based on internal oil pressure and mass loading. Laser interferometers map surface height.
Non-destructive laser inspection delivers inline batch monitoring without exposing the internal oil cavity to atmospheric contamination.
Has Interferometric Deflection Mapping Replaced Thermal Zero Drift Testing?
Non-contact laser metrology isolates diaphragm expansion profile changes faster than multi-hour environmental chamber temperature sweeps. Laser profilometers project a focused beam across the diaphragm diameter, recording surface elevation down to nanometer resolution. Overfilled pressure cells display outward central diaphragm swelling, while underfilled modules exhibit concave center depressions or asymmetrical wrinkles near the outer edge seal.
Diaphragm compliance shifts sensor span. Measuring the central dome height under zero applied external pressure provides a structural indicator of internal oil mass loading. Correlating surface topography maps to volumetric benchmarks confirms fill volume consistency before modules pass to final calibration stations.
| Verification Method | Volumetric Uncertainty (µL) | Cycle Time per Unit | Destructive Status | Inline Suitability |
|---|---|---|---|---|
| Gravimetric Differential Weighing | ±0.05 | 8–12 minutes | Non-destructive | Low (Offline sampling) |
| Laser Interferometric Profilometry | ±0.12 | 3–5 seconds | Non-destructive | High (100% inline) |
| Environmental Thermal Zero Shift (TCO) | ±0.25 | 45–90 minutes | Non-destructive | Medium (Batch screening) |
| Helium Mass Spectrometry Void Analysis | ±0.02 | 15–30 minutes | Destructive | Low (Failure analysis) |
Screening decisions rely on structural and thermal criteria across assembly lots.
- Central Dome Height Index validates whether the isolating diaphragm rests within the acceptable planar displacement envelope.
- Thermal Expansion Slope confirms that internal oil expansion matches predicted structural limits across temperature steps.
- Elastic Hysteresis Margin verifies that membrane deformation returns to baseline post-thermal cycling.
- Acoustic Resonance Shift evaluates oil-membrane coupled frequency response variations caused by gas void formation.
Diaphragm surface height variation beyond the elastic boundary indicates internal oil overfill or trapped gas pockets.
Diaphragms resting inside normal displacement boundaries guarantee long-term mechanical stability without risking premature diaphragm fatigue.

Discrepancy
Disagreements between factory volume metrics and field performance emerge when trapped micro-bubbles of atmospheric gas alter internal compliance. Atmospheric gases dissolved in hydraulic fill fluid expand under reduced pressure or elevated temperature, changing the internal volume dynamic. Void fractions alter sensor response.
Gas micro-bubbles compressed under pressure collapse. Gravimetric measurements record gross fill fluid mass, but gravimetric methods fail to detect trapped air bubbles that offset effective hydraulic fluid volume.
Micro-Cavitation and Entrapped Gas Mechanics
Sub-atmospheric operating pressures force dissolved air out of solution within silicone oil channels, forming compressible pockets behind the diaphragm. Unfilled micro-cavities retain trapped gas. Small gas voids introduce high volumetric compliance, absorbing applied pressure before transmitting force to the silicon strain gauge.
Sensor output exhibits non-linear response curves at low pressure ranges.
Mass determination eliminates optical reflection. Combining vacuum degassing procedures with gravimetric mass confirmation ensures that the measured fill weight represents pure oil rather than a gas-liquid emulsion.
- Gas Phase Nucleation occurs when incomplete evacuation leaves ambient air pockets inside narrow header oil channels.
- Volumetric Compliance Spike manifests as a sharp drop in sensitivity at low operating pressures due to gas compression.
- Thermal Zero Instability develops as internal gas expands rapidly during ambient temperature increases.
- Vacuum Pressure Flatline takes place when diaphragm seating occurs prior to full-scale pressure transmission.
Factory test certificates must conform to MIL-STD-883 Method 1014 conditions for hermetic seal integrity and oil cavity void limits, establishing that micro-leak rates remain below 10⁻⁸ atmospheric cubic centimeters per second before oil injection approval.


Ledger
Quality assurance economics dictate the balance between high-throughput screening and exhaustive metrological verification for pressure sensor manufacturing lines. High-end industrial transmitters warrant full gravimetric tracking alongside inline optical surface profiling. Consumer or automotive grade sensors rely on statistical sampling and batch thermal zero shift screening to limit per-unit testing overhead.
Verification Throughput and Scrap Yield Economics
Process selection directly influences per-unit manufacturing cost through bench cycle times and false rejection rates. Gravimetric weighing adds manual handling steps that increase labor costs per sensor unit. Inline laser profilometry requires higher capital investment up front but drops verification costs to pennies per unit over large production runs.
| Verification Option | Capital Equipment Cost (USD) | Direct Labor Cost per Unit (USD) | False Rejection Rate (%) | Economic Break-Even Volume |
|---|---|---|---|---|
| Manual Gravimetric Weighing | 12,000 | 4.50 | 1.2 | < 5,000 units/year |
| Automated Laser Profilometry | 85,000 | 0.15 | 0.3 | > 25,000 units/year |
| Thermal Zero Chamber Sweeps | 35,000 | 1.80 | 2.1 | 10,000–25,000 units/year |
| Methods analysis based on 50,000 unit annual production run assumptions. | ||||
Choosing an inline verification scheme balances capital payback against warranty risk exposure. Sub-microliter fill errors that bypass factory screening manifest as field thermal zero drift claims, eroding margin across long-term service contracts.
In-line optical height profiling reduces sensor batch testing durations from hours to seconds while maintaining volumetric discrimination.
Which combined optical and gravimetric inspection thresholds offer the highest yield confidence without inflating test costs beyond acceptable commercial boundaries?