Quantifying Cell Compression Coefficients in Deep CTD Hyperbaric Calibration Documentation
Quantifying CTD cell compression requires empirical hyperbaric chamber testing to derive unit-specific beta coefficients and prevent deep salinity offsets.


Bore

Geometry under Isostatic Hydrostatic Load
Deep ocean conductivity measurements convert electrolytic conductance inside an insulated flow path into seawater conductivity. The flow channel geometry dictates the cell factor, defined as the ratio of effective electrical path length to inner cross-sectional area. Hydrostatic pressure in abyssal trenches reaches 70 to 110 MPa, squeezing the physical walls inward and shortening the axial span.
Volumetric strain acts on the structural material, altering inner diameter and electrode placement simultaneously. Standard laboratory calibrations conducted at atmospheric pressure yield a baseline cell factor that drifts systematically when submerged. When hydrostatic compression shrinks the flow channel, the geometric resistance increases, causing an uncorrected CTD instrument to underreport seawater electrical conductivity at depth.
The physical deformation follows linear elasticity within classical thin-wall and thick-wall pressure vessel mechanics. Because hydrostatic pressure acts uniformly across both outer and inner wet surfaces in an open-flow conductivity cell, the material experiences pure isostatic compression rather than a differential wall gradient. Under true isotropic load, the fractional change in length equals the linear compressibility of the substrate material.
The fractional change in cross-sectional area equals twice the linear compressibility. The cell factor shifts in direct proportion to the net difference between axial shortening and cross-sectional contraction.
A borosilicate flow channel contracts radially twice as much as it shortens along its longitudinal axis under uniform hydrostatic exposure.
External field constraints introduce shear forces where mounting brackets, silicone sleeves, or epoxy potting touch the flow tube. Rigid end-clamps restrict longitudinal contraction, forcing the substrate into complex stress patterns that depart from pure isotropic strain. These boundary constraints generate localized hoop stresses near platinum ring interfaces.
A sensor designer who assumes unconstrained bulk compression miscalculates the true geometric factor by several parts per million per hundred decibars. The resulting salinity calculations show artificial vertical gradients in stable abyssal water masses where salinity should remain uniform.

Mechanical Distortions in Cell Housings
Mounting methods alter how the measuring channel reacts to extreme hydrostatic pressure:
- Unconstrained ceramic isolation permits uniform volumetric shrinkage across all spatial axes while preserving internal bore cylindrical geometry.
- Epoxy potting encapsulation exerts asymmetric lateral compressive loads during deep descent because polymeric matrices exhibit compressibility tenfold higher than alumina or borosilicate glass.
- Elastomeric O-ring compression seals generate localized axial shear stresses across electrode margins when hyperbaric loading forces seal expansion into relief gaps.
- Rigid titanium end-flanges suppress longitudinal contraction, shifting cell distortion into non-linear internal bore tapering near inlet boundaries.
Uniform shrinkage maintains straight cylindrical geometry. Asymmetric clamping bends the internal bore into an irregular hourglass shape. That distortion shifts the electric field lines inside the measurement zone, moving the effective electrical boundary away from mechanical electrode boundaries.
Precise oceanographic documentation accounts for mounting mechanics rather than citing handbook compressibility coefficients for bare glass. Outer support structures dictate operational cell geometry under oceanic pressures.
Soft mounts absorb housing deformation before stress reaches the sensing zone.


Modulus

Substrate Material Compressibility Mechanics
Bulk mechanical properties determine the theoretical baseline for cell deformation. Oceanographic conductivity cells employ either Schott Duran borosilicate glass, fused quartz, or high-purity polycrystalline alumina ceramic. Fused quartz exhibits an anomalous compressibility behavior: its bulk modulus decreases with initial pressure increases up to approximately 2 GPa before stiffening under higher loads.
Borosilicate glass behaves with greater linearity across abyssal pressure scales, maintaining a predictable volumetric decrease across 0 to 100 MPa. Alumina ceramics feature a substantially higher Young modulus, reducing physical deformation to less than half that of silicate glasses under equivalent deep-sea pressures.
The volumetric compression coefficient relates to the Young modulus and Poisson ratio of the cell substrate through classical linear elasticity. Linear compressibility equals the reciprocal of three times the bulk modulus. When evaluating material options, sensor fabricators evaluate these physical constants across deep-sea operational temperatures ranging between minus two and thirty-five degrees Celsius.
Temperature influences the elasticity coefficients, creating a subtle coupling between hyperbaric compression and thermal contraction.
| Substrate Material | Young Modulus (GPa) | Poisson Ratio | Bulk Modulus (GPa) | Linear Compressibility (per dbar) |
|---|---|---|---|---|
| Borosilicate Glass (Schott 8330) | 64.0 | 0.20 | 35.6 | -9.36e-7 |
| Fused Quartz (Corning 7980) | 72.7 | 0.17 | 36.7 | -9.08e-7 |
| Alumina Ceramic (99.5% Al2O3) | 370.0 | 0.22 | 220.2 | -1.51e-7 |
| Optical Glass (BK7) | 82.0 | 0.206 | 46.5 | -7.17e-7 |
Linear compressibility translates into conductivity changes through geometric derivation. In an unconstrained cylinder of initial length and inner cross-sectional area, the operational cell factor under pressure equals the initial factor multiplied by one plus linear compressibility times pressure. The cross-sectional area contracts by twice the linear strain, while length contracts by single linear strain.
The cell factor increases under pressure, which lowers the apparent measured resistance for a given fluid conductivity. Failure to compensate for substrate compression produces an artificial drift toward higher calculated salinity at the bottom of deep oceanic profiles.

Thermal Coupling and Elasticity Deviations
Hyperbaric calibration documentation requires separation of pure mechanical stress from thermal strain. Seawater temperature drops from twenty degrees at the surface to near zero degrees in abyssal layers. Thermal contraction of borosilicate glass operates with an expansion coefficient near 3.3 microstrain per Kelvin.
Hydrostatic compression at 6000 dbar generates roughly 5600 microstrain of mechanical deformation. The mechanical effect dwarfs the thermal contraction by three orders of magnitude, yet calibration models must isolate both variables to maintain millitechnical salinity integrity.
Glass manufacturers report mean bulk modulus from acoustic velocity measurements conducted on annealed blank samples. Real conductivity cells undergo heating, localized flame working, and platinum electrode plating during fabrication. These thermal processing cycles leave residual stresses that alter the localized bulk modulus by five to eight percent relative to published raw material datasheets.
Calibrating engineers cannot rely solely on handbook values when documenting hyperbaric performance for sub-milligram per kilogram salinity verification.
Annealing irregularities cause individual cell blanks to deviate from published engineering handbooks.


Equation
Formulations for Pressure Compensation
Oceanographic standards establish mathematical relations to remove cell distortion from raw conductivity observations. The classical formulation published for oceanic CTD instrumentation expresses the pressure-corrected conductivity as a transfer function applied to raw output. Raw measured conductivity relates to true water conductivity through the cell thermal expansion coefficient and the cell compression coefficient.
The standard Sea-Bird conductivity relationship defines the correction factor explicitly:
C_true = C_raw / (1 + alpha (T – T_0) + beta P)
The parameter alpha denotes the thermal expansion coefficient of the cell, set to minus 9.57e-6 per degree Celsius for borosilicate glass. The parameter beta represents the cell compression coefficient, typically specified around minus 9.57e-8 per decibar. Temperature T is expressed in degrees Celsius with reference T_0 at zero degrees, while pressure P represents gauge pressure in decibars.
The negative sign for beta indicates that increasing pressure reduces physical cell volume, expanding the cell factor and elevating measured conductance.
A cell compression discrepancy of two percent produces an uncorrected salinity error exceeding 0.003 PSS-78 at six thousand decibars.
The UNESCO 1983 algorithms use an alternative representation where conductivity ratio adjustments incorporate pressure terms directly inside polynomial expansions. Modern ocean research networks, including GO-SHIP and Argo, demand consistent mathematical handling between profiling floats and shipboard package profiling units. Minor variations in polynomial definitions or sign conventions introduce processing errors that corrupt multi-decadal salinity trend archives.
Stepwise Derivation of Beta from Hyperbaric Data
Empirical quantification of beta proceeds through structured calibration cycles:
- Fill a hyperbaric testing chamber with high-stability reference seawater of verified isotopic composition and known salinity near 35 PSS-78.
- Stabilize fluid temperature within two millikelvins using an external circulating thermostatic bath running continuously for four hours.
- Record baseline conductivity and temperature readings at atmospheric pressure to determine the uncompressed cell constant.
- Raise hydrostatic pressure in sequential steps of 1000 dbar up to 6000 dbar, holding each plateau for twenty minutes to allow dissipation of adiabatic compression heat.
- Monitor reference platinum resistance thermometers positioned adjacent to the conductivity cell electrodes throughout each pressure dwelling stage.
- Compute the isothermal conductance shift between atmospheric baseline and each hyperbaric pressure level.
- Fit the linear slope of fractional conductance deviation against pressure using ordinary least-squares regression to extract the empirical beta value.
Calculations demand rigorous temperature tracking. Adiabatic heating warms seawater by roughly 0.2 to 0.9 Kelvin during a rapid repressurization to 6000 dbar. Because seawater conductivity shifts by approximately two percent per Kelvin, failing to wait for complete thermal equilibrium invalidates the empirical pressure coefficient derivation.
| Gauge Pressure (dbar) | True Salinity (PSS-78) | Apparent Salinity: Nominal Beta (-9.57e-8) | Apparent Salinity: Glass Defect Beta (-8.90e-8) | Resulting Salinity Offset (PSS-78) |
|---|---|---|---|---|
| 1000 | 34.8500 | 34.8500 | 34.8507 | +0.0007 |
| 2000 | 34.7200 | 34.7200 | 34.7214 | +0.0014 |
| 3000 | 34.6900 | 34.6900 | 34.6922 | +0.0022 |
| 4000 | 34.6800 | 34.6800 | 34.6830 | +0.0030 |
| 5000 | 34.6750 | 34.6750 | 34.6788 | +0.0038 |
| 6000 | 34.6720 | 34.6720 | 34.6766 | +0.0046 |
Uncorrected geometric compression shifts salinity calculations beyond international oceanographic tolerances. Deep profiles show false water mass stratification when processing pipelines apply generic material coefficients across heterogeneous production lots. Marine scientists then misidentify changes in Antarctic Bottom Water ventilation rates based entirely on an uncalibrated cell compression artifact.
Errors multiply rapidly across repetitive hydrographic cruise transects.
Vessel
Hydrostatic Testing Rig Architecture
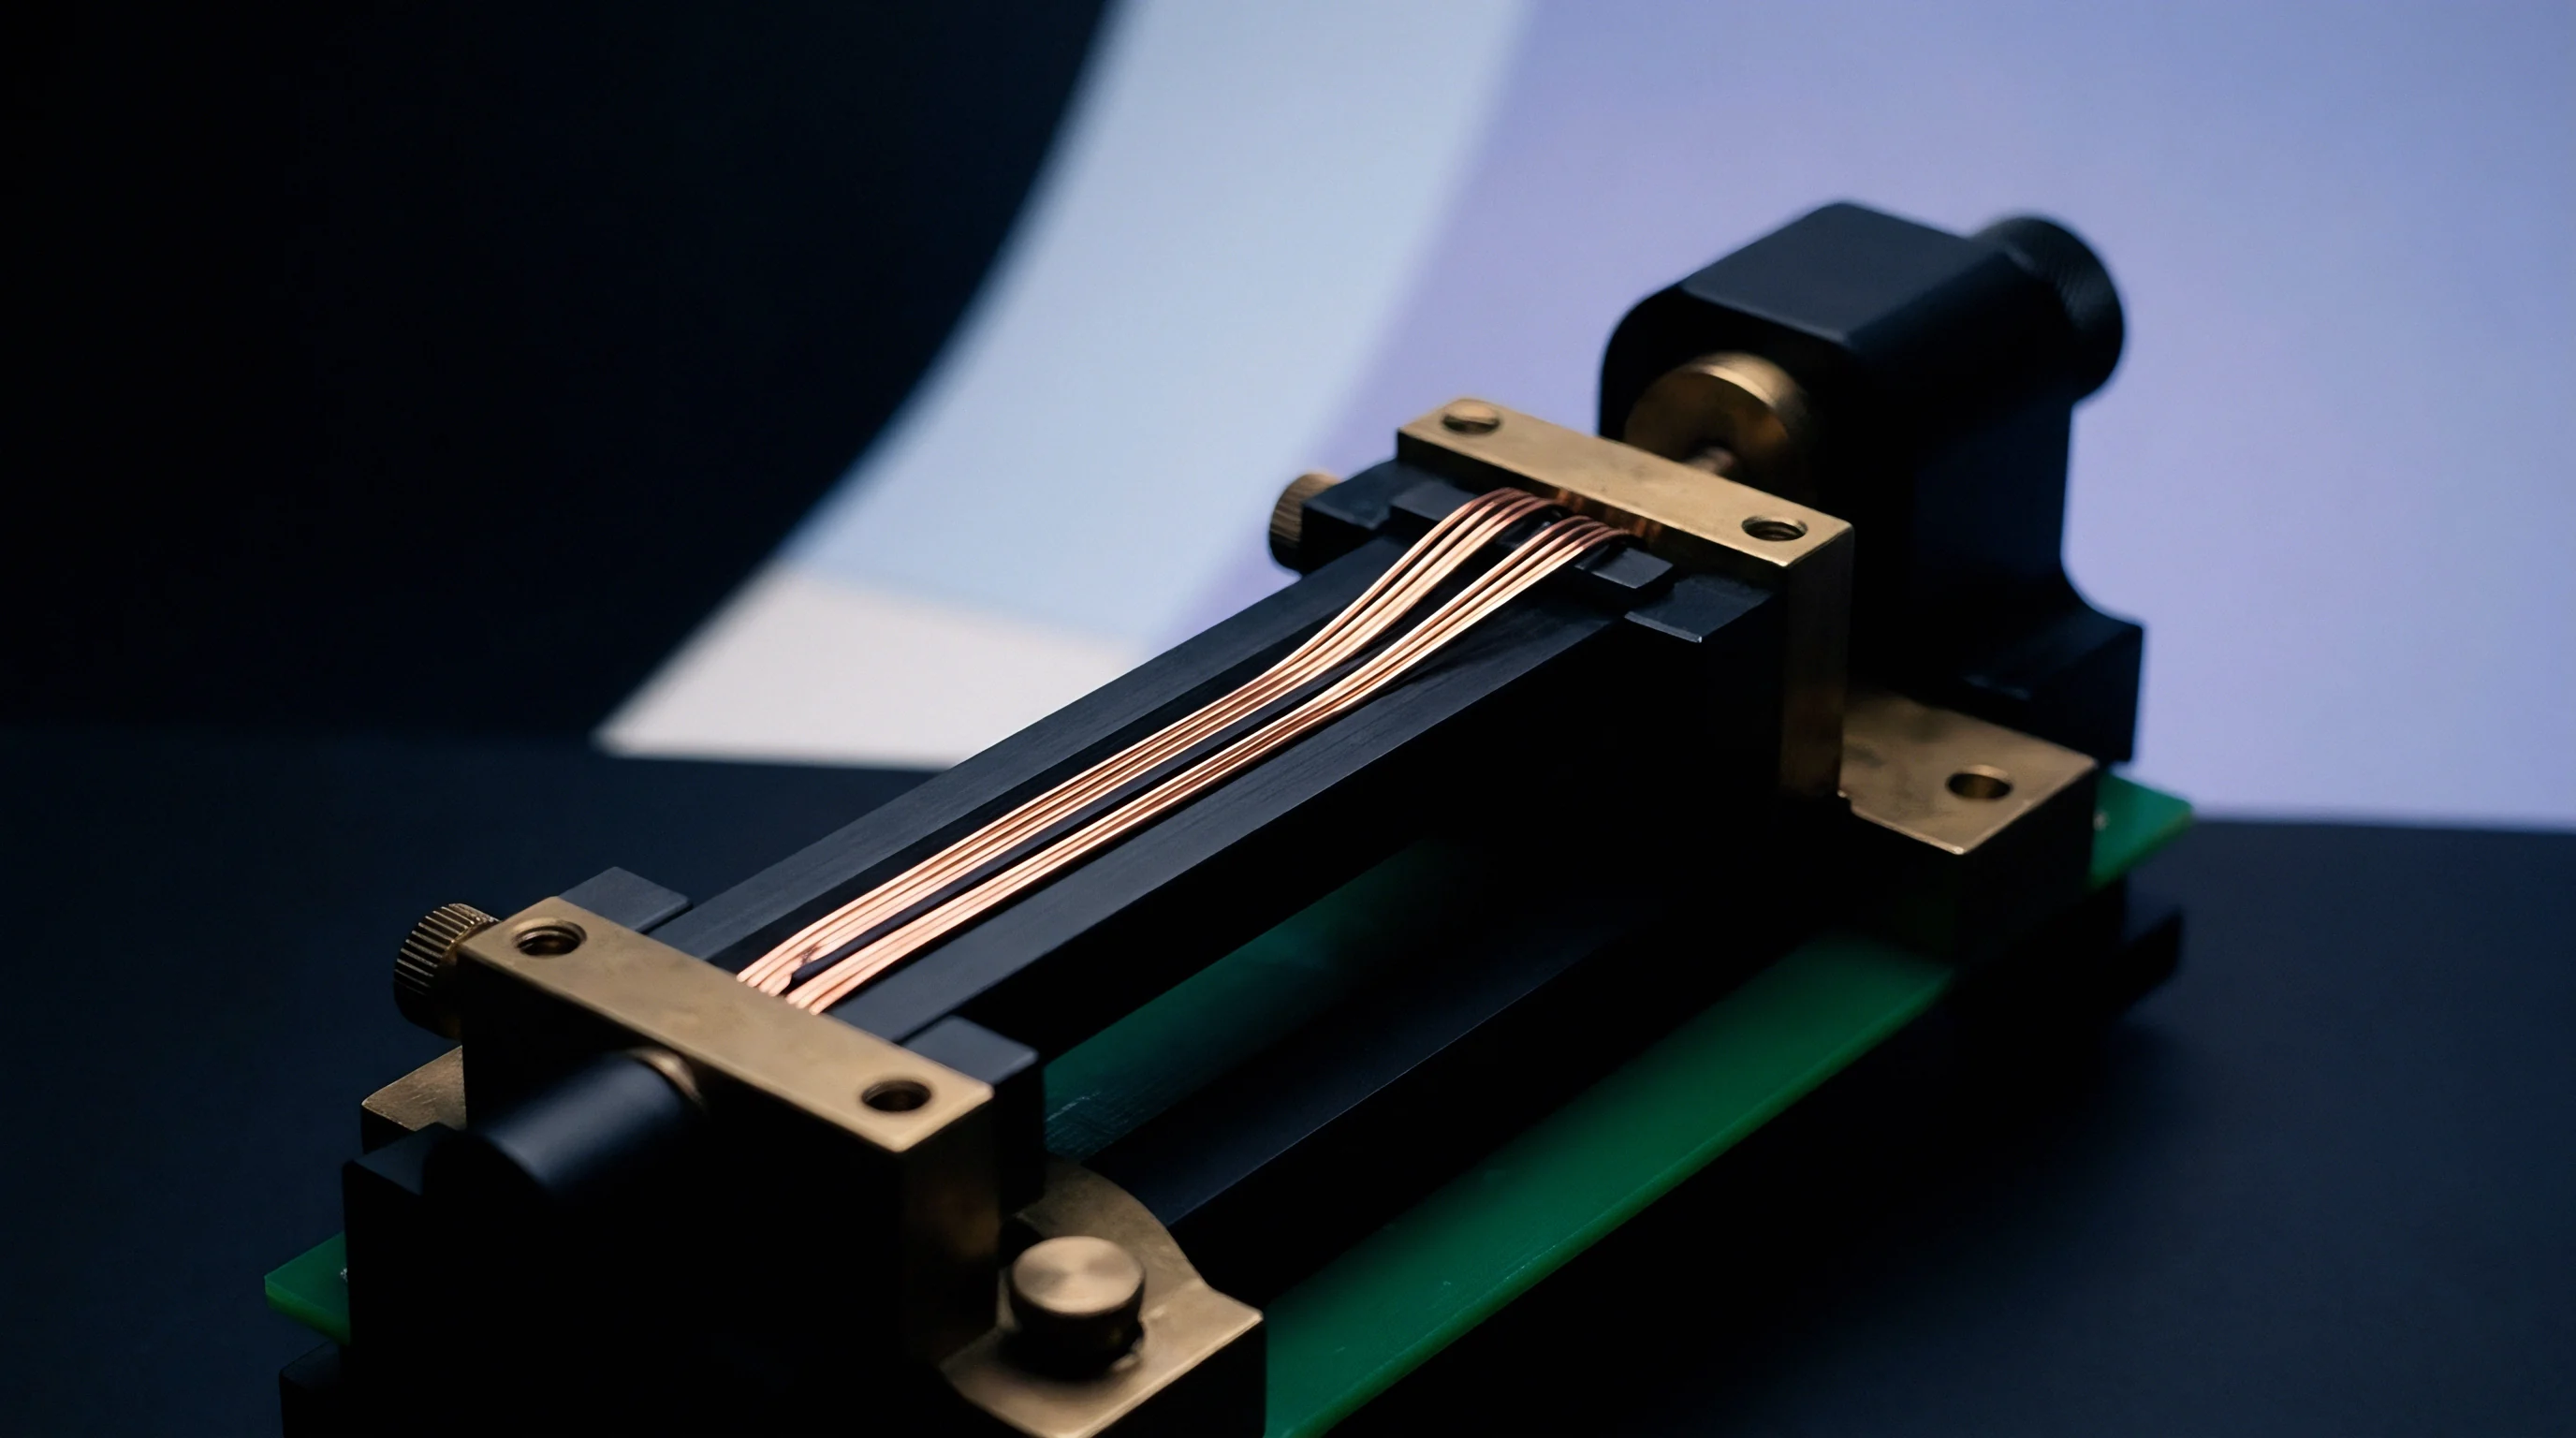
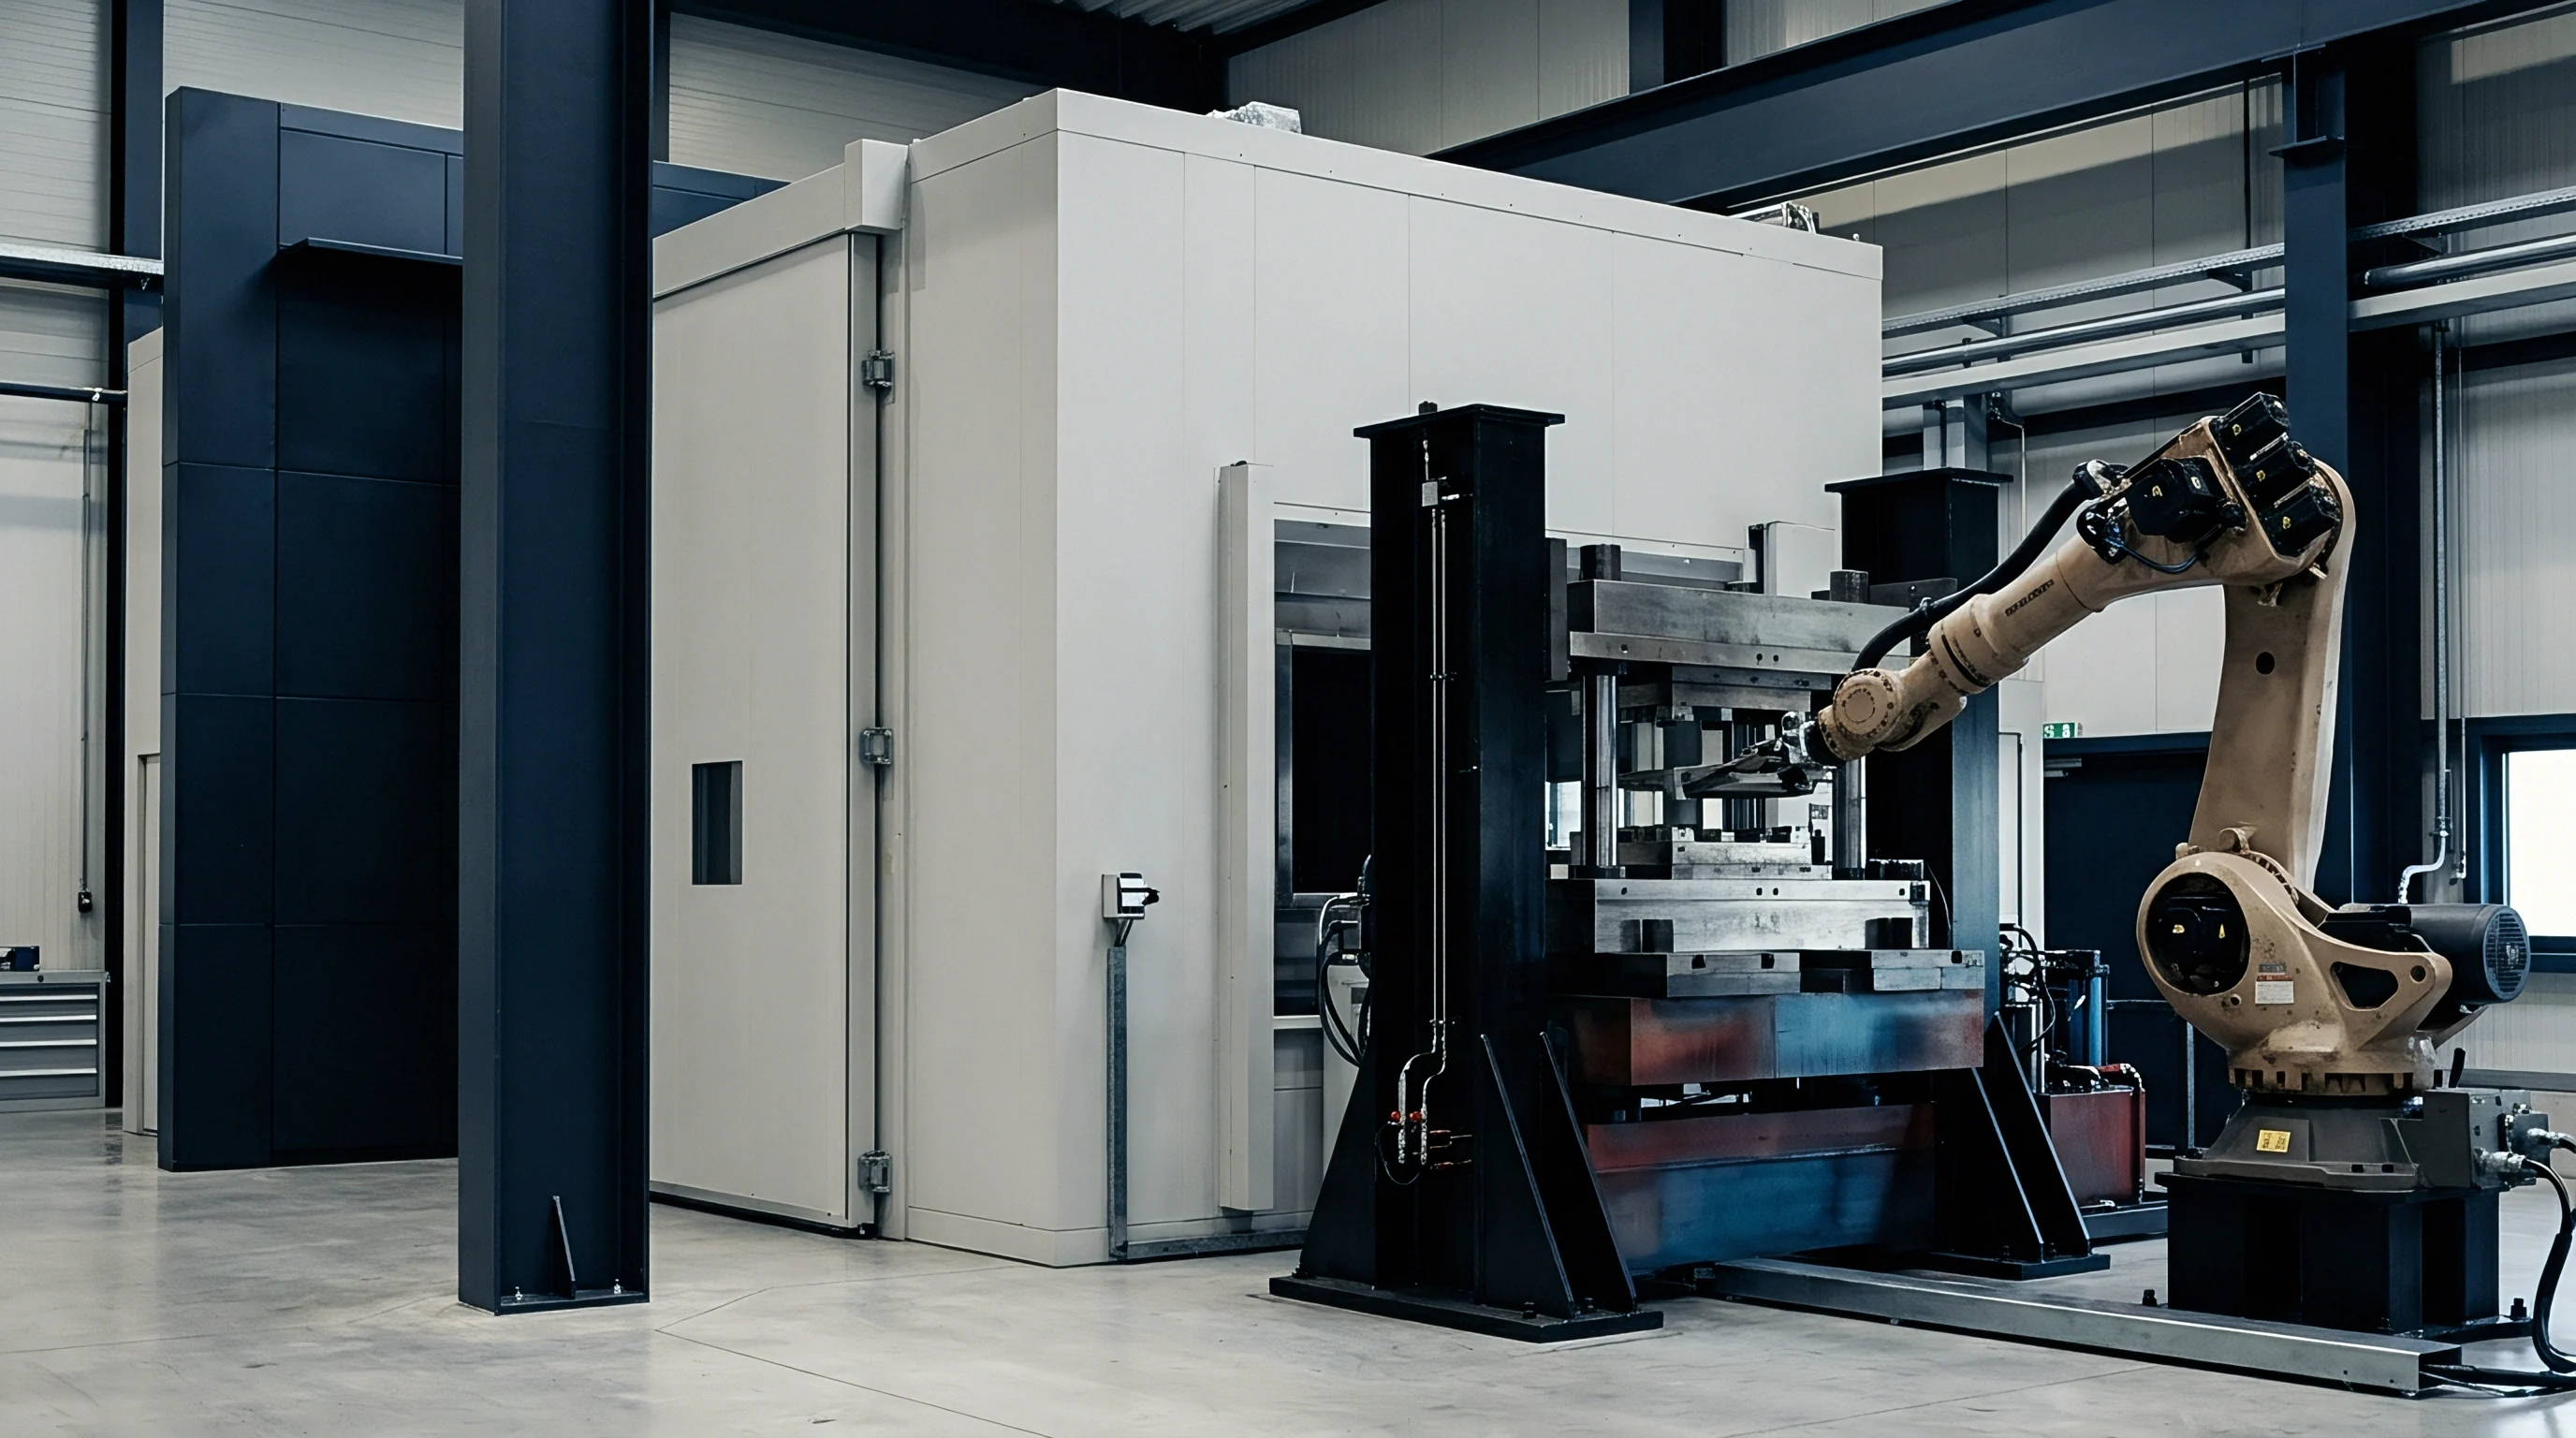
Direct measurement of cell compression coefficients requires specialized hyperbaric metrology facilities. A hyperbaric calibration chamber consists of a thick-walled forged alloy steel pressure vessel capable of operating safely at working pressures up to 100 MPa. The internal chamber volume must accommodate the full oceanographic sensor payload alongside reference thermometers, an internal fluid circulation pump, and hyperbaric electrical feedthrough ports.
Non-magnetic alloys or specialized internal liners prevent chemical contamination of reference salinity standards during high-pressure soak periods.
Mineral oil or hydraulic fluid drives external pressure generation. The testing architecture isolates the hydraulic drive fluid from the internal seawater sample using flexible impermeable membranes or rolling diaphragms. Hydraulic pumps transmit pressure through the barrier while preventing petroleum hydrocarbons from fouling the platinum black coating on cell electrodes.
Contaminated electrodes shift cell capacitance, destroying the phase angle balance inside the conductivity detection bridge circuitry.
Standard hydraulic oil contamination on platinum electrodes alters cell impedance phase angles within seconds of initial contact.
Internal circulation maintains thermal uniformity inside the hyperbaric chamber. Without mechanical stirring, internal fluid stratification creates vertical temperature gradients exceeding ten millikelvins across the length of the cell bore. Circulation pumps operating under 70 MPa must generate zero electromagnetic interference and negligible mechanical heat dissipation.
Precision brushless DC magnetic-coupling stirrers move water through the sensing bore at velocities mimicking oceanic CTD descent rates of one meter per second.
Does Hydrostatic Testing Eliminate Deep Salinity Discrepancies?
Empirical chamber validation identifies unit-specific departures from nominal material properties. Every batch of drawn borosilicate tubing exhibits small variations in wall thickness, circularity, and internal diameter profile. Tubing eccentricity causes asymmetrical stress concentrations under hyperbaric load, producing non-linear geometric deformation profiles that standard single-parameter beta coefficients cannot capture.
Individual hyperbaric calibration profiles provide empirical polynomial coefficients tailored to specific physical assemblies.
Field verification relies on comparisons against discrete rosette water samples collected during deep hydrographic casts. Hydrological analysts collect water using Niskin bottles fired in calm, homogeneous abyssal layers, subsequently measuring sample salinity on laboratory salinometers standardized against IAPSO Standard Seawater batches. When calibrated CTD sensor records match the physical bottle samples across repetitive deep casts, the empirical cell compression coefficient is validated.
Discrepancies between downcast profiles and discrete bottle measurements expose invalid beta coefficients or uncorrected sensor thermal mass lag.
Chamber testing fails to reproduce dynamic descent dynamics fully. In the ocean, external water flows continuously past the sensor body, sweeping away boundary layers and stabilizing skin temperatures. Inside a static hyperbaric testing chamber, boundary layer stagnation alters thermal exchange dynamics between the glass body and surrounding fluid.
Metrology teams continue to evaluate whether static hyperbaric calibrations reproduce dynamic oceanic descent conditions with complete fidelity.


Audit

Calibration Documentation Integrity
Calibration certificates for deep oceanographic instrumentation must explicitly document hyperbaric characterization methods. Many commercial calibration facilities test conductivity sensors solely within atmospheric open-bath calibration systems, recording response across multiple temperature and salinity points while omitting hyperbaric testing entirely. These certificates list a nominal cell compression coefficient beta derived from forty-year-old historical literature rather than empirical chamber testing on the delivered serial number.
A procurement engineer who accepts a standard factory calibration sheet without scrutinizing the hyperbaric verification section leaves deep salinity accuracy unverified.
Reviewing hyperbaric calibration records requires cross-checking multiple recorded parameters. The documentation must detail the calibration chamber fluid composition, the manufacturer and batch number of the primary seawater reference, the type and traceable calibration status of the reference thermometer, and the dwell time at each pressure plateau. Documentation that omits raw sensor frequency readings or conductance values before and after repressurization cycles conceals potential cell micro-cracking, mount slippage, or electrode hysteresis.
| Uncertainty Component | Standard Uncertainty | Probability Distribution | Sensitivity Coefficient | Uncertainty Contribution (mS/cm) |
|---|---|---|---|---|
| Chamber Temperature Drift | 0.0015 K | Normal (k=1) | 0.89 mS/(cm K) | 0.00134 |
| Pressure Transducer Reading | 1.2 dbar | Rectangular | 9.57e-5 mS/(cm dbar) | 0.00007 |
| Reference Salinity Standard Batch | 0.0008 PSS-78 | Normal (k=1) | 0.96 mS/(cm PSS) | 0.00077 |
| Electrode Polarization Shift | 0.0006 mS/cm | Rectangular | 1.00 | 0.00035 |
| Adiabatic Thermal Residual | 0.0020 K | U-shaped | 0.89 mS/(cm K) | 0.00126 |
| Combined Standard Uncertainty (k=1) | — | Root Sum Squares | — | 0.00202 |
| Expanded Uncertainty (k=2) | — | Normal (95% CI) | — | 0.00404 |
The total expanded uncertainty at full abyssal depth demonstrates that hyperbaric conductivity calibration cannot achieve sub-millisiemens precision without extreme thermal control. Adiabatic thermal residuals and chamber drift comprise over eighty percent of the cumulative uncertainty budget. Documented proof of four-hour stabilization dwells remains mandatory for calibration acceptance.
Contractual Acceptance Standards
Institutional buyers operating deep-water observational programs protect instrument investments by writing precise calibration mandates into procurement agreements. A robust specification rejects default catalog coefficients, mandating empirical pressure vessel characterization for every instrument destined for operations deeper than 2000 meters. The procurement dossier must include both the hydrostatic proof test certificate confirming structural integrity and the calibrated beta polynomial curve with associated residuals.
ISO/IEC 17025 accredited oceanographic calibration facilities specify coverage factors, chamber environmental histories, and explicit uncertainty budgets on every hyperbaric test certificate. Sourcing guidelines for autonomous deep profiling fleets require delivery of raw calibration coefficients alongside the processed calibration polynomial file. Field data processing centers upload these unit-specific coefficients directly into global float metadata tables, preventing systematic salinity skew from propagating across oceanographic monitoring repositories.
Standard procurement contracts stipulate that conductivity sensor deliveries failing to document empirical hyperbaric beta testing with expanded uncertainty below 0.004 mS/cm face immediate lot rejection at the receiving dock.