Piezoresistive Pressure Sensor Field Drift Mechanisms and Calibration
Field drift in piezoresistive sensors stems primarily from packaging creep and oil expansion, demanding rigorous uncertainty budgets and scheduled verification.
Mount
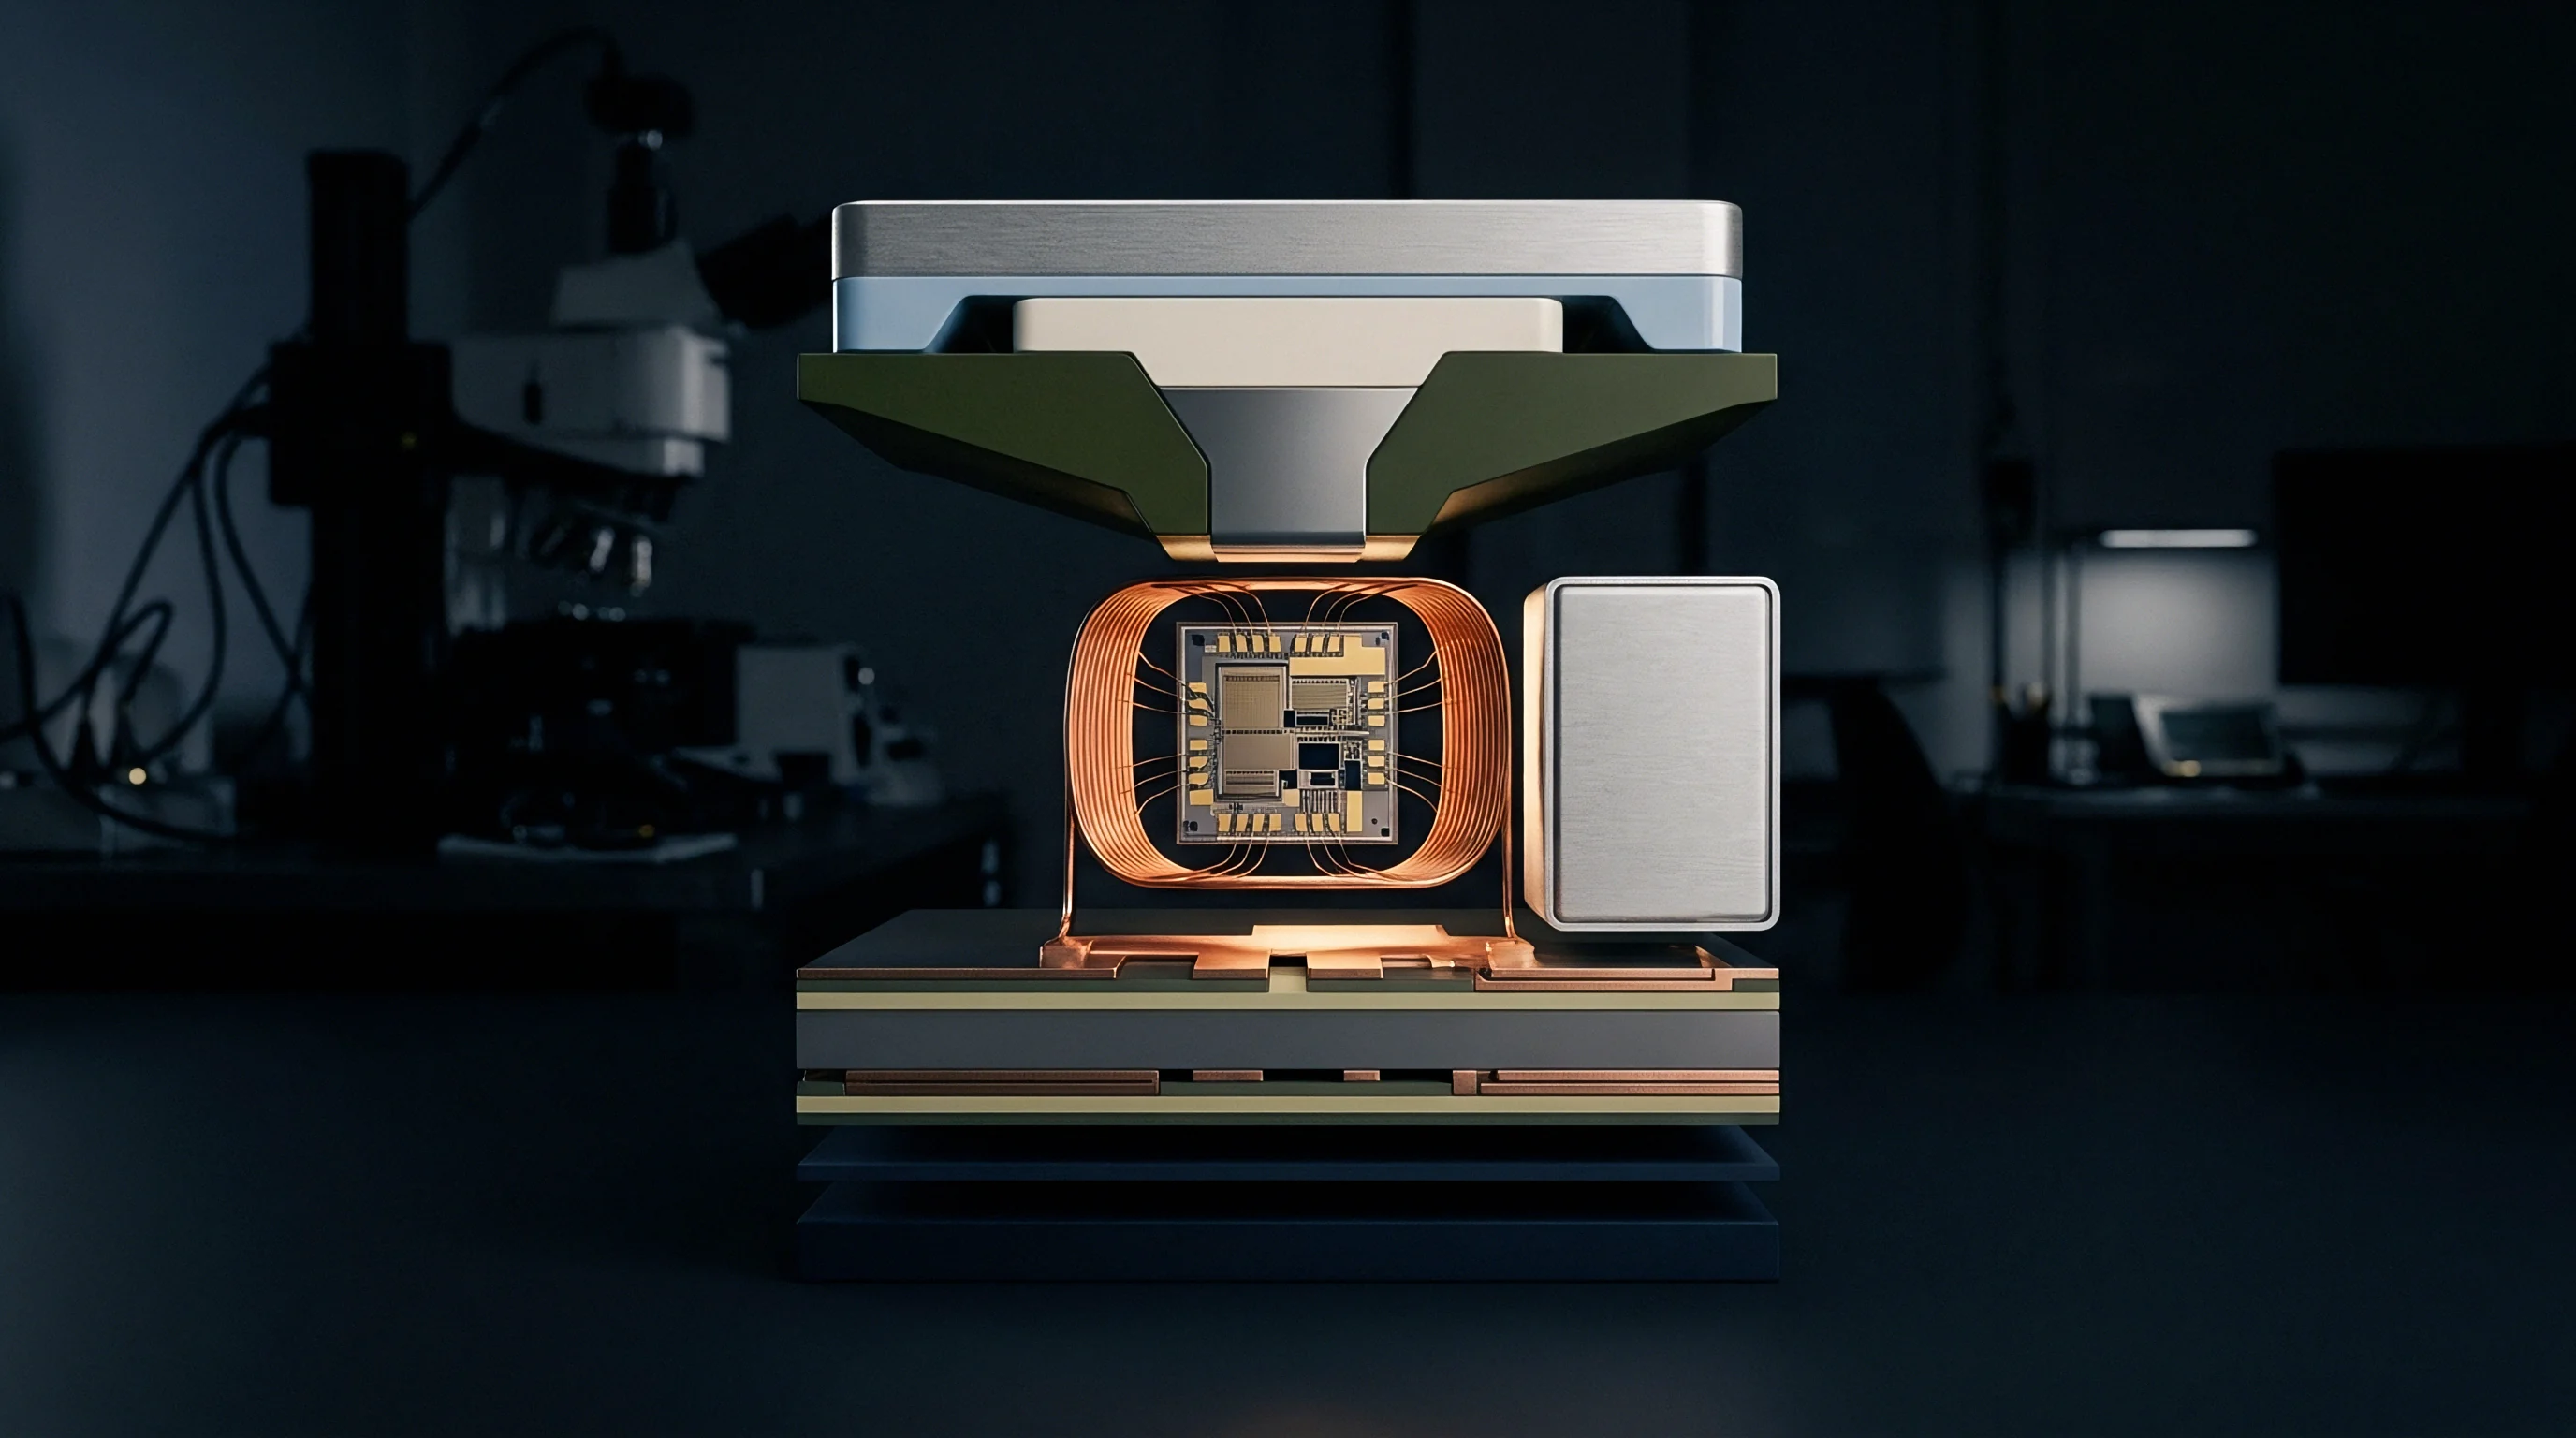
Mechanical stress isolates poorly across the boundary between a silicon sensing element and its metallic header. When pressure media enter a piezoresistive transducer, the measured signal registers both fluid force against the micromachined diaphragm and residual packaging strain. Silicon exhibits minimal mechanical hysteresis below 500 degrees Celsius, but surrounding packaging ~ die-attach adhesives, glass frit seals, ceramic headers, and isolation diaphragms ~ transfers time-dependent strain directly into the Wheatstone bridge resistors.
The resulting zero wander accounts for the majority of unprovoked field calibration failures.
Early-life stability depends heavily on adhesive selection. Room-temperature vulcanizing silicones isolate external mechanical distortion through low elastic moduli, typically 1 to 5 megapascals, yet these elastomers absorb atmospheric moisture over seasonal cycles. That moisture swells the bulk volume, generating compressive loads across the die perimeter.
Epoxies provide stiffer anchoring with moduli between 3 and 12 gigapascals, but they undergo progressive polymerization shrinkage and secondary cross-linking over prolonged operation at elevated temperatures. A 0.02 percent dimensional contraction in an adhesive fillet shifts the zero balance of a 100-millivolt bridge by as much as 1.4 millivolts ~ consuming fourteen percent of an entire 0.1 percent full-scale accuracy envelope before process pressure ever cycles.
A 0.02 percent dimensional contraction in an adhesive fillet shifts the zero balance of a 100-millivolt bridge by 1.4 millivolts under continuous 70 degrees Celsius service.
Eutectic die attachment using gold-tin or gold-silicon preforms eliminates organic creep, though at the cost of steep thermoelastic stresses. Gold-silicon alloys melt at 363 degrees Celsius. As the assembly cools back to room temperature, the wide thermal expansion mismatch between silicon (2.6 parts per million per Kelvin) and stainless steel headers (16 parts per million per Kelvin) leaves substantial residual tension.
Intermediate pedestals made of Kovar or silicon step down this gradient. Even with matched pedestals, residual stresses relax through grain boundary sliding and dislocation glide over thousands of operating hours, presenting at instrument terminals as unrecoverable baseline wander.
Isolated pressure transmitters place a secondary barrier against corrosive media, using an external 316L or Hastelloy diaphragm to deflect fluid pressure into an internal transfer fluid. Silicone oil or fluorinated hydrocarbons fill the hermetic cavity behind the isolation foil. Temperature variations expand this captive oil volume; polydimethylsiloxane oil, for instance, has an average volumetric thermal expansion coefficient of 0.00095 per Kelvin, outpacing the surrounding metal housing by a factor of twenty.
Fluid expansion stretches the convoluted metal diaphragm, generating internal backpressure on the piezoresistive chip. If a micro-leak forms across the circumferential laser weld, fluid bleeds into the process stream. Losing just 0.5 microliters of oil from a 40-microliter fill cavity shifts span calibration downward by three to eight percent, rendering factory compensation polynomials invalid.
- Viscoelastic relaxation alters adhesive bond thickness over time, transferring parasitic shear directly to bridge resistors.
- Isolation oil loss reduces fluid coupling volume, inducing non-linear sensitivity degradation across positive pressure ranges.
- Pedestal joint yield unloads post-brazing compression unevenly, driving continuous positive zero drift on low-range sensors.
- Header feedthrough leakage admits ambient humidity into the reference chamber, degrading absolute zero references.
These baseline excursions are frequently treated as temporary settling effects that vanish after sixty days of continuous energization, rather than permanent structural drift.

Oxide
Dielectric passivation layers deposited over implanted piezoresistors store parasitic electrical charges. Thermally grown silicon dioxide films contain positive fixed oxide charges alongside mobile alkali ions. Sodium and potassium contaminants migrate under internal electric fields generated by bridge supply voltages.
Over months in service, this migration concentrates charge near the silicon surface. The electric field beneath the passivation layer modulates carrier density within p-type boron-doped resistor channels through field-effect action. Piezoresistor values drift independently, unbalancing bridge output at zero load.

Do Packaging Stresses Dominate Piezoresistive Drift?
Surface electrical phenomena compete directly with mechanical creep to determine long-term stability. Below 60 degrees Celsius, viscoelastic relaxation in the mounting joints governs ninety percent of zero-point displacement. Above 85 degrees Celsius, ionic conductivity through silicon dioxide and silicon nitride accelerates exponentially according to the Arrhenius relation.
Activation energies for alkali migration in thermal oxides range between 0.8 and 1.1 electron-volts. A 20-degree rise in operating temperature triples mobile ion velocity toward the resistor boundary, and the resulting shift in sheet resistance upsets the ratio matching between opposite arms of the Wheatstone circuit.
Dry heat accelerates ionic migration across dielectrics according to Arrhenius kinetics with an activation energy near one electron-volt.
P-n junction isolation creates another degradation path. Monolithic piezoresistive sensors isolate diffused resistors from the bulk silicon substrate by holding diode junctions under reverse bias. Reverse leakage current doubles approximately every 10 degrees Celsius.
At room temperature, junction leakage rarely exceeds 10 picoamperes, an insignificant fraction of bridge excitation current. Extended operation at 125 degrees Celsius pushes that leakage into the microampere band. Non-uniform leakage currents bypass the piezoresistive paths, appearing as apparent pressure drift that follows temperature swings with heavy hysteresis.
| Mechanism | Dominant Manifestation | Thermal Sensitivity | Typical Magnitudes |
|---|---|---|---|
| Die Attach Creep | Zero baseline shift | Moderate (viscoelastic) | 0.08 to 0.35 percent FS |
| Surface Ion Trapping | Zero balance asymmetry | High (Arrhenius activation) | 0.04 to 0.20 percent FS |
| Contact Resistance Aging | Span and zero shifts | Low to moderate | 0.02 to 0.10 percent FS |
| Diaphragm Silicon Fatigue | Span calibration loss | Negligible below 300 C | Below 0.01 percent FS |
| Oil Cavity Outgassing | Zero elevation and non-linearity | High (vapor pressure driven) | 0.15 to 0.60 percent FS |
Ohmic contacts between aluminum metallization traces and boron-doped piezoresistors degrade through interdiffusion. Silicon atoms dissolve into thin-film aluminum interconnections during thermal cycles, leaving microscopic voids at contact vias. Aluminum migrates downward into those openings, forming spikes that disturb contact resistance.
A 0.05-ohm increase in one contact resistance arm creates an output shift of 25 microvolts under 5-volt excitation. On a standard 50-millivolt span device, that change moves the factory zero baseline by 0.05 percent of full scale.
Whether atomic layer deposition of aluminum oxide can fully neutralize ionic migration at 150 degrees Celsius without causing unacceptable thin-film lattice mismatch remains an open question across foundry operations.


Bench
Traceable mechanical and electrical characterization provides the only real check against environmental drift. High-volume production lines typically log zero and full-scale values at ambient conditions and delegate thermal compensation to generic polynomial profiles in ASIC registers. Field validation on an accredited metrology platform routinely reveals wide deviations from those curves.
Proper characterization requires primary deadweight testers or digital piston gauges with effective area uncertainties below 0.005 percent of reading. Verification environments stabilize temperature to within 0.2 degrees Celsius and relative humidity below 50 percent to isolate genuine pressure response from parasitic packaging reactions.

Does Fill Fluid Expansion Distort Zero Stability?
Volumetric swelling within isolated fluid systems alters initial offset and high-temperature performance coefficients alike. When oil-isolated sensors encounter step-change temperature ramps in a calibration bath, the fluid heats faster than the surrounding metallic housing. The resulting transient pressure spike reaches two to five percent of sensor range before equalizing.
Characterization procedures must allow sufficient thermal dwell time at every target plateau; rushing pressure cycles during verification records apparent hysteresis that belongs entirely to incomplete thermal equilibrium within the fluid envelope.
Accredited calibrations follow a defined sequence to separate mechanical hysteresis from span drift.
- Pre-conditioning cycles exercise the sensing diaphragm to 110 percent of rated full scale three times to relieve temporary packaging strain.
- Thermal soaking holds the device under test at lowest calibrated operating temperature for ninety minutes without electrical excitation.
- Zero-pressure baseline recording establishes initial offset under stable reference atmospheric conditions.
- Ascending pressure steps apply test points at zero, twenty, forty, sixty, eighty, and one hundred percent of full scale.
- Descending pressure steps measure the same increments to capture true mechanical and electrical hysteresis.
- Thermal advancement raises chamber temperature to intermediate and maximum operational plateaus, repeating full pressure sequences.
ASIC calibration registers store correction coefficients, pairing third-order polynomials for non-linear pressure curves with second-order temperature compensation terms. Mathematical expansion maps raw bridge output and temperature sensor data across direct and cross-coupled errors:
P_corrected = A0 + A1 V + A2 V^2 + A3 V^3 + T (B0 + B1 V + B2 V^2) + T^2 (C0 + C1 V)
Here, V represents raw bridge voltage, T represents measured die temperature, A defines pressure curve shape, B provides temperature coefficients of offset and span, and C handles thermal curvature. Field drift distorts these coefficients unevenly. Viscoelastic relaxation alters A0 and B0, shifting zero output and its first-order temperature slope.
Passivation degradation modifies A1 and B1, warping span tracking across temperature boundaries.
Section 7.6 of ISO/IEC 17025 dictates that calibration reports include measurement uncertainty alongside coverage factors to establish definitive unbroken traceability chains.
Calibration laboratories calculate uncertainty budgets per JCGM 100 guidelines. Type A evaluations treat repeated pressure cycles statistically, while Type B evaluations incorporate piston gauge certification limits, ambient barometric shifts, digital multimeter voltage uncertainties, and chamber temperature gradients.
| Uncertainty Component | Source Value | Distribution | Divisor | Standard Uncertainty (mbar) |
|---|---|---|---|---|
| Piston Gauge Reference | 0.008 percent reading | Normal (k=2) | 2.000 | 0.400 |
| Local Gravity Variation | 0.002 mbar | Rectangular | 1.732 | 0.001 |
| Chamber Temperature Drift | 0.150 degrees C | Rectangular | 1.732 | 0.260 |
| ASIC Quantization Noise | 0.003 percent FS | Rectangular | 1.732 | 0.173 |
| Zero Repeatability (Type A) | 0.310 mbar | Normal (k=1) | 1.000 | 0.310 |
| Barometric Variation | 0.120 mbar | Rectangular | 1.732 | 0.069 |
| Combined standard uncertainty equals 0.597 mbar; expanded uncertainty (k=2, 95 percent confidence) equals 1.194 mbar (0.0119 percent of full scale). | ||||
Under ISO 10012, calibration providers must invalidate compliance declarations whenever expanded measurement uncertainty exceeds one-fourth of the sensor tolerance limit.

Interval
Setting re-calibration schedules based on calendar intervals alone overlooks how operating conditions govern drift. A piezoresistive transmitter in a clean hydraulic circuit at 25 degrees Celsius drifts predictably over five years. The same unit on an offshore gas compressor faces continuous vibration, sulfurous gas exposure, and ambient thermal cycling from sub-zero winters to direct solar irradiation.
Operating conditions dictate the drift trajectory, making periodic field verification necessary before readings cross commercial specification limits.
In-situ verification allows technicians to validate transmitter health without removing hardware from pressurized pipework, avoiding downtime and physical risk to fragile diaphragm faces. Three methods predominate in field routines:
- Atmospheric cross-checks isolate the sensor manifold, open the test port to air, and log zero-point departure against a calibrated digital barometer.
- Secondary transfer standards connect high-accuracy portable calibrators directly to three-valve manifold test points for three-point field checks.
- Loop signature analysis tracks excitation current draw and raw uncompensated bridge voltage to detect moisture ingress before complete component failure.
Zero adjustment represents the simplest field correction, addressing the eighty percent of total field wander that stems from zero drift in piezoresistive designs. An autozero trim resets parameter A0 inside the digital signal conditioner, restoring output alignment at atmospheric pressure. Autozero does nothing to correct sensitivity wander.
When a transmitter undergoes span drift from diaphragm deformation or internal fluid loss, adjusting zero balances creates false operational confidence: the device reads correctly at zero bar, but departs from true pressure proportionally as applied force approaches full scale.
A zero trim restores baseline accuracy without correcting sensitivity degradation.
Longitudinal stability studies indicate that piezoresistive silicon transducers display logarithmic drift kinetics over prolonged operation. Half of the three-year total offset shift occurs within the initial 500 operating hours as initial die-attach curing stresses relax. After this break-in period, baseline drift rate flattens into a predictable linear trend.
High-reliability programs take advantage of this behavior through pre-installation thermal burn-in: powering sensors at 85 degrees Celsius under cyclic pressure for 168 hours expends the steep portion of the logarithmic relaxation curve before final factory calibration.
When zero baseline shifts exceed twice the manufacturer annual stability claim, complete extraction and multi-point laboratory recalibration become unavoidable.

Expense
Precision carries steep manufacturing, calibration, and ownership costs. Specifying a 0.05 percent full-scale total error band when process operations require only 0.25 percent wastes capital. Achieving tight tolerances demands extensive factory characterization, multi-point temperature testing, and premium grade packaging components.
Purchase price represents only the initial outlay; a narrow tolerance specification drives frequent accredited recalibrations, custom field test gear, and higher replacement frequencies as aging parts drift out of band.
Consider a fleet of 200 pressure transmitters monitoring an industrial distribution pipeline. Standard commercial-grade transmitters carrying a 0.25 percent annual drift specification carry a baseline purchase price of 450 dollars per unit. Premium units with 0.05 percent annual drift cost 1,200 dollars each due to matched glass-frit pedestals and extended burn-in cycles.
Standard units require bi-annual field validation taking two technicians one hour per device at a combined loaded rate of 120 dollars per hour. Premium units hold tolerance longer, requiring only annual checks. Laboratory recalibration costs 180 dollars per unit when field verification fails.
Historical drift distributions reveal that fifteen percent of standard transmitters fail a 0.25 percent tolerance threshold annually, requiring laboratory bench pulls. Premium transmitters run with a lower five percent bench-pull rate against their tighter 0.05 percent threshold. Over five operating years, total maintenance outlays shift dramatically:
| Cost Component | Standard Grade (0.25% FS) | Premium Grade (0.05% FS) |
|---|---|---|
| Initial Capital Acquisition | $90,000 | $240,000 |
| Field Verification Labor | $120,000 (10 rounds) | $60,000 (5 rounds) |
| Laboratory Recalibration Fees | $27,000 (150 pulls) | $9,000 (50 pulls) |
| Unscheduled Maintenance Downtime | $35,000 | $12,000 |
| Replacement Sensor Hardware | $13,500 (30 units) | $12,000 (10 units) |
| Total Five-Year Expenditure | $285,500 | $333,000 |
The standard grade option delivers a lower total expenditure over five years despite higher servicing frequency. Where a monitored process involves tight fiscal transfer metering ~ where every 0.1 percent error represents tens of thousands of dollars in unmetered hydrocarbon products ~ the fiscal dynamic flips immediately. Sourcing decisions balance sensor drift physics against measurement consequence.
Tightening accuracy tolerances beyond the physical capability of adhesive mounts produces continuous out-of-tolerance audit flags, premature instrument scrap, and disputed custody transfers.