Basic Principles of Sensor Drift Modeling under Environmental Stress
Sensor drift modeling couples Arrhenius and Peck kinetics with packaging mechanics to predict real measurement decay and optimize recalibration intervals.

Decay
A calibration certificate records performance at a single moment in time under tightly controlled ambient settings, typically 23 degrees Celsius and 50 percent relative humidity. In operational service, industrial sensors face persistent thermal swings, moisture ingress, cyclic pressure loads, and vibrational wear. These operating environments alter structural materials, degrade bond lines, and reorganize chemical balances within the sensing element.
Sensor drift represents the irreversible deviation of output values from nominal calibration curves over extended run times. Modeling this decay requires separating reversible environmental coefficients from permanent underlying baseline shifts.
Temperature fluctuations alter piezoresistive balances, change capacitance baselines, and induce thermomechanical loads across silicon diaphragms. When temperature normalizes, a portion of the original measurement offset often remains unrecovered. Mechanical hysteresis and lattice relaxation within packaging polymers prevent the assembly from returning cleanly to its initial zero state.
Engineering teams frequently confuse reversible temperature coefficients with true aging kinetics. The reversible component responds immediately to ambient shifts, whereas structural aging accumulates over thousands of operating hours.
A certificate records the zero state at 23 degrees Celsius, but operational environments demand accountability across thousands of thermal cycles.
Empirical evidence indicates that environmental stress compounds exponentially rather than through isolated additive terms. Moisture entering an adhesive layer lowers the glass transition temperature, making packaging assemblies vulnerable to micro-crack propagation during standard thermal cycles. Chemical contamination acts directly on surface oxides in metal-oxide or electrochemical gas transducers, permanently passivating reactive sites.
Drift modeling establishes mathematical approximations of these degradations to forecast recalibration intervals, manage guardbands, and preserve target measurement uncertainty across multi-year field deployments.
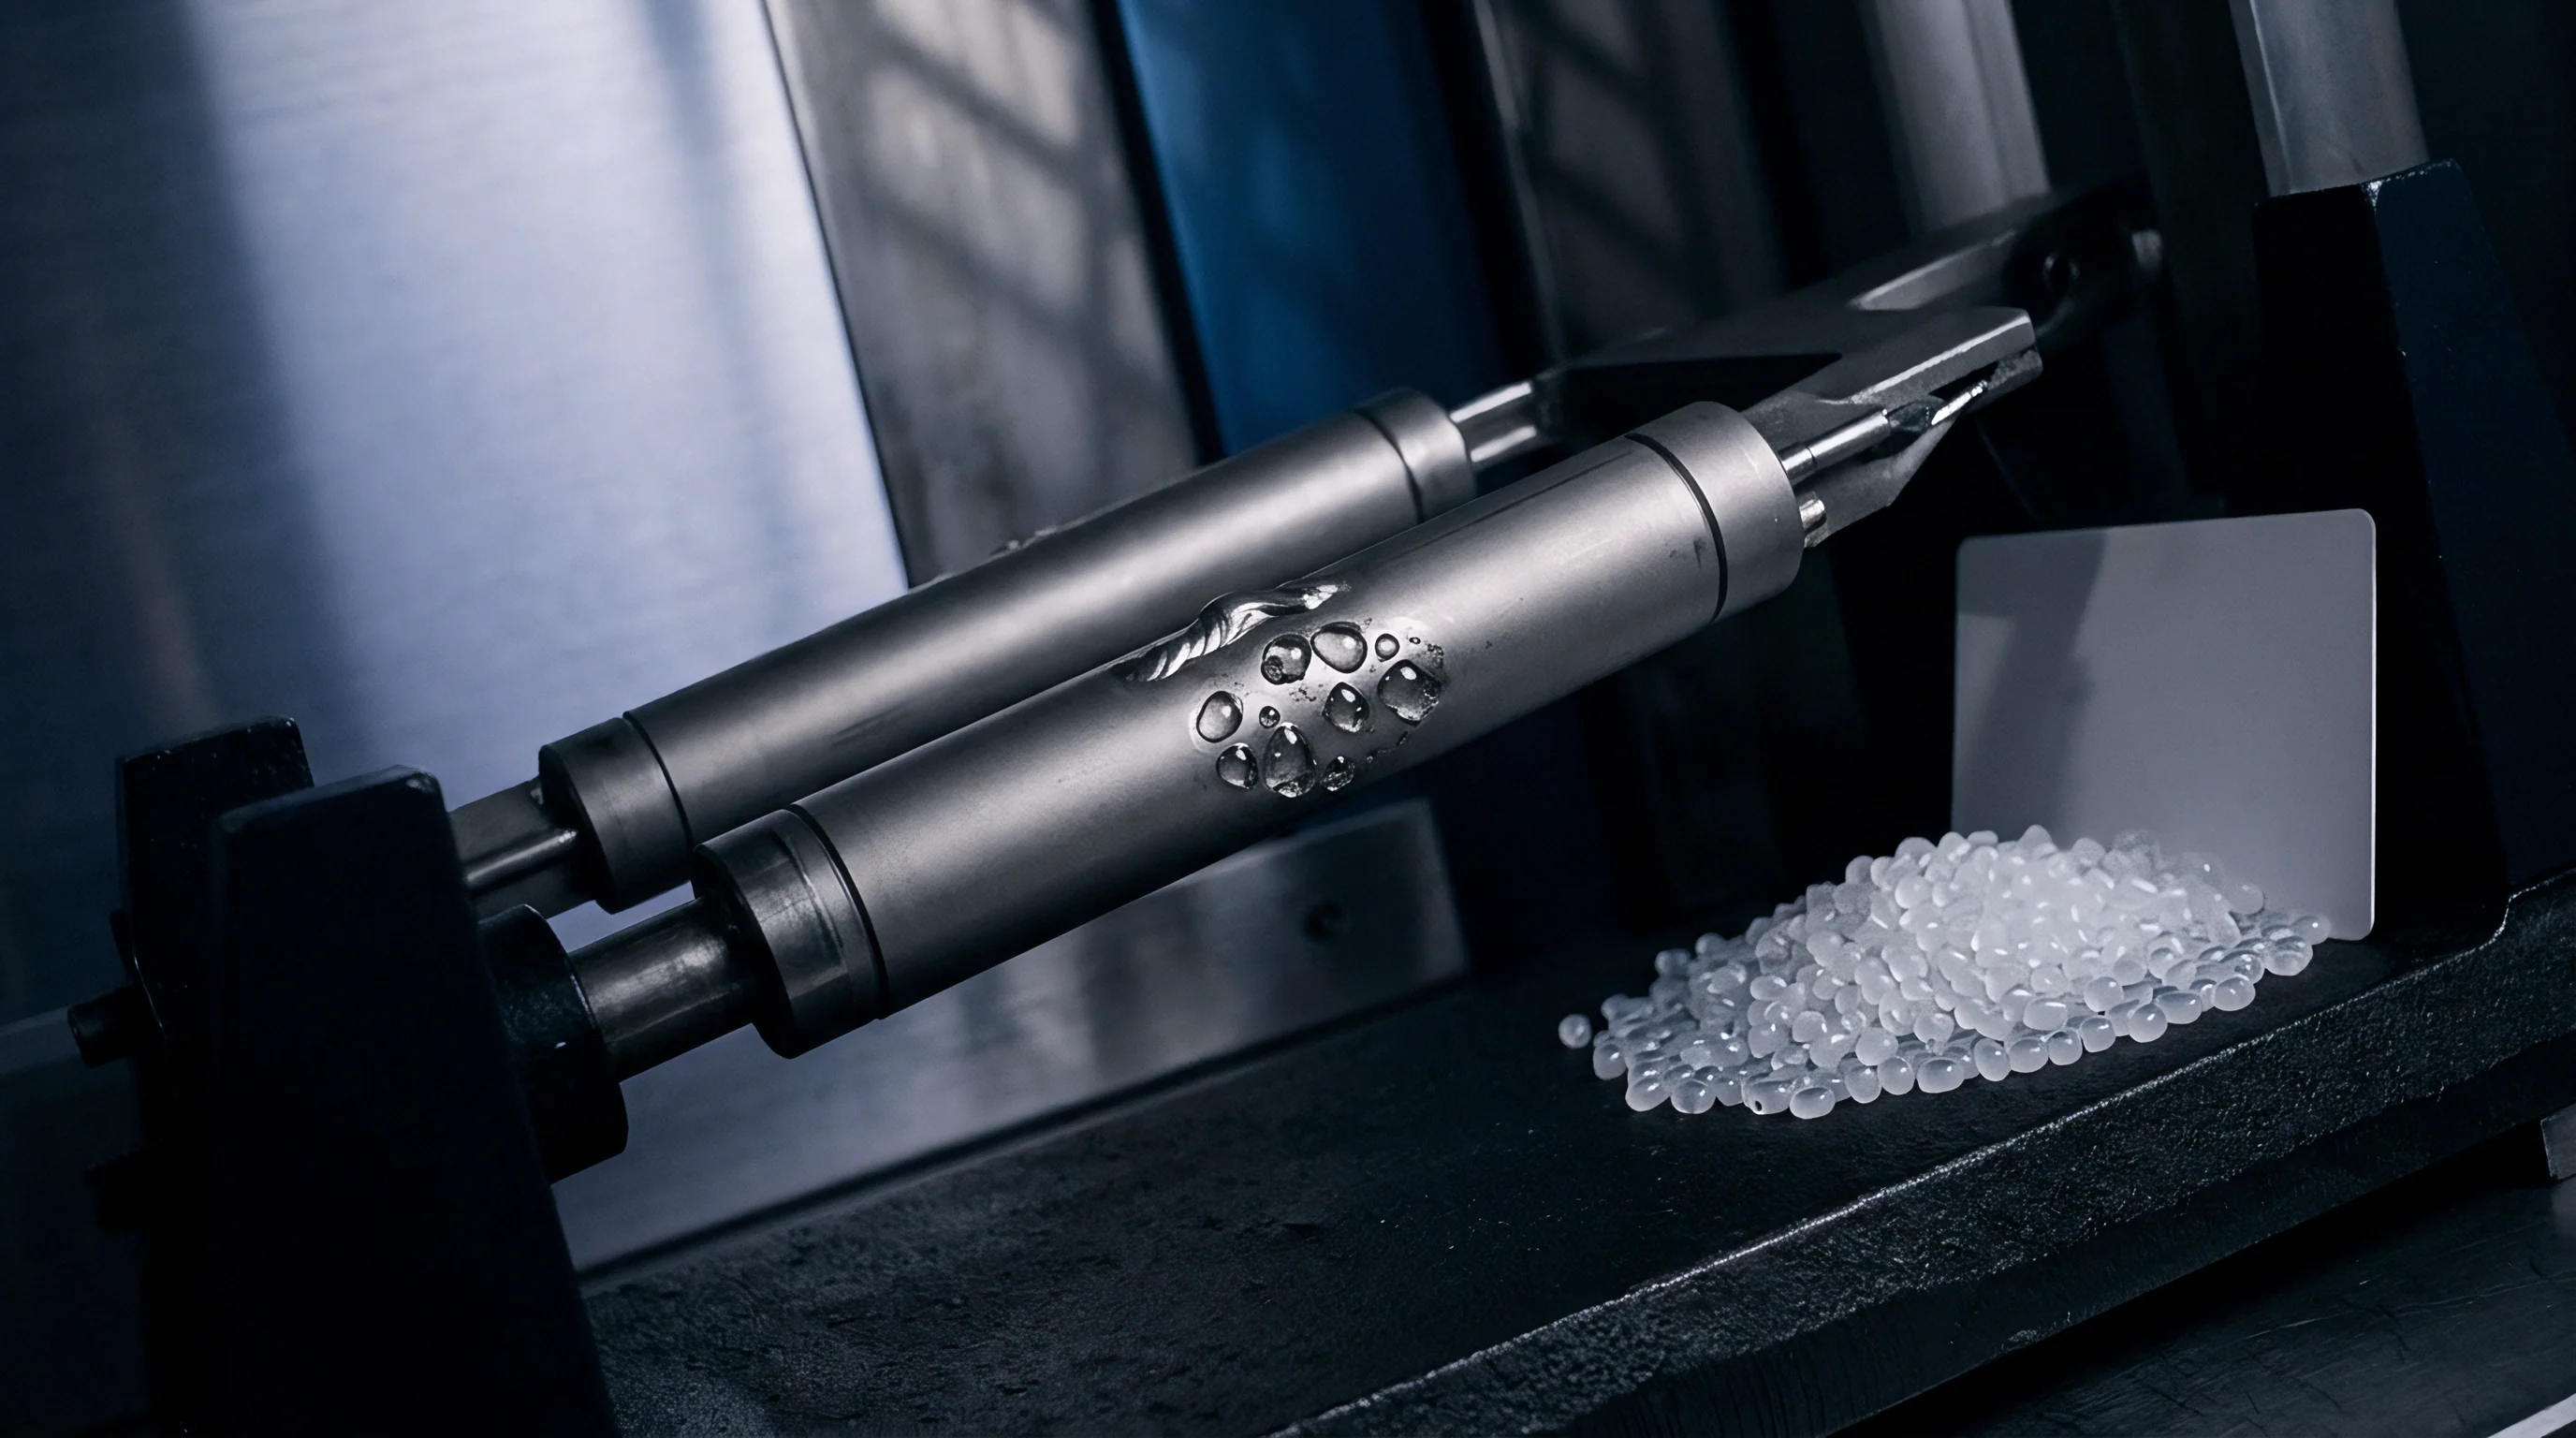
Suppliers routinely describe drift rates as simple linear time dependencies, quoting annual stability figures like 0.1 percent of full-scale output per year. In practice, degradation kinetics follow logarithmic, power-law, or exponential progressions dictated by physical reaction rates. Early operating phases exhibit accelerated settle-out behavior, driven by initial stress relaxation in packaging compounds, curing epoxies, and grain boundary shifts in thin films.
An accurate mathematical model accounts for these early kinetic stages to avoid underestimating degradation across the component lifespan.
A supplier warranty that quotes annual drift without defining thermal baseline boundaries shifts the burden of field validation entirely onto the purchaser.

Kinetics
Mathematical descriptions of sensor degradation rely on classical reaction kinetics and physical failure modeling. Thermal acceleration drives molecular rearrangements, dopant migration, and interfacial oxidation across sensing layers. When temperature acts as the dominant environmental stressor, the Arrhenius relationship serves as the foundational mathematical tool to determine rate constants:
k = A exp(-Ea / (k_B T))
Within this relationship, k defines the degradation rate constant, A represents an empirical frequency factor, Ea characterizes the activation energy of the specific failure mechanism in electron-volts, k_B is Boltzmann’s constant, and T denotes the absolute temperature in Kelvin. Determining the dominant activation energy requires testing identical populations under varied accelerated thermal stresses. Different failure modes run concurrently within a single package, each defined by an independent activation energy.
High moisture levels accelerate dielectric degradation, stimulate package swelling, and initiate galvanic corrosion pathways. To model the combined impacts of temperature and relative humidity, engineers deploy the Eyring reaction model or the empirical Peck equation:
AF = (RH_stress / RH_use)^(-n) exp((Ea / k_B) ((1 / T_use) – (1 / T_stress)))
Here, AF represents the acceleration factor, RH defines relative humidity percentages, and n is an empirically derived humidity exponent typically falling between 2.0 and 3.0 for electronic assemblies. The Peck formulation relates laboratory-accelerated test hours directly to expected service years under moderate field conditions.
Operating a piezoresistive transducer above 85 degrees Celsius doubles interfacial creep velocity for every ten-degree rise.
Cyclic mechanical stress, vibrational resonance, and rapid thermal cycling drive mechanical fatigue within wire bonds, leadframes, and solder joints. The Coffin-Manson relation models thermomechanical strain cycles leading to cracked solder joints or delaminated diaphragms:
N_f = C (Delta_epsilon_p)^(-m)
In this equation, N_f denotes the number of cycles to failure, Delta_epsilon_p corresponds to the plastic strain range per cycle, while C and m represent empirical material ductility constants. Incorporating cyclic fatigue into an aggregate drift model prevents catastrophic mechanical disconnection from presenting as unexplained, sudden zero-point wander.
| Stress Vector | Dominant Kinetic Model | Primary Physical Failure Mode | Typical Activation Energy |
|---|---|---|---|
| Steady State Thermal | Arrhenius Rate Law | Dopant diffusion, oxide growth, polymer degradation | 0.6 eV to 1.1 eV |
| Temperature and Humidity | Peck Power-Law Formulation | Hydrolysis, corrosion, hygroscopic swelling | 0.7 eV to 0.9 eV |
| Thermal Shock Cycling | Coffin-Manson Relationship | Solder joint shearing, metallization fatigue, delamination | Empirical strain index |
| Continuous Mechanical Load | Arrhenius-Activated Power Law Creep | Silicon diaphragm relaxation, adhesive creep | 0.4 eV to 0.8 eV |
A comprehensive drift model unifies these isolated physical equations into an aggregate equation describing sensor signal error over operational time:
Delta_Y(t) = D_0 + S_t t^alpha + A_T (T – T_0) + D_cyc N_cyc
The term Delta_Y(t) represents total baseline offset error. D_0 reflects factory calibration uncertainty, S_t t^alpha models steady-state aging kinetics with time exponent alpha, A_T represents uncompensated reversible temperature offset, and D_cyc N_cyc calculates cumulative irreversible shifts generated by completed thermal or mechanical cycles. Calibration intervals remain uncontrolled when field models ignore the non-linear time exponent alpha.
Standard qualification procedures run out of utility when competing degradation modes switch dominance midway through an accelerated thermal profile.
Assembly
Every sensor assembly integrates multiple structural materials with disparate thermal expansion properties. Silicon exhibits a low coefficient of thermal expansion, approximately 2.6 parts per million per Kelvin. Conventional FR4 substrate materials expand at 14 to 17 parts per million per Kelvin, while structural brass or stainless steel housings exhibit rates between 16 and 19 parts per million per Kelvin.
Bonding these mismatched components with polymer adhesives creates persistent mechanical shear stresses across interfacial joints throughout every thermal cycle.
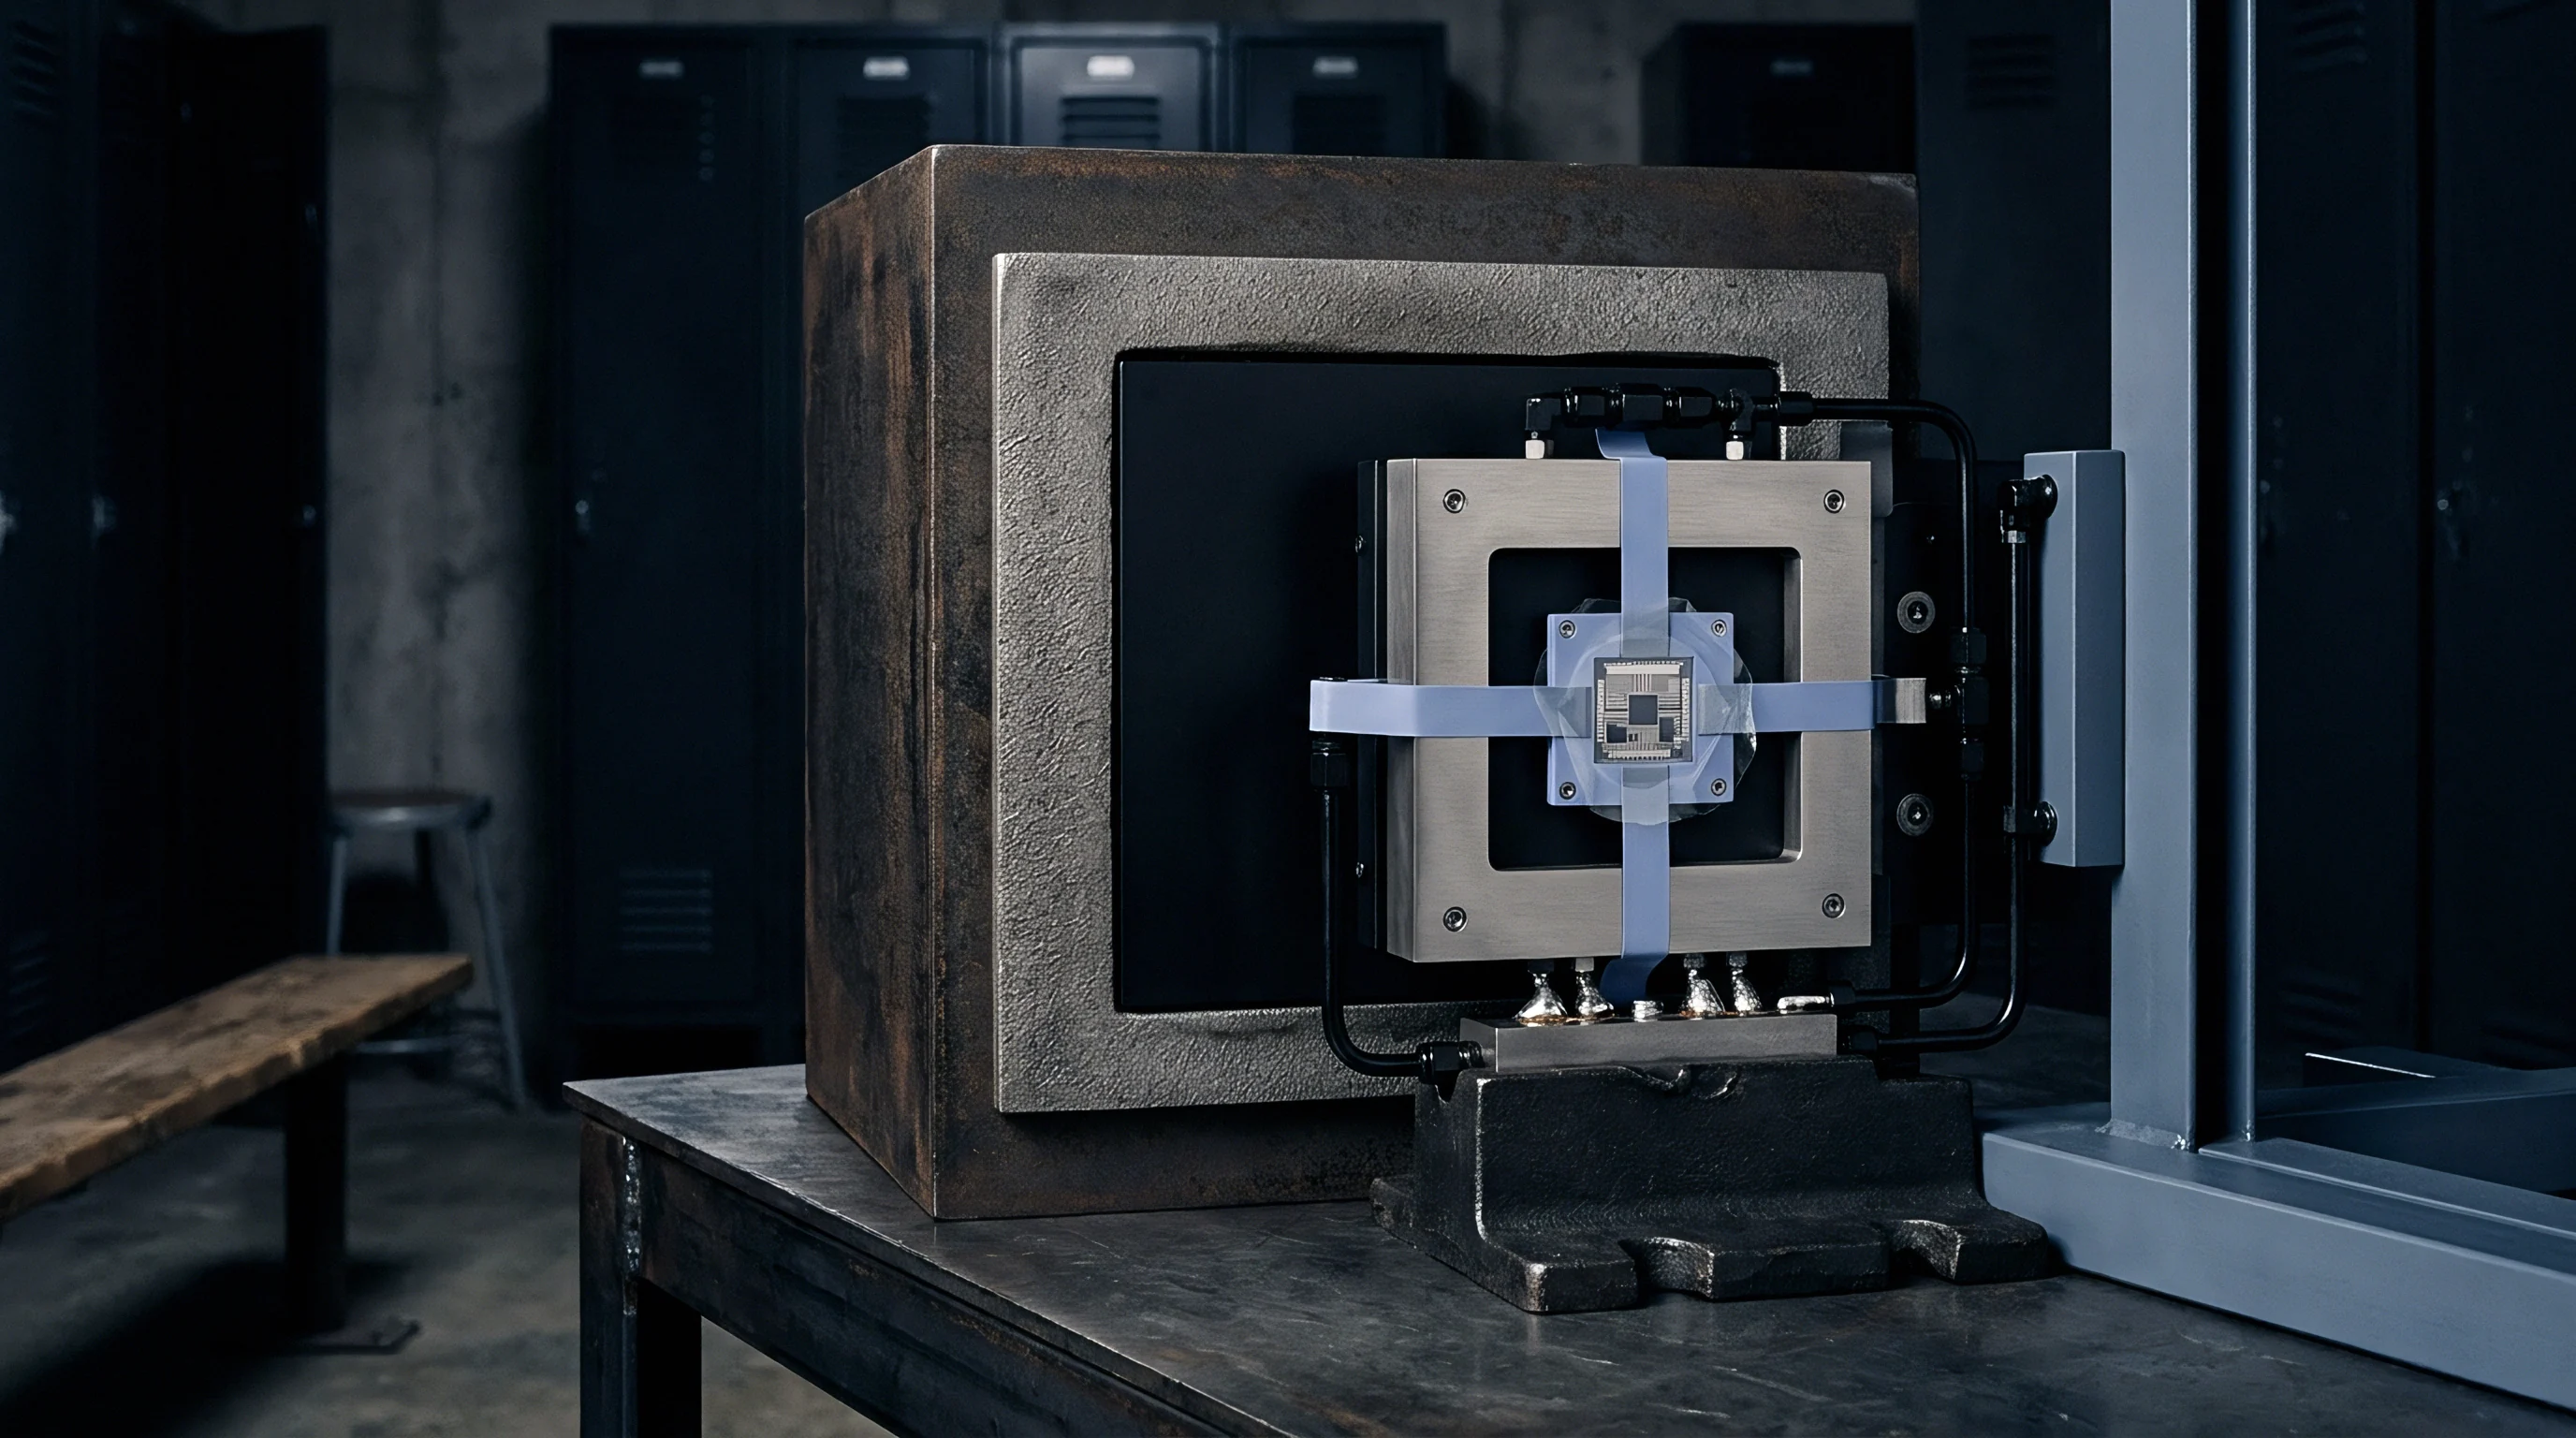
Polymer adhesives absorb atmospheric moisture, inducing hygroscopic expansion alongside thermal growth. Water absorption alters the elastic modulus of curing epoxies, allowing slight micro-movements of the die mount. In silicon piezoresistive pressure sensors, these minor physical die movements generate spurious strains across the sensing bridge.
The resulting error manifests on measurement circuits as irreversible zero-point drift. Modifying electrical offset correction algorithms cannot counteract these physically induced mechanical strains.
Hermetic seals mitigate atmospheric degradation but introduce unique manufacturing challenges. Glass-to-metal seals and laser-welded seams require precise execution to avoid sub-microscopic void channels. Helium leak tests compliant with MIL-STD-8888 or IEC 60068-2-17 establish leak rates below 10^-8 atmospheric cubic centimeters per second.
When seals permit moisture penetration into inner cavities, internal condensation occurs as temperatures fall below the local dew point. Liquid water droplets across sensing bridges generate parasitic surface leakage currents, causing intermittent measurement spikes and permanent calibration loss.
Potted sensor assemblies introduce direct physical pressures on active components. Curing shrinkage in polyurethane, epoxy, or silicone encapsulants exerts continuous isotropic and anisotropic stresses against wire bonds and flexible membranes. While silicone gels reduce direct stress via lower shore hardness ratings, they remain permeable to moisture vapor over long operating horizons.
Chemical vapors, industrial oils, and cleaning solvents penetrate silicone barriers, interacting with delicate bond wires and thin-film metallization layers beneath.
Selecting stable materials requires reviewing raw supplier material specifications alongside assembly processes. High-end industrial transducers utilize silicon-on-insulator elements, ceramic substrates, and hard-soldered or co-fired interfaces rather than soft polymer bonds. These ceramic architectures maintain low expansion differentials and resist chemical penetration.
Premium material packages dramatically reduce raw drift rates, but drive up bill-of-materials and procurement expenses.
The supplier claimed the epoxy bond line would outlast field requirements, but thermal cycling tests revealed progressive delamination across the interface.
Protocol
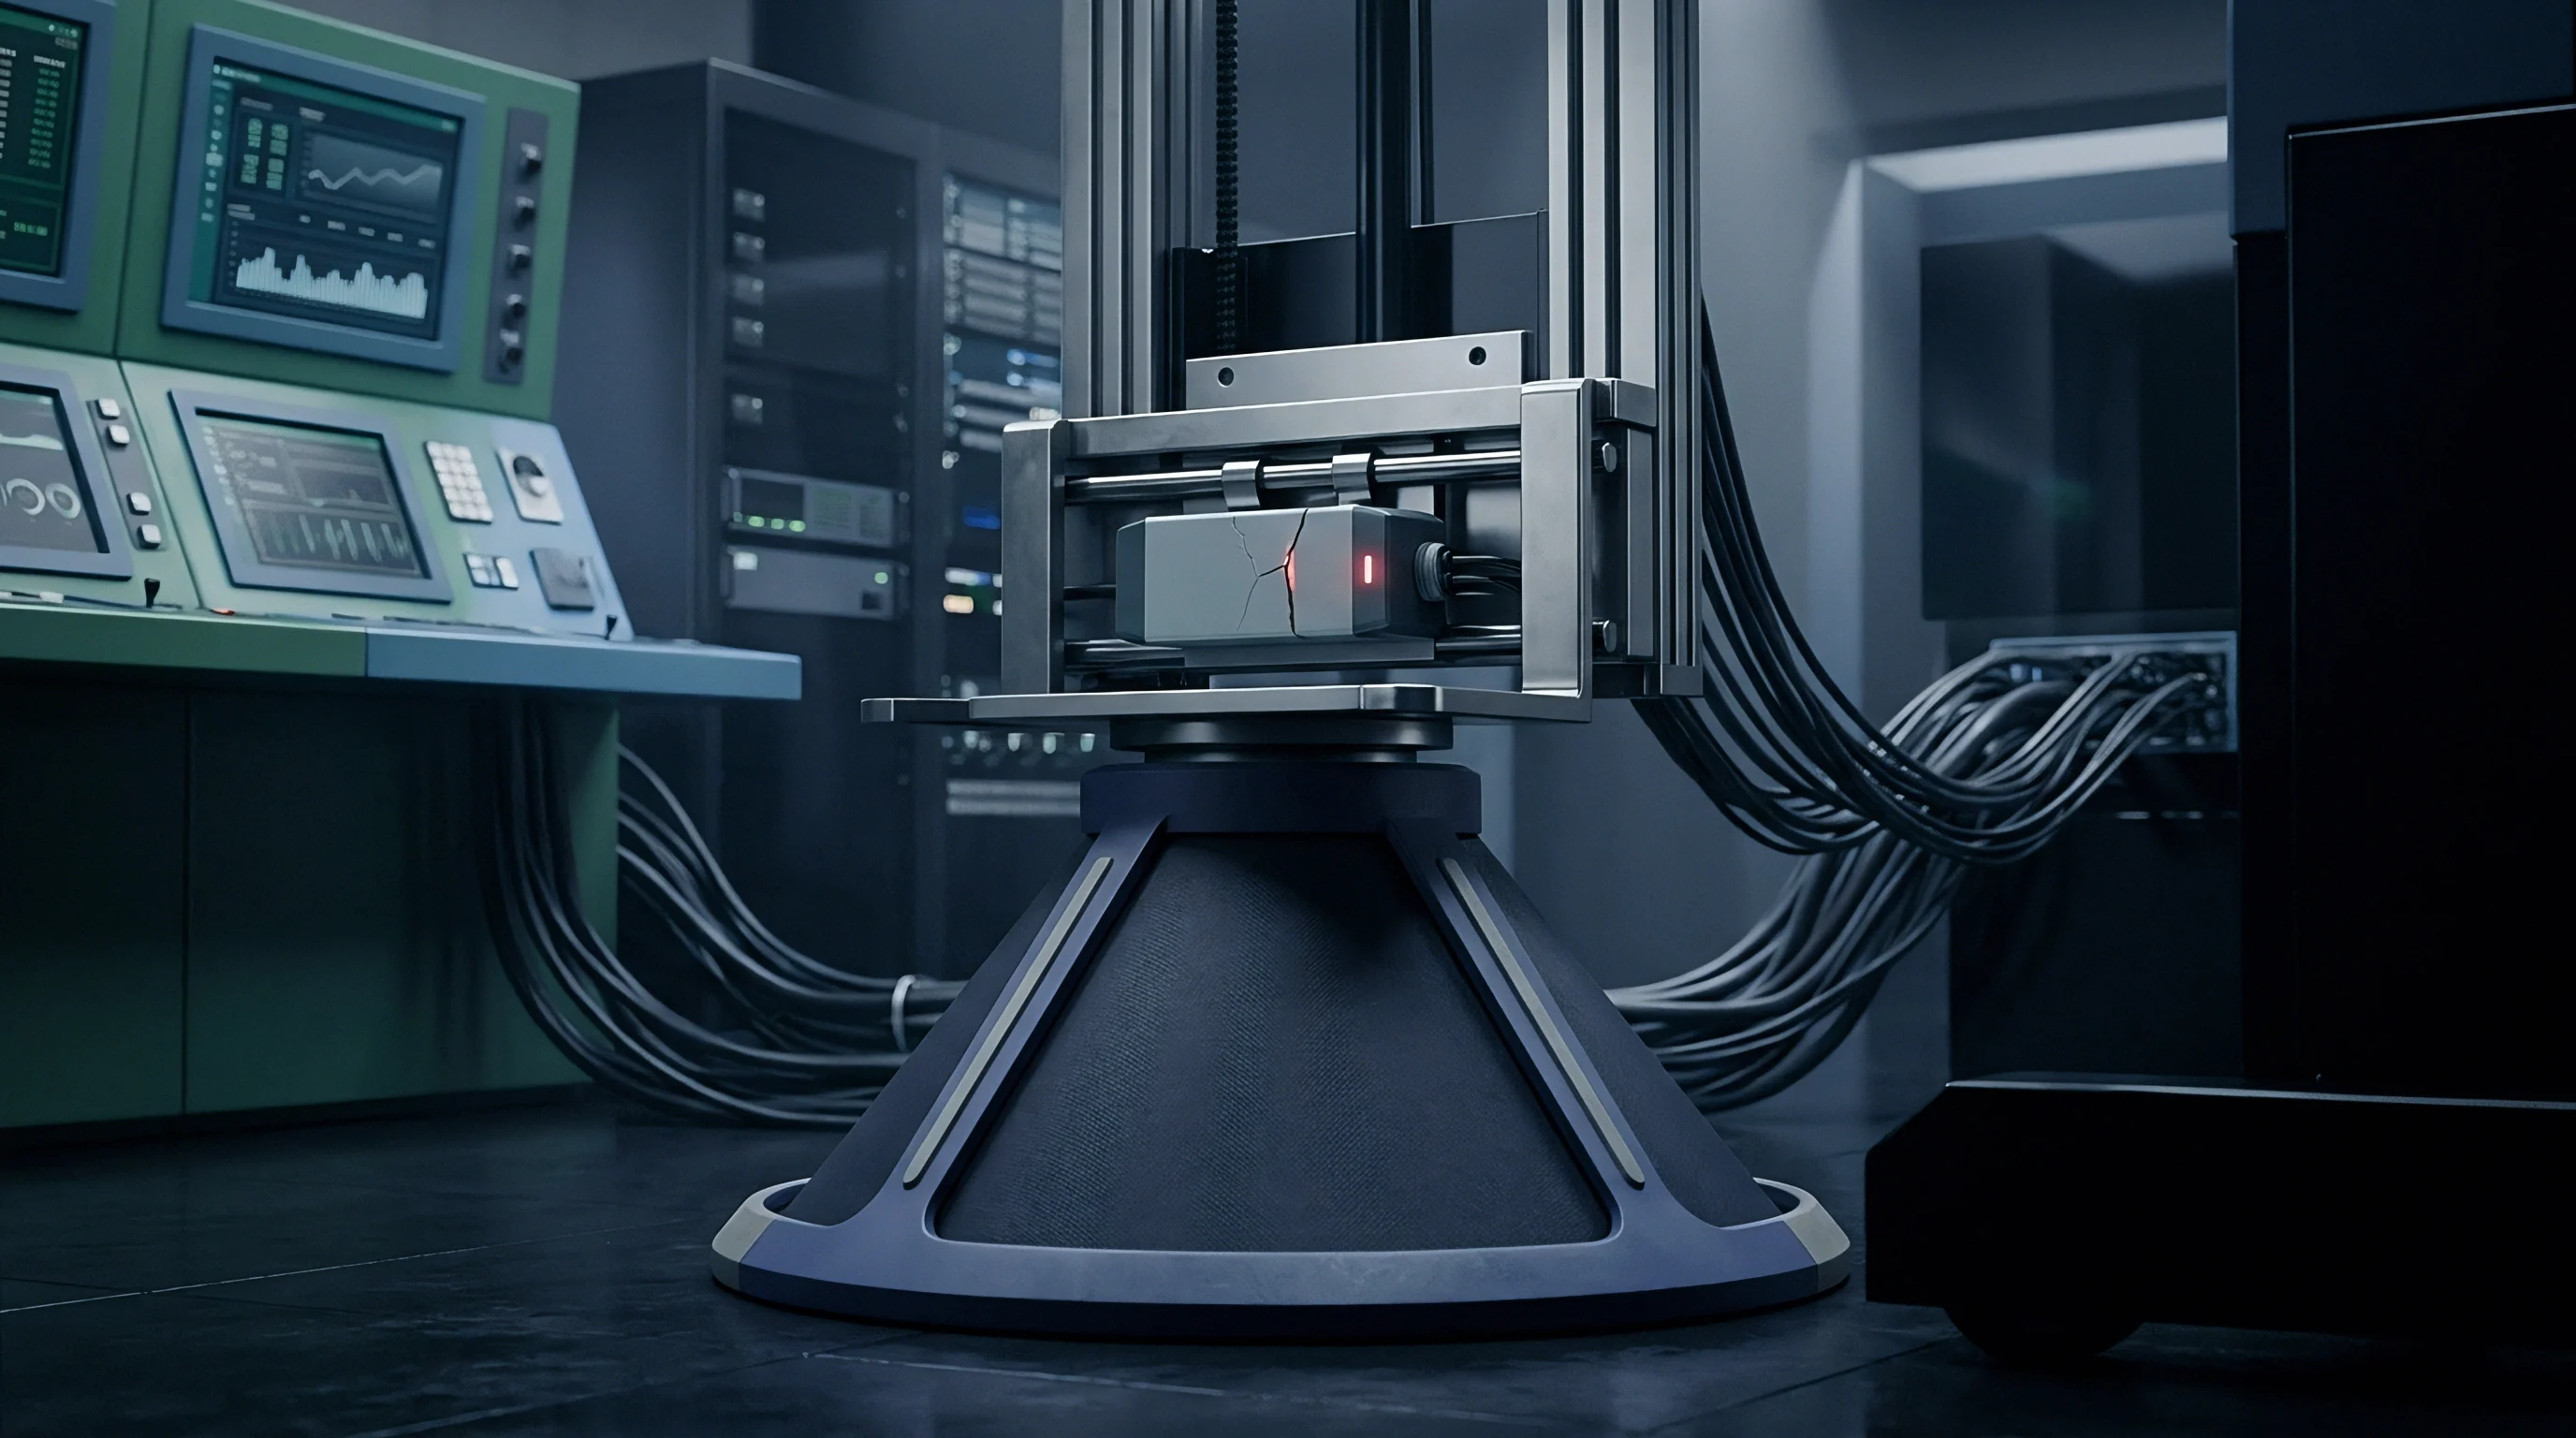
Building an accurate mathematical drift model requires structured empirical data generated via rigorous environmental screening. Accelerated testing exposes sensors to thermal, moisture, and dynamic stresses that exceed standard field operating points without triggering unrepresentative secondary failure modes. Standardized profiles like IEC 60068-2-2 dry heat tests, IEC 60068-2-78 damp heat steady-state exposures, and IEC 60068-2-14 thermal cycling tests define baseline conditions for aging characterization.
Design teams execute stepped environmental profiles to map multi-stress dependencies across production populations. Sensors are placed inside precision climatic chambers while running continuous digital data acquisition across test groups:
- Initial Baseline Verification establishes reference zero-point and span values under standard conditions of 23 degrees Celsius and 50 percent relative humidity following an unpowered twenty-four-hour stabilization soak.
- Accelerated Thermal Aging exposes hardware to elevated plateau temperatures such as 85, 105, and 125 degrees Celsius for durations spanning 1,000 to 5,000 operational hours while recording intermediate baseline drift.
- High Humidity Soaking subjects parts to 85 degrees Celsius and 85 percent relative humidity conditions inside damp-heat chambers to isolate moisture-driven drift and measure insulation resistance drops.
- Rapid Temperature Cycling moves assemblies through three hundred to one thousand cycles across limits of minus 40 degrees Celsius and plus 125 degrees Celsius with transit dwell times under thirty seconds.
- Vibrational Stress Sweeps subject test units to random triaxial vibrations compliant with IEC 60068-2-64 to identify packaging resonances, micro-crack initiation points, and structural loosening.
- Post Exposure Recalibration remeasures all devices at original reference conditions, extracting true non-recoverable mechanical drift from reversible environmental temperature coefficients.
Collecting raw chamber data requires disciplined metrological rigor. Reference instruments within the test loop must possess traceable calibration certificates establishing uncertainties at least four times tighter than the required sensor tolerance band. Calibration laboratories deploy secondary platinum resistance thermometers and primary quartz pressure transfer standards inside stress chambers to track local environmental conditions precisely.
Acceptance testing must specify a minimum four-to-one test uncertainty ratio between external references and device tolerances to avoid passing drifting lots.
Extracted raw datasets allow regression analysis to calculate specific activation energies, humidity exponents, and time decay coefficients. When test populations include less than thirty units per stress cell, statistical outliers distort calculated activation energies. Insufficient sample sizes obscure wide lot-to-lot manufacturing variations in epoxy thicknesses, solder joint volumes, and surface passivation coatings.
A testing facility that skips post-stress stabilization dwells measures transient hygroscopic stresses rather than permanent structural sensor drift.

Arithmetic
Applying drift kinetics to operational uncertainty budgets demands precise numerical calculation. Consider an industrial piezoresistive pressure transmitter deployed within a continuous chemical manufacturing process. The instrument monitors line pressures across a full-scale range of 0 to 1,000 kilopascals.
Sourcing agreements require holding a total operating measurement uncertainty within plus or minus 1.0 percent of full scale across a three-year continuous run.
Reviewing the sensor datasheet reveals an initial factory calibration accuracy of plus or minus 0.25 percent of full-scale output, referenced to ISO/IEC 17025 accredited bench standards at 23 degrees Celsius. The supplier states a temperature coefficient of offset of 0.02 percent of full scale per Kelvin, alongside a quoted long-term baseline drift of 0.1 percent of full scale per year under benign laboratory settings. The intended operating deployment subjects the transducer to continuous 65 degrees Celsius fluid lines, ambient atmospheric temperatures of 45 degrees Celsius, and 75 percent relative humidity.
Field deployment introduces real stresses that accelerate baseline decay beyond raw datasheet specifications. A metrology engineer constructs a drift analysis by deriving true physical degradation rates using the Arrhenius relationship:
The activation energy for the primary die-attach adhesive degradation mode is established as 0.75 electron-volts. Laboratory testing conditions operated at a base reference temperature T_ref of 296.15 Kelvin (23 degrees Celsius). The field operating temperature T_field stands at 338.15 Kelvin (65 degrees Celsius).
Boltzmann’s constant k_B equals 8.6173 10^-5 electron-volts per Kelvin. The thermal acceleration factor computes as follows:
AF = exp((Ea / k_B) ((1 / T_ref) – (1 / T_field)))
AF = exp((0.75 / (8.6173 10^-5)) ((1 / 296.15) – (1 / 338.15)))
AF = exp(8703.43 (0.0033767 – 0.0029573)) = exp(3.6499) = 38.47
Under continuous exposure to 65 degrees Celsius, degradation kinetics accelerate by a factor of 38.5 compared to ambient bench conditions. If physical drift followed simple linear kinetics, initial stability specifications would be invalid immediately. Structural drift follows power-law decay curves where the time exponent alpha equals 0.5, typical of parabolic diffusion mechanics.
The cumulative drift over three years of service (26,280 hours) is calculated using accelerated kinetics:
D_time = D_base (AF (t / 8760))^0.5
D_time = 0.10% (38.47 (3 / 1))^0.5 = 0.10% (115.41)^0.5 = 0.10% 10.74 = 1.074% of full scale
Thermal aging alone introduces 1.074 percent full-scale drift over the three-year run, exceeding the entire allowable uncertainty budget. The engineer must also account for reversible temperature offsets and initial factory calibration errors. Reversible temperature offset reflects the distance from the 23 degrees Celsius calibration point to the 45 degrees Celsius ambient housing temperature:
Delta_T_housing = 45 – 23 = 22 Kelvin
E_temp = 22 0.02% = 0.44% of full scale
| Error Source | Distribution Model | Standard Uncertainty Divisor | Value (% FS) | Standard Uncertainty (% FS) |
|---|---|---|---|---|
| Factory Calibration Uncertainty | Normal (k=2) | 2.000 | 0.250 | 0.125 |
| Accelerated Thermal Drift (3 Years) | Rectangular | 1.732 (sqrt 3) | 1.074 | 0.620 |
| Uncompensated Temperature Offset | Rectangular | 1.732 (sqrt 3) | 0.440 | 0.254 |
| Hygroscopic Interfacial Swelling | Rectangular | 1.732 (sqrt 3) | 0.150 | 0.087 |
| Power Supply Regulation Shift | Rectangular | 1.732 (sqrt 3) | 0.050 | 0.029 |
Combining these contributions via root-sum-square calculations yields the combined standard measurement uncertainty:
u_c = sqrt((0.125)^2 + (0.620)^2 + (0.254)^2 + (0.087)^2 + (0.029)^2)
u_c = sqrt(0.0156 + 0.3844 + 0.0645 + 0.0076 + 0.0008) = sqrt(0.4729) = 0.688% of full scale
Applying an expansion coverage factor of k = 2 provides an expanded measurement uncertainty at approximately 95 percent confidence:
U_expanded = 2 u_c = 2 0.688% = 1.376% of full scale
The expanded uncertainty of 1.376 percent clearly violates the system design ceiling of 1.0 percent. The device cannot run for three consecutive years without mid-life recalibration or mechanical hardware redesign. To preserve the 1.0 percent target tolerance, the maximum allowable operational run time computes as:
Allowable U_drift = sqrt((1.00 / 2)^2 – (0.125)^2) sqrt(3) – 0.44% = 0.398%
Solving the accelerated power law expression yields a maximum recalibration interval of 4.2 months. Deploying this sensor under intended process conditions without adjusting recalibration intervals will cause unmonitored measurement drift outside acceptable process limits.
Process operations that ignore accelerated kinetics discover measurement failures only when product batches fall outside quality standards.

Expenditure
Sourcing strategies that focus on initial component purchase prices routinely generate major downstream maintenance costs. A standard industrial sensor priced at 120 dollars per unit often appears highly competitive against a high-reliability device priced at 380 dollars. If the lower-cost sensor exhibits an unmodeled drift rate of 1.2 percent full scale annually under thermal stress, meeting process tolerances requires triple the recalibration frequency in the field.
Executing an on-site calibration cycle carries substantial operational expenses. Certified calibration technicians require specialized transportable deadweight testers, dry block calibrators, and accredited reference loggers. Mobilization costs, technician hourly billing, permit documentation, and physical labor run between 250 and 600 dollars per measurement loop.
When recalibration mandates taking an active production process offline, lost commercial output easily adds thousands of dollars per hour to maintenance overhead.
- Unplanned Field Recalibration Mobilization consumes operating budgets through emergency technician billing, hot-work safety permits, and dedicated travel logistics.
- Premature Batch Scrap occurs when drifting sensors pass false product values to closed-loop chemical, thermal, or dosing control automation systems.
- Accelerated Replacement Procurement forces operations teams to purchase short-lead components at high spot-market distributor prices when hardware suffers early delamination.
- Regulatory Non-Compliance Audits generate contractual penalties, product delivery holds, and customer chargebacks when instrument tracking records reveal drift beyond stated control limits.
Specifying sensors with integrated silicon-on-insulator designs, ceramic packaging, or welded hermetic seals increases upfront procurement expenditures. These robust architectures limit annual baseline drift to less than 0.05 percent of full scale under harsh operating conditions. Reducing drift rates extends operational service life between necessary calibration maintenance routines from four months to twenty-four or thirty-six months.
The total cost of measurement ownership over five operating years drops considerably when higher-grade sensors are selected at initial project design.
A component purchase saving of fifty dollars creates a thousand dollars in field calibration costs when thermal drift goes unaddressed.
Procurement teams protect operating margins by writing detailed environmental drift performance standards into formal purchase contracts. Requests for quotation must require verified aging test dossiers, defined activation energies, and empirical sample data rather than accepting bare single-line datasheet stability assertions. Purchase agreements should link milestone supplier payments directly to incoming inspection results from laboratory accelerated stress screening.
Procurement contracts that do not mandate verified drift figures at operating temperature extremes leave purchasers liable for downstream maintenance expenses.

Governance
Preventing out-of-tolerance drift events in mission-critical applications requires multi-layered procedural and operational controls. Quality organizations implement rigorous incoming acceptance sampling protocols compliant with ISO 2859-1 standards. Rather than relying on simple ambient bench checks, incoming inspection procedures subject a statistical sample from every component batch to abbreviated thermal and pressure stress cycles inside dedicated laboratory chambers.
Incoming test protocols flag units displaying rapid early-stage baseline drift before components enter field production lines. Early non-linear zero shifts typically identify inadequate factory curing, high internal packaging stresses, or marginal solder joints. Identifying defective production batches at the receiving dock prevents vulnerable hardware from entering final machine builds or operational process systems.
Modern industrial systems deploy active firmware compensation algorithms to correct predictable environmental drift. Microcontrollers continuously monitor auxiliary temperature and humidity sensors placed adjacent to the primary measurement bridge. When degradation pathways are fully characterized by verified mathematical models, digital filters subtract predictable reversible shifts and estimated time-dependent decay from live measurement streams.
Physical aging models must be bounded with statistical guardbands to prevent software corrections from overcompensating for actual sensor drift.
Operating plants maintain ISO 10012 measurement management compliance by enforcing dynamic recalibration intervals. Rather than relying on static calendar intervals, computerized maintenance systems adjust calibration schedules using real-world operational stress history recorded by field loggers. Transducers operating continuously at high temperatures receive shorter recalibration cycles, while devices in stable ambient conditions run longer without manual intervention.
This dynamic approach ensures measurement integrity while minimizing routine service labor expenses.
Standard contract language shifts all field recalibration costs to the sensor supplier whenever audited drift rates exceed agreed mathematical limits.