Annual Drift Extrapolated from a Four Week Test Bench
Linear annual drift extrapolation from four-week test bench data produces severe forecast errors by ignoring logarithmic relaxation and test fixture noise floors.
Projection
Multiplying a twenty-eight day sensor drift value by thirteen yields a fictitious annual stability rating. Sourcing teams frequently evaluate silicon piezoresistive pressure cells, thin-film platinum RTDs, and hall-effect current transducers on four-week qualification runs, seeking rapid approval for volume manufacturing. The measured output shift during those initial 672 hours reflects early thermo-mechanical settling, packaging stress relaxation, and contact curing.
Extending that transient slope linearly across 8,760 hours misrepresents physical degradation mechanisms that decay logarithmically or accelerate through late-stage chemical oxidation.
When a ceramic capacitive pressure transmitter shifts 0.04% of full-scale span across twenty-eight days at 25 degrees Celsius, assuming an annual migration of 0.52% full-scale span distorts product reliability calculations. Solid-state sensors governed by stress relaxation slow their rate of change over time, meaning the true twelve-month drift might reach only 0.09% full-scale span. Conversely, thick-film resistors undergoing intermetallic diffusion at elevated ambient temperatures display sudden inflection points after five months, generating failures that four-week observation windows fail to detect.
A twenty-eight day test window captures mechanical package seating rather than the long-term chemical degradation of the sensing element.
Extrapolation requires selecting a mathematical degradation model matching the device physics. Four primary functions describe solid-state sensor wander:
- Logarithmic relaxation governs wire bond settling and silicon diaphragm stress relief, where drift increments diminish with each decade of elapsed operational time.
- Parabolic diffusion controls surface oxidation and dopant migration within semiconductor junctions, generating total shifts proportional to the square root of service hours.
- Linear wear characterizes electrolytic depletion in amperometric gas sensors, producing a constant loss of active catalytic material across the operating life.
- Arrhenius reaction kinetics describes temperature-driven insulation breakdown, doubling aging velocities for every ten-degree Celsius rise in junction temperature.
Selecting the incorrect regression function changes capital allocations during instrument procurement. A program manager budgeting for annual field recalibration based on linear assumptions overestimates service overhead by a factor of four for logarithmically settling transducers. That same manager severely underestimates field failure returns when buying electrochemical cells that experience accelerating electrolyte drying.
Standard engineering datasheets rarely distinguish infant settlement rates from steady-state yearly wander.
Discrepancies between monthly test runs and yearly field degradation frequently stem from laboratory ambient controls failing to reproduce real operating conditions.
Mount

Mechanical Strain in Test Fixtures
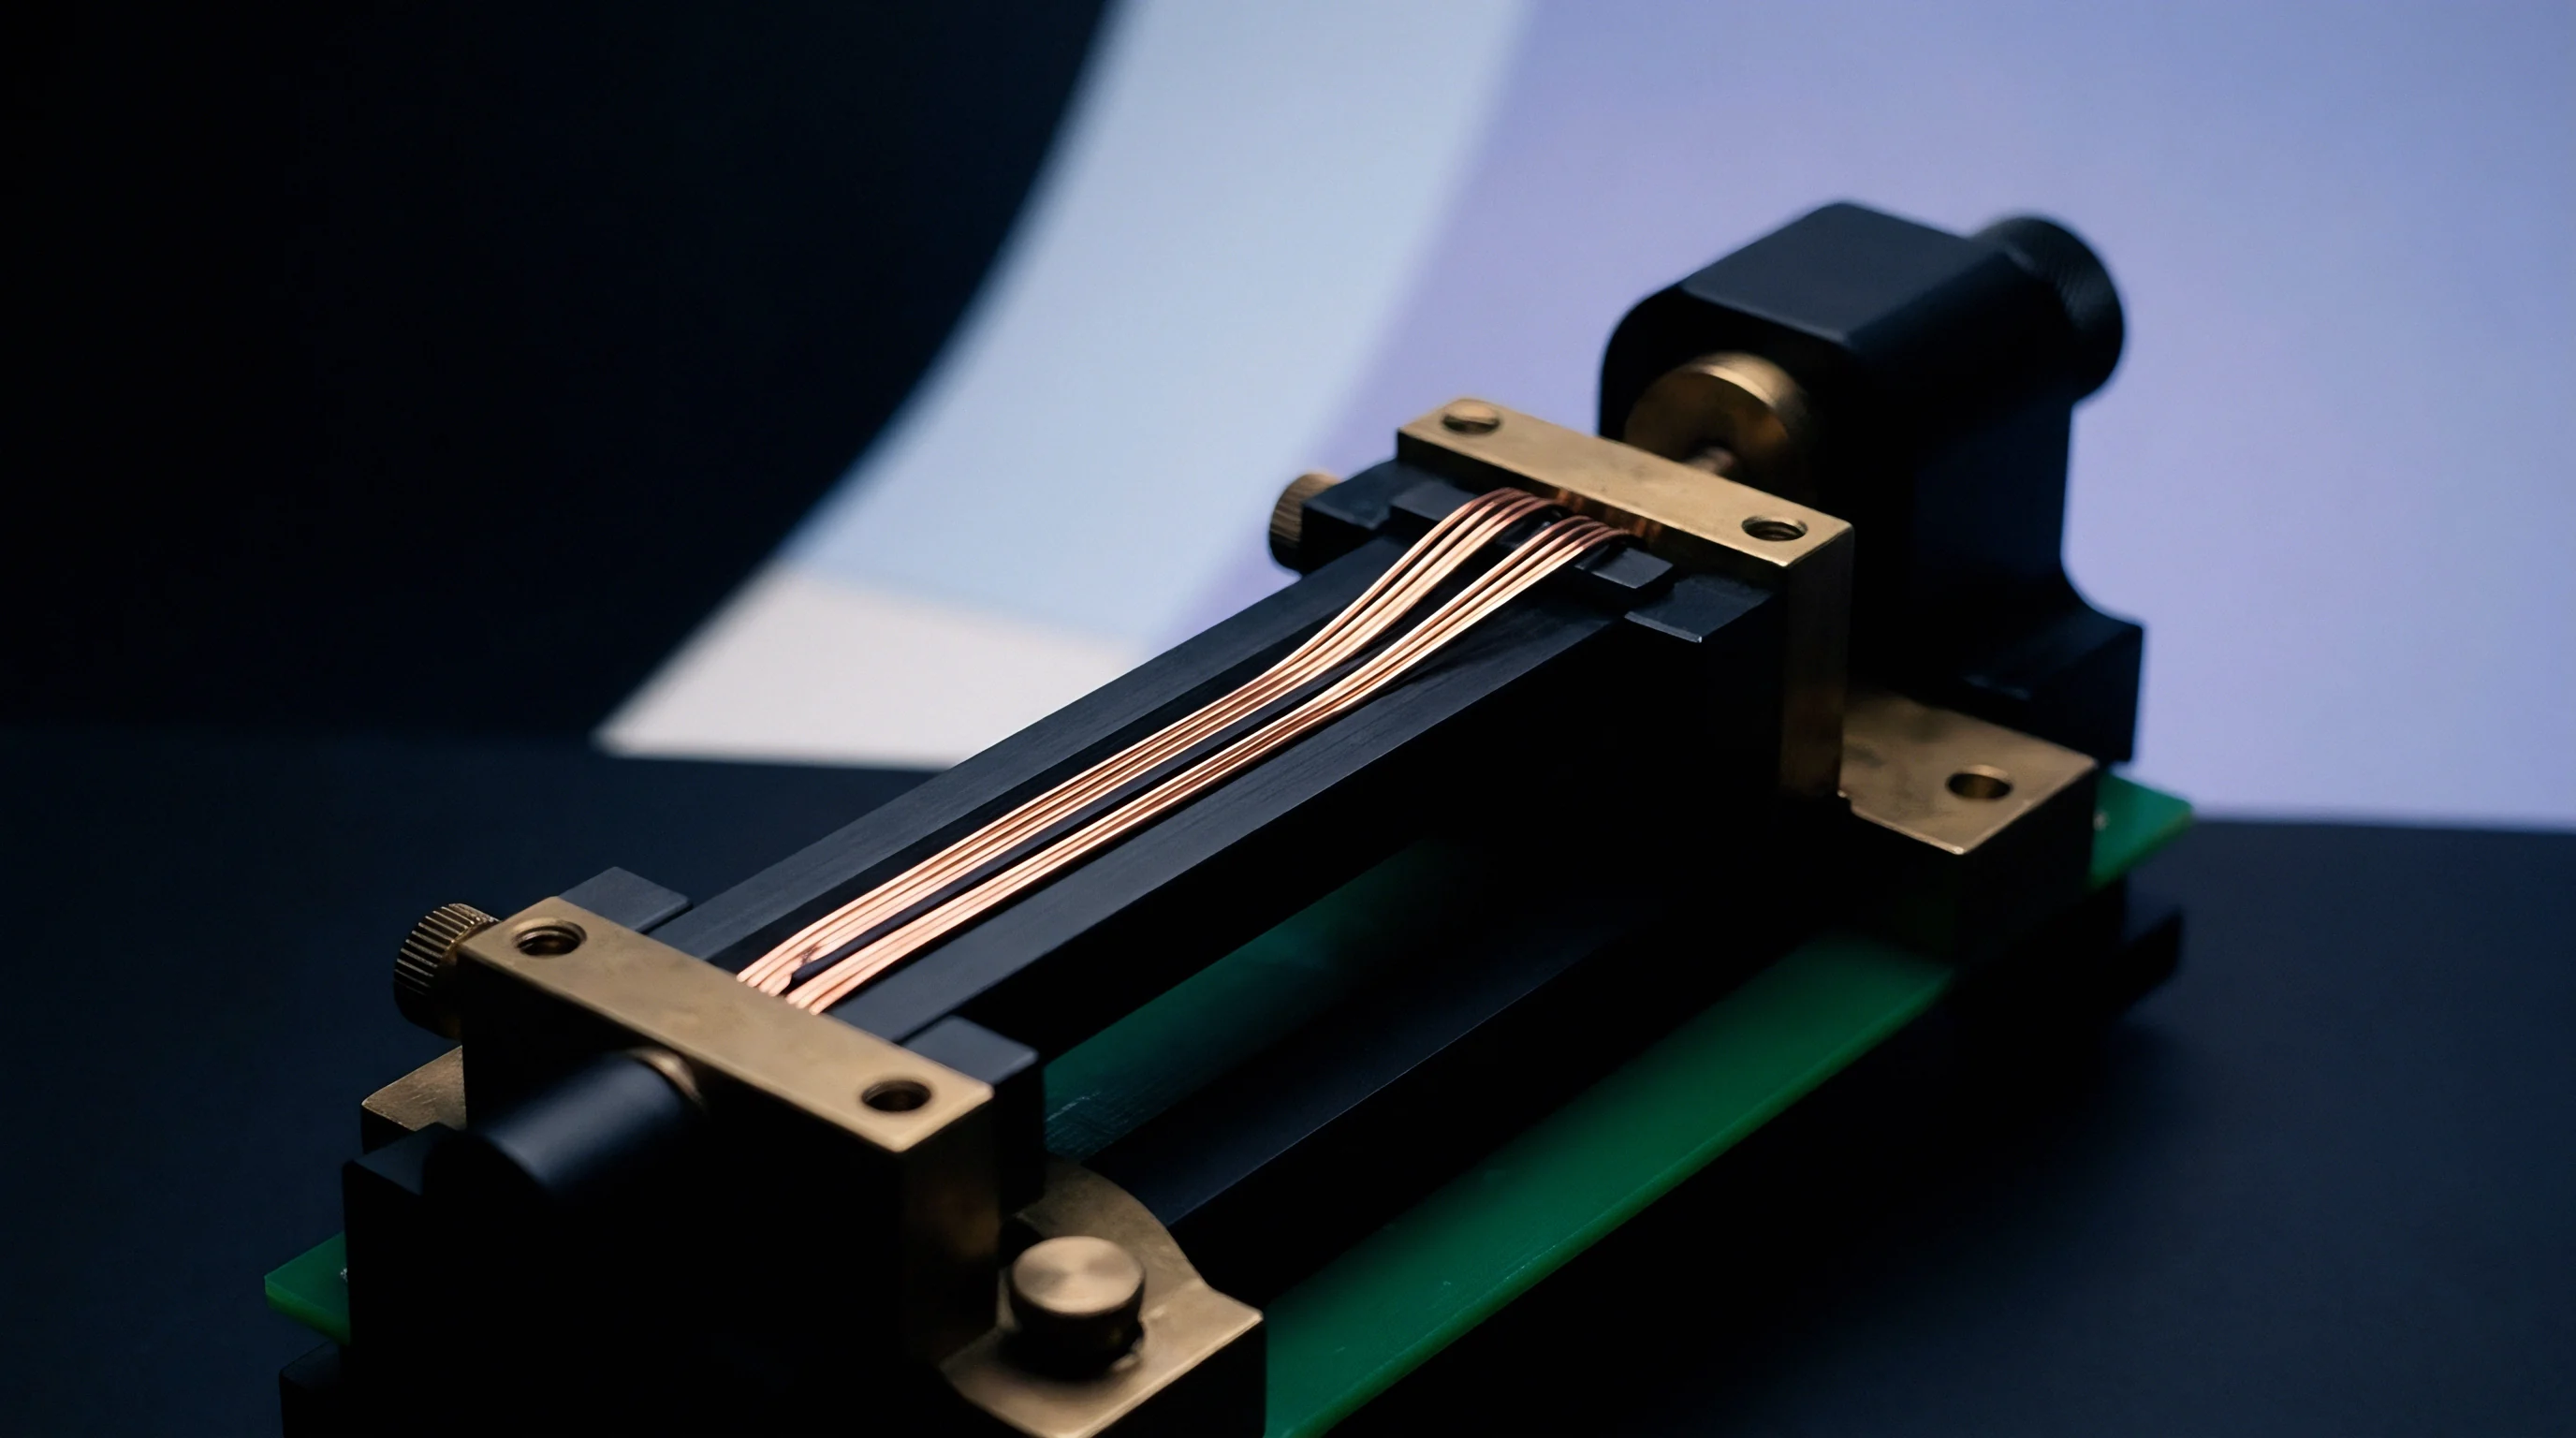
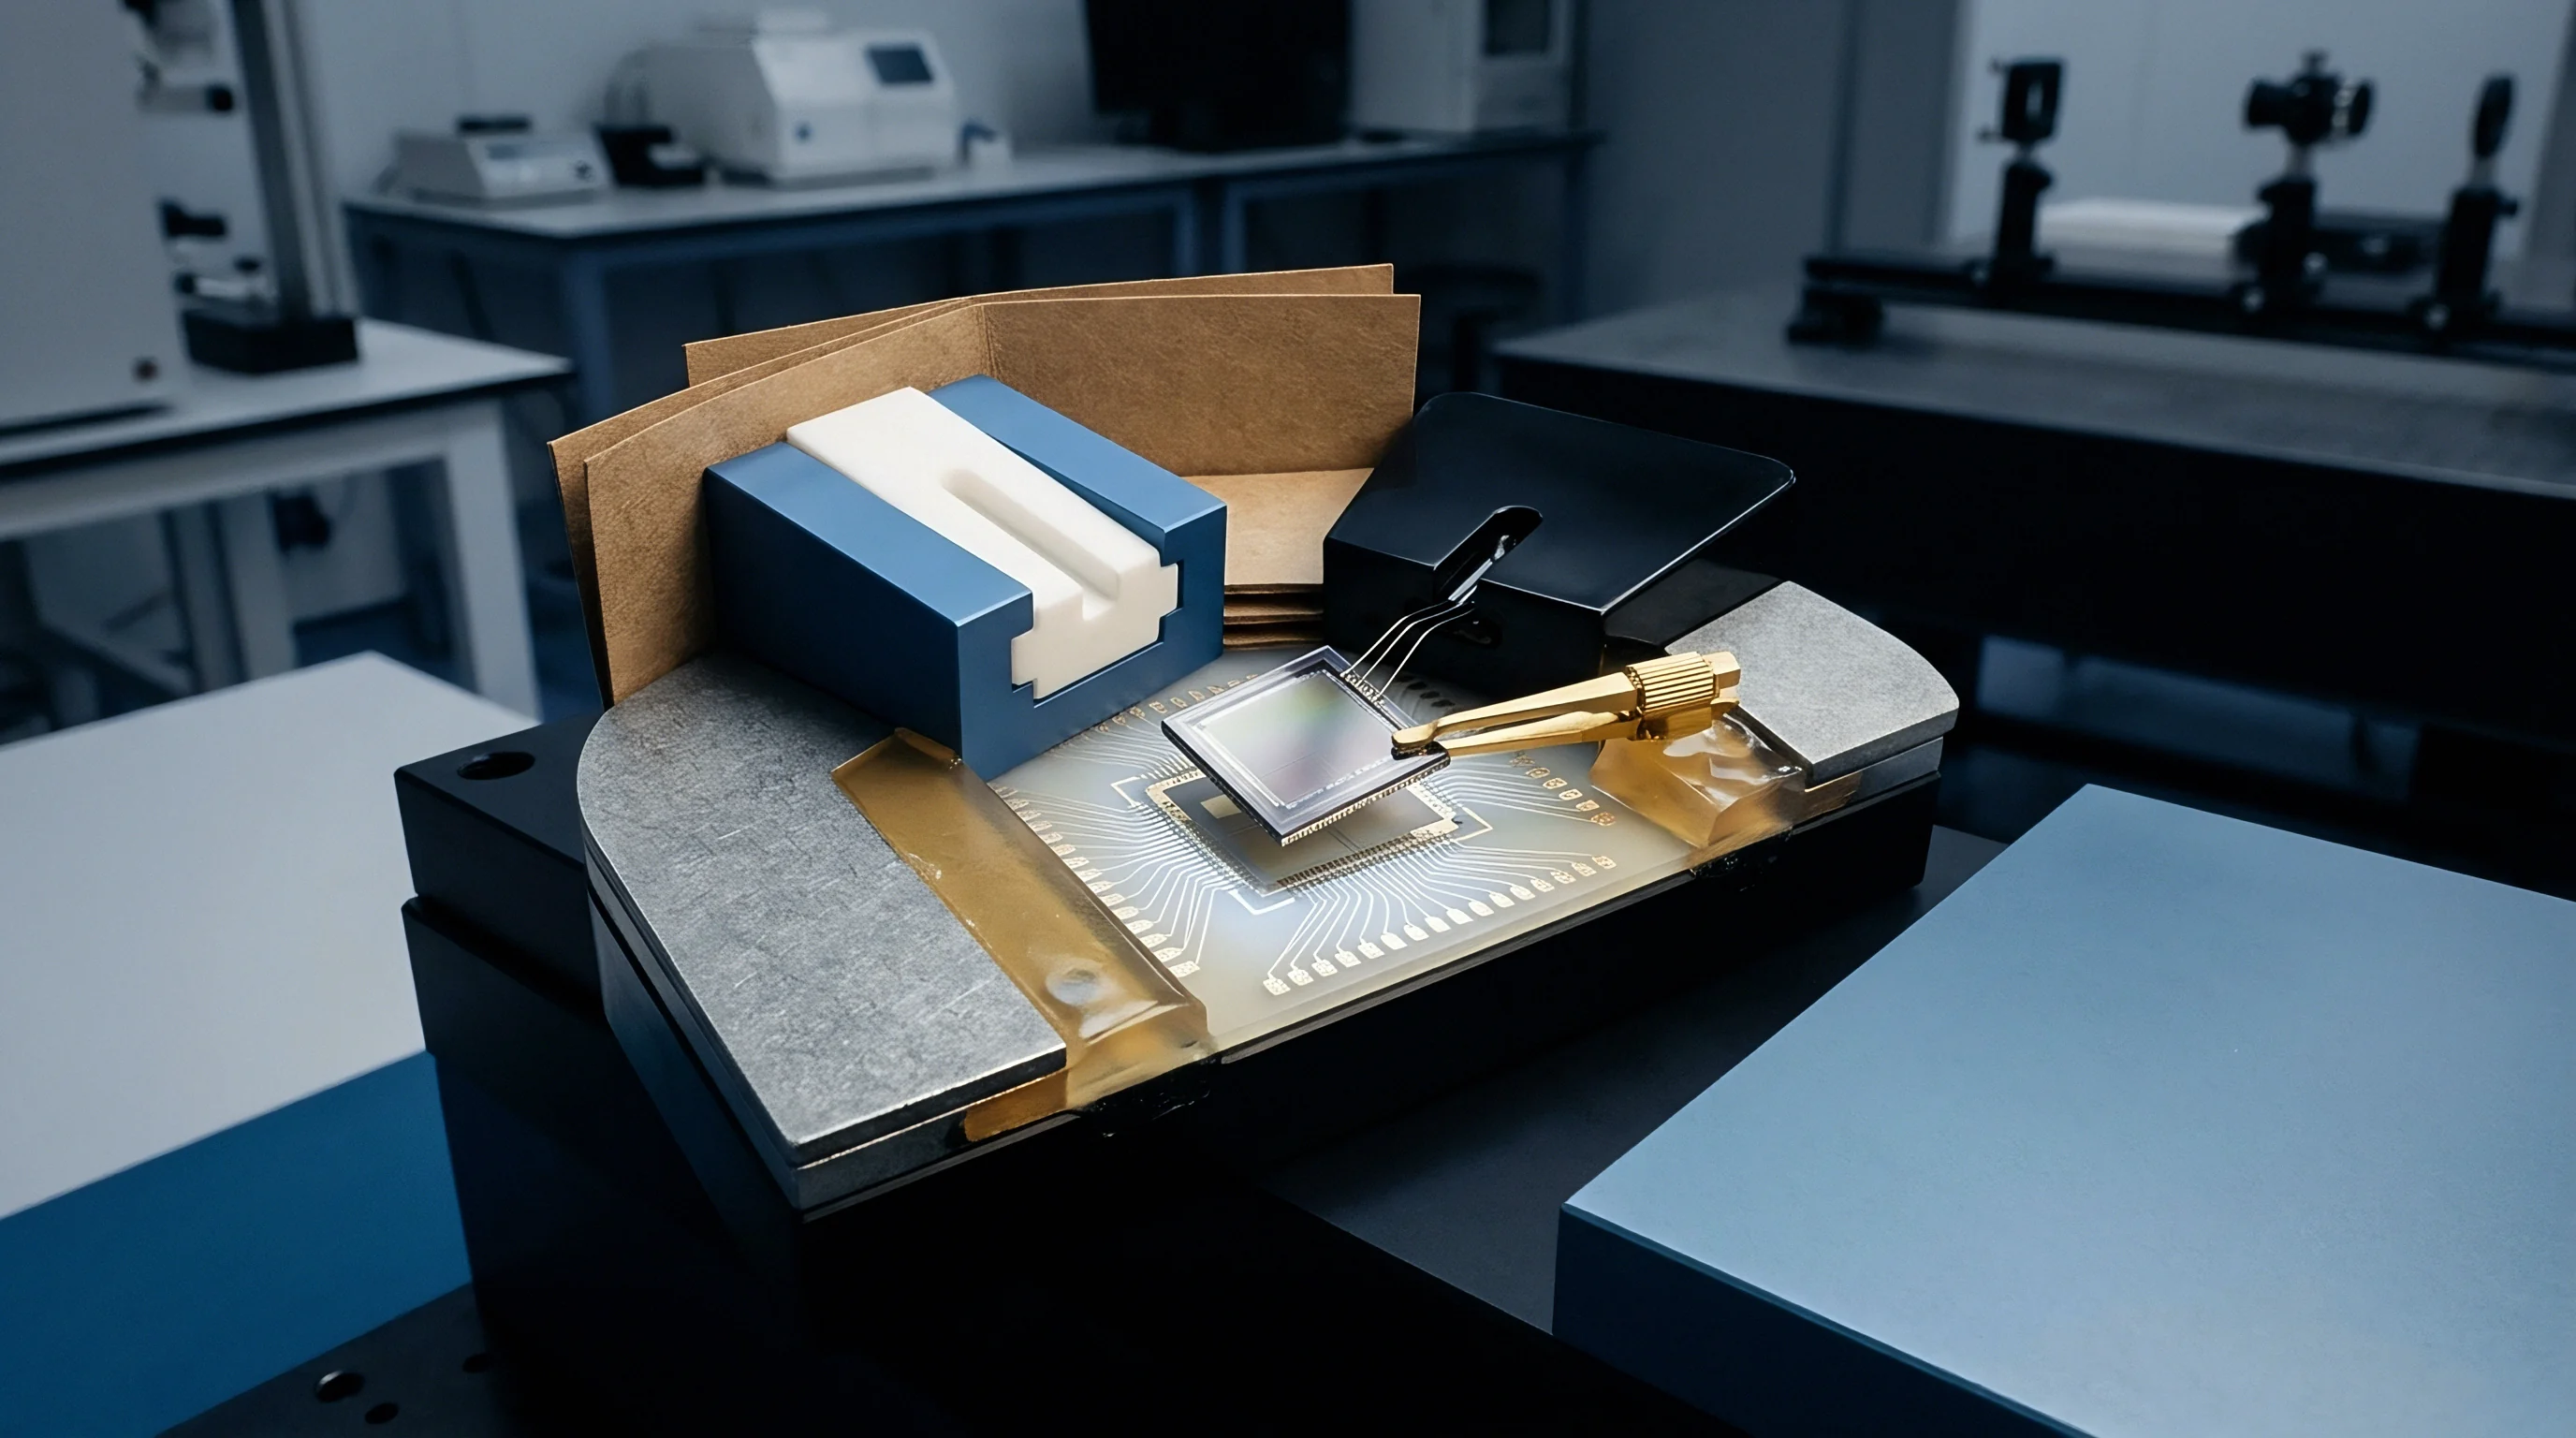
Physical fixturing introduces parasitic resistance shifts and diaphragm distortions that rival transducer drift. Test benches clamping bare sensor packages onto printed circuit boards using torque-loaded fasteners experience continuous joint relaxation. When stainless steel screws settle into FR4 glass-epoxy substrates, the clamping pressure drops across four weeks, allowing package strain relief that registers as zero-point wander on high-resolution bridge amplifiers.
Screws slip under cyclic thermal expansion, copper traces creep under contact pressure, and aluminum test manifolds flex with atmospheric barometric swings to transfer mechanical moments into adhesive bond lines. These mechanical artifacts superimpose onto the raw sensor output, creating an artificial drift vector that vanishes once the test bench finishes settling. Extrapolating this combined mechanical-electrical output yields data detailing test fixture relaxation rather than transducer longevity.
How Does Logarithmic Time Compression Skew Long Term Projections?
Plotting twenty-eight days of drift data on linear axes obscures physical deceleration. Silicon micromachined sensors display a pronounced early logarithmic relaxation slope during the first 100 hours of continuous bias, after which the rate of change per log-decade drops. Fitting an ordinary least squares linear line across days 1 through 28 treats early packaging seating as a continuous, perpetual velocity.
The mathematical outcome appears in standard log-time regression. Consider a sensor exhibiting a total drift of 12 microvolts across four weeks:
- Week one baseline establishes that early stress relaxation produces 7 microvolts of total change within the initial 168 hours of continuous operation.
- Week two stabilization adds 2.5 microvolts across the subsequent 168 hours as mechanical packaging stresses reach preliminary equilibrium.
- Week three tracking contributes 1.4 microvolts of wander, confirming a diminishing geometric rate of change across elapsed time.
- Week four confirmation generates an incremental shift of 1.1 microvolts, bringing total cumulative displacement to 12.0 microvolts.
Extrapolating twelve microvolts linearly gives 156 microvolts across 52 weeks. Fitting a logarithmic degradation curve across the same four data points yields an extrapolated 52-week drift of only 23.4 microvolts. A quality engineering team using the linear projection discards a compliant vendor, inflating unit purchase costs by specifying over-engineered alternatives.
Per IEC 60751, platinum resistance thermometers display structural stabilization over time that invalidates linear drift scaling.
Proper verification requires pre-aging protocols before data acquisition begins. Baking assembled test fixtures at maximum operating temperature for 72 hours relieves mechanical mounting stresses before initiating the baseline measurement sequence. Without thermal conditioning, the test bench measures the relaxation of its own mounting hardware.
Test fixture compliance determines the boundary where observed stability reflects true transducer capability.


Kinetics
Solid State Diffusion and Chemical Aging
Sensor aging mechanisms operate across differing physical laws. Thin-film resistors alter their electrical resistance through vacancy annihilation and surface oxidation, following parabolic kinetics where total change scales with the square root of time. Silicon piezoresistors shift balance points through piezojunction lattice rearrangement and charge trapping within passivation oxide layers.
Electrochemical sensors decay through electrolyte consumption and electrode fouling, maintaining zero-order reaction rates that mimic linear behavior until complete cell dry-out triggers runaway divergence.
Chemical oxidation follows parabolic time scales. When silicon sensors operate below 85 degrees Celsius, solid state diffusion slows so quickly that oxygen migration through protective silicon nitride barriers remains negligible, confining total zero wander to packaging creep. When operating temperatures rise above 125 degrees Celsius, interdiffusion between gold wire bonds and aluminum pads generates intermetallic compounds, initiating abrupt resistance spikes after several months of quiescent stability.
The table below summarizes standard degradation mechanisms observed in industrial sensor packages subjected to twenty-eight day qualification trials:
| Transducer Mechanism | Dominant Kinetic Law | 4-Week Measured Drift | Linear 52-Week Projection | Physical 52-Week True Drift |
|---|---|---|---|---|
| Silicon Piezoresistive Die | Logarithmic Relaxation | 0.035% Span | 0.455% Span | 0.078% Span |
| Thin-Film Platinum RTD | Parabolic Oxidation | 0.012 Ohms | 0.156 Ohms | 0.043 Ohms |
| Electrochemical Gas Cell | Zero-Order Consumption | 0.250 ppm | 3.250 ppm | 3.250 ppm |
| Hall Current Core | Grain Boundary Relaxation | 0.080% Span | 1.040% Span | 0.142% Span |
Arrhenius Acceleration Assumptions and Limits
Engineers shorten qualification schedules by heating environmental chambers to accelerate chemical aging. The Arrhenius relationship scales test duration through the thermal acceleration factor, defined by operational temperature, elevated chamber temperature, and activation energy. For silicon semiconductor mechanisms, activation energies cluster around 0.6 to 0.8 electron volts, theoretically enabling 672 hours at 85 degrees Celsius to simulate 8,760 hours of operation at 25 degrees Celsius.
A thermal acceleration factor derived from a single activation energy breaks down when multiple degradation modes operate simultaneously.
Elevating chamber temperature alters the governing physical mechanics. At 85 degrees Celsius, silicone potting compounds undergo localized outgassing, depositing volatile siloxanes onto exposed transducer faces. Solder joints holding surface-mount decoupling capacitors experience creep fatigue that does not occur during room-temperature operation.
The accelerated test creates failure modes entirely absent from ambient operating profiles.
Activation energy selection introduces severe numerical errors. Assuming an activation energy of 0.8 electron volts when the true physical mechanism operates at 0.5 electron volts distorts the simulated time calculation by an order of magnitude. A 28-day thermal soak designed to simulate twelve months might only compress 73 days of true operational wear.
Sourcing engineers accepting accelerated test dossiers without verifying empirical activation energies buy unverified stability.
Scientific consensus remains divided on whether activation energies measured on bare silicon dice retain validity once dice are sealed inside epoxy transfer moldings.
Budget

Will Chamber Thermal Instability Mask Microvolt Transducer Wander?
Thermal stability inside climatic chambers limits the metrological resolution of long-term drift testing. A sensor with a temperature coefficient of 50 parts per million per degree Celsius shifts its output by 0.05% full-scale span when ambient chamber temperature cycles by one degree Celsius. Industrial climate chambers control temperatures to plus or minus 0.5 degrees Celsius across spatial volumes, introducing thermal cycle wander that obscures genuine sensor aging.
Thermal gradients generate false offset voltages. Peltier cooling plates and resistance heater coils create cyclic air currents that bathe test boards in dynamic thermal ripples. Unless the test design incorporates isothermal balancing blocks fabricated from oxygen-free high-conductivity copper, sensors positioned near chamber supply fans register fluctuating drift rates that mimic electrical instability.
Uncertainty Budget for Four Week Qualification
Establishing true drift rates requires calculating the combined standard uncertainty of the test bench itself. Following JCGM 100 guidelines, every measurement uncertainty contributor must be characterized before drawing drift conclusions. Reference standards wander, digitizer input amplifiers experience thermal drift, and lead-wire thermocouple junctions introduce parasitic Seebeck voltages.
A digital multimeter used as a logging instrument might drift 15 parts per million over 30 days, absorbing half the tolerance allocation intended for the sensor under test. The table below outlines the expanded uncertainty budget for a high-precision sensor qualification bench measuring millivolt-level bridge outputs:
| Uncertainty Contributor | Probability Distribution | Divisor | Standard Uncertainty (uV) |
|---|---|---|---|
| Digital Multimeter 30-Day Stability | Rectangular | 1.732 | 2.89 |
| Chamber Temperature Cycling (0.3 C) | Normal | 1.000 | 3.60 |
| Thermal EMF Parasitic Voltages | Rectangular | 1.732 | 1.15 |
| Precision Bridge Power Rail Drift | Normal | 1.000 | 1.80 |
| Cable Insulation Resistance Leakage | Rectangular | 1.732 | 0.58 |
| Combined Expanded Uncertainty (k=2) | 10.02 uV | ||
When the combined expanded uncertainty equals 10.02 microvolts, resolving a true sensor drift of 12.0 microvolts across four weeks becomes mathematically invalid. The test-to-drift ratio falls below 1.2 to 1, violating the standard metrological requirement for a four-to-one test capability margin. The measured wander remains indistinguishable from the background noise floor of the test instrumentation.
Relying on drift assessments derived from unverified measurement systems results in mass lot recalls and unpaid warranty claims across entire operating fleets.

Acceptance
Procurement teams protect product margins by translating physical degradation limits into rigid commercial specifications. Vendor contracts demanding annual drift guarantees must define testing mathematics, environmental pre-conditioning, and reference instrument calibration intervals. Accepting an ambiguous datasheet claim such as 0.1% annual stability exposes buyers to unrecoverable warranty overhead.
When establishing lot acceptance criteria based on short-term qualification batches, quality teams implement guard banding per ISO 14253-1, shrinking allowable acceptance thresholds by the expanded uncertainty of the test bench. If a transducer must hold 0.20% span drift across twelve months, and four-week screening operates under logarithmic decay assumptions with an instrument uncertainty of 0.03%, the four-week acceptance limit must be pegged at 0.04% rather than a prorated 0.07%.
Commercial contracts must dictate whether burn-in occurs on supplier production lines or during downstream subassembly integration. Solid-state sensors subjected to a 168-hour factory thermal stabilization cycle shed the steepest portion of their logarithmic drift curve before delivery. Shipments arriving without prior thermal stabilization wander outside calibration limits during the customer’s initial ninety days of field operation.
Quality engineers enforce rigorous sampling rules during incoming lot audits. Screening five units from a shipment of ten thousand pieces provides zero statistical confidence regarding population drift distributions. A single outlier experiencing micro-cracking in glass-frit die seals will pass a four-week test before deteriorating catastrophically during autumn humidity swings.
Commercial acceptance language must require suppliers to supply raw time-stamped voltage readings rather than processed linear trendlines. A contract clause specifying that drift compliance shall be adjudicated strictly by logarithmic regression anchored to traceable reference standards eliminates disputes regarding test bench extrapolation methods.