Temperature Dependent Fracture Toughness Extraction along Micro Etched Copper Interfaces
Extracting temperature-dependent interfacial fracture toughness along etched copper prevents reflow delamination and eliminates costly acoustic scan yield loss.

Flaw

Interfacial Separation Mechanics under Thermal Excursions
Micro-etched copper leadframes and redistribution layers crack apart from epoxy mold compounds when reflow ovens hit 260 degrees Celsius. The failure begins at the pre-existing micro-voids along the roughened copper topography. Etching creates re-entrant cavities ranging between 150 nanometers and 1.8 micrometers in root-mean-square roughness.
These cavities establish mechanical interlocking with the polymeric matrix, yet they also act as stress concentrators during moisture vapor expansion and thermal cycling. At ambient room temperature, the bulk polymer resists interfacial separation by transferring shear loads across the interlocked micro-asperities. The energy release rate exceeds 80 Joules per square meter under mixed-mode loading.
As temperature rises through the glass transition zone, matrix relaxation degrades this mechanical interlock. The critical fracture energy drops toward values lower than 12 Joules per square meter near peak reflow. Silicon dies pop loose from leadframes, package seals open, and moisture ingress proceeds unchecked.
Quantifying this interface demands calculating the critical strain energy release rate across the entire thermal profile dictated by standard soldering curves. Designers evaluating bottom-terminated packages like quad-flat no-leads or power quad-flat no-leads treat the copper-to-mold interface as a structural bond that shields internal wire bonds from external strain. If the copper interface unzips during assembly, thermal dissipating paths break immediately.
The die shifts position. The wire bonds sheer under thermomechanical shear stress. Package designers extract interfacial toughness using mixed-mode flexure setups inside environmental thermal chambers.
The data generated by these extractions dictates leadframe etching recipes, adhesion promoter bath chemistries, and the maximum allowable package thickness. The numbers tell the buyer whether an integrated circuit will survive three successive passes through a lead-free reflow profile without internal delamination.
The fracture energy depends heavily on the mode mixity angle. Mode I tensile separation strips the resin out of the etch pits, while Mode II shear forces the polymer to shear off against the copper micro-peaks. Pure Mode I loading produces the lowest fracture resistance values across all test temperatures.
When an engineer specifies an adhesion promoter or a chemical micro-etch, the goal centers on raising the Mode I energy threshold above 20 Joules per square meter at 220 degrees Celsius. Achieving this performance prevents popcorn cracking during reflow. Surface roughness alone proves insufficient when the local copper oxide layer exhibits low cohesive strength.
Cuprous oxide films exceeding 15 nanometers in thickness fracture cohesively, creating a weak boundary layer regardless of root-mean-square roughness values. The extraction process separates cohesive failure within the oxide from pure interfacial adhesive failure between copper and resin.
Brittle cuprous oxide layers thicker than 15 nanometers cause premature interfacial separation along etched copper leadframes under mixed-mode reflow conditions.
The operational risk directly affects the printed circuit board assembly line. Delamination appearing after the second reflow cycle distorts the ground plane contact on bottom-terminated packages. A power field-effect transistor or digital pressure sensor loses its thermal dissipation path through the exposed thermal pad.
The thermal resistance between junction and case climbs steeply, occasionally tripling its nominal value. Under heavy load conditions, the silicon die overheats within seconds, triggering thermal shutdown or permanent silicon gate destruction. Sourcing teams paying low piece prices for leadframes often discover that suppliers achieved nominal roughness targets using rapid acidic micro-etching baths that leave brittle oxide remnants behind.
The package passes acoustic microscopy tests after assembly, yet fractures completely during customer thermal qualification testing.
The extraction of interfacial fracture toughness provides the raw input required for numerical cohesive zone modeling in finite element simulations. Designers map the traction-separation law onto the package interface elements to predict corner delamination during solder shock. Without accurate temperature-dependent traction-separation parameters, these simulations fail to capture the onset of crack propagation at corners.
Sourcing decisions rely on cohesive parameters to accept or reject alternative leadframe plating options. A change in the chemical micro-etch formulation shifts the fracture energy curve across the entire operational temperature spectrum.

Specimen

Beam Geometries and Co-Cured Interfaces
Engineers quantify fracture toughness along etched metal-polymer boundaries by fabricating bimaterial flexure specimens. The four-point bend delamination specimen and the double cantilever beam specimen dominate mechanical qualification pipelines. Fabricating these test vehicles demands strict control over the copper preparation, resin dispensing, and cure shrinkage profiles to prevent excessive residual stresses prior to testing.
A typical test strip measures 60.0 millimeters in total length, 8.0 millimeters in width, and incorporates a balanced copper-to-mold compound thickness ratio. The copper substrate thickness holds at 1.00 millimeter with a tolerance of plus or minus 0.02 millimeters. The mold compound layer matches this 1.00 millimeter dimension to minimize asymmetric thermal warpage during post-mold curing.
A fluoropolymer release film or thin gold sputter layer creates a precise pre-crack along the micro-etched interface. The release film thickness must remain below 12 micrometers to prevent severe blunt-notch stress distortions at the crack initiation site. When the precrack edge presents an excessive radius, the measured fracture initiation load climbs artificially high, introducing non-conservative errors into subsequent finite element simulations.
The mechanical release strip sits exactly 15.0 millimeters from the beam edge, establishing a starter crack length of 20.0 millimeters for double cantilever configurations. In four-point bend geometries, an upper notch cut through the polymeric beam terminates directly at the etched copper interface. This notch channels the mechanical crack path down to the metal surface where it transitions into interfacial delamination.
| Specimen Architecture | Beam Width (mm) | Total Thickness (mm) | Precrack Length (mm) | Nominal Mode Mixity (Degrees) |
|---|---|---|---|---|
| Double Cantilever Beam | 8.00 ± 0.05 | 2.00 ± 0.04 | 20.0 ± 0.1 | 0 (Pure Mode I) |
| End-Notched Flexure | 8.00 ± 0.05 | 2.00 ± 0.04 | 15.0 ± 0.1 | 90 (Pure Mode II) |
| Four-Point Bend Delamination | 6.00 ± 0.05 | 1.50 ± 0.03 | 10.0 ± 0.1 | 42 to 45 (Mixed Mode) |
| Mixed-Mode Bending Apparatus | 8.00 ± 0.05 | 2.00 ± 0.04 | 18.0 ± 0.1 | Variable (15 to 75) |
The preparation sequence alters the local morphology of the copper surface. Chemical micro-etch baths dissolve pure copper while depositing organic rust inhibitors or organo-metallic conversion coatings. Typical industrial etching chemistries employ hydrogen peroxide and sulfuric acid blends or sodium persulfate formulations.
The bath temperature holds at 35 degrees Celsius with a tolerance of plus or minus 1.0 degree Celsius, while dwell time determines the cavity aspect ratios. Over-etched surfaces yield deep, narrow cavities that high-viscosity epoxy mold compounds cannot penetrate cleanly during transfer molding. This incomplete wetting traps micro-bubbles along the interface, collapsing the active mechanical interlocking area.
The measured fracture toughness drops by more than 40 percent when transfer molding viscosity prevents resin from filling the lowest 200 nanometers of the etched cavities.
Post-cure thermal processing locks in residual stresses that skew the extracted mechanical toughness values. The mismatch in thermal expansion coefficients drives this distortion. Copper exhibits a linear expansion coefficient around 17 parts per million per Kelvin.
Mold compounds demonstrate expansion rates between 8 and 14 parts per million per Kelvin below their glass transition, surging to 35 parts per million per Kelvin above it. Cooling the bi-material beam from the post-mold cure temperature of 175 degrees Celsius down to 23 degrees Celsius induces residual compression in the resin and tension in the copper. If these internal stresses remain uncorrected during calculation, the apparent fracture toughness departs substantially from the actual thermodynamic adhesive energy.
The specimen extraction plan enforces strict manufacturing parameters:
- Substrate Degreasing Protocol removes residual hydrocarbons through an alkaline wash followed by a cascade deionized water rinse with resistivity exceeding 15 Megaohm-centimeters.
- Controlled Micro-Etch Dwell holds copper panels in an acidic bath for 45 to 60 seconds to achieve an arithmetic mean roughness between 0.35 and 0.55 micrometers.
- Silane Adhesion Treatment applies an organofunctional silane coupling agent via dip-coating with an air-knife dry sequence to form a chemical monolayer.
- Transfer Mold Injection encapsulates the etched beam at 175 degrees Celsius under 7.0 Megapascals of ram pressure with a transfer time of 12 seconds.
The supplier claimed that mechanical roughing by physical grit-blasting yields identical fracture results to chemical micro-etching while lowering chemical disposal expenses on the packaging line.

Chamber

Environmental Control and High-Temperature Loading Fixtures
Thermal stability inside the mechanical test zone dictates the repeatability of fracture extraction. Testing bi-material specimens across temperatures spanning minus 40 degrees Celsius to 260 degrees Celsius demands a forced-convection environmental chamber mounted directly around the load frame crosshead. Liquid nitrogen expansion cooling manages low-temperature runs, while ceramic heating elements govern high-temperature regimes.
Temperature uniformity across the specimen gauge length must stay within a band of plus or minus 0.5 degrees Celsius. Thermocouple placement proves sensitive. Clamping a thermocouple directly to the fixture body introduces thermal conduction lag, obscuring the true core temperature of the bi-material specimen.
Calibrated thermocouples attach directly to an uncracked sacrificial specimen suspended adjacent to the active test strip. Mechanical loading commences only after a thermal soaking period of ten minutes settles all thermal gradients through the polymeric layer. Heating rates must not exceed 5 degrees Celsius per minute to prevent uneven thermal expansion that twists the specimen in its grips.
In four-point bending setups, loading rollers manufactured from high-nickel alloys prevent indentation creep at high temperatures. Roller indentation into softened epoxy resins absorbs mechanical work, distorting load-displacement data into an artificial rise in perceived fracture toughness. Roller diameters must measure at least 4.00 millimeters to spread contact loads over a wider footprint.
ASTM D5528 dictates that environmental soaking periods must eliminate through-thickness thermal gradients before load actuation begins in high-temperature crack extraction.
Displacement instrumentation demands optical non-contact tracking when operating beyond 150 degrees Celsius. Traditional linear variable differential transformers introduce mechanical mass and heat sinks when coupled directly to the miniature specimen arms. Video extensometry and digital image correlation systems resolve specimen opening displacements through quartz viewing windows built into the chamber door.
High-speed digital cameras equipped with telecentric lenses record speckle pattern displacement on the specimen edge. The speckle paint must withstand 260 degrees Celsius without charring, flaking, or outgassing solvents that degrade optical contrast. High-temperature ceramic spray paints maintain stable optical speckle patterns across the entire reflow temperature profile.
Load cells positioned inside the heated enclosure drift significantly under shifting thermal gradients. The test apparatus isolates the strain-gauge load cell outside the environmental chamber using an extended ceramic pull rod. The rod incorporates water-cooling jackets to prevent heat conduction from reaching the load cell housing.
Load measurement accuracy remains within 0.05 Newtons across a total load range of zero to 500 Newtons. Frictional drag through the chamber entry ports represents a hidden error source. Flexible silicone or fluorelastomer bellows seal the chamber penetration points without exerting axial parasitic loads on the moving pull rod.
Periodic tare calibrations confirm that mechanical seal friction stays below 0.02 Newtons across the entire crosshead travel range.
Moisture conditioning prior to chamber loading alters interfacial failure thresholds. Storing samples under JEDEC Level 3 conditions of 30 degrees Celsius and 60 percent relative humidity introduces moisture into the epoxy network. Testing the specimen immediately inside a preheated chamber at 260 degrees Celsius replicates the vapor pressure spikes experienced inside plastic packages during reflow.
Rapid moisture vaporization along the crack front produces internal gas pressures that superimpose mechanical tensile stresses on the applied external load. If the chamber testing protocol neglects relative humidity control during specimen transfer, moisture escapes from the thin specimens within three minutes of chamber exposure, generating non-reproducible fracture toughness measurements.
When the thermal chamber ventilation is configured incorrectly, hot gas streams generate asymmetric cooling that warps the specimen prior to load application.

Kinetics
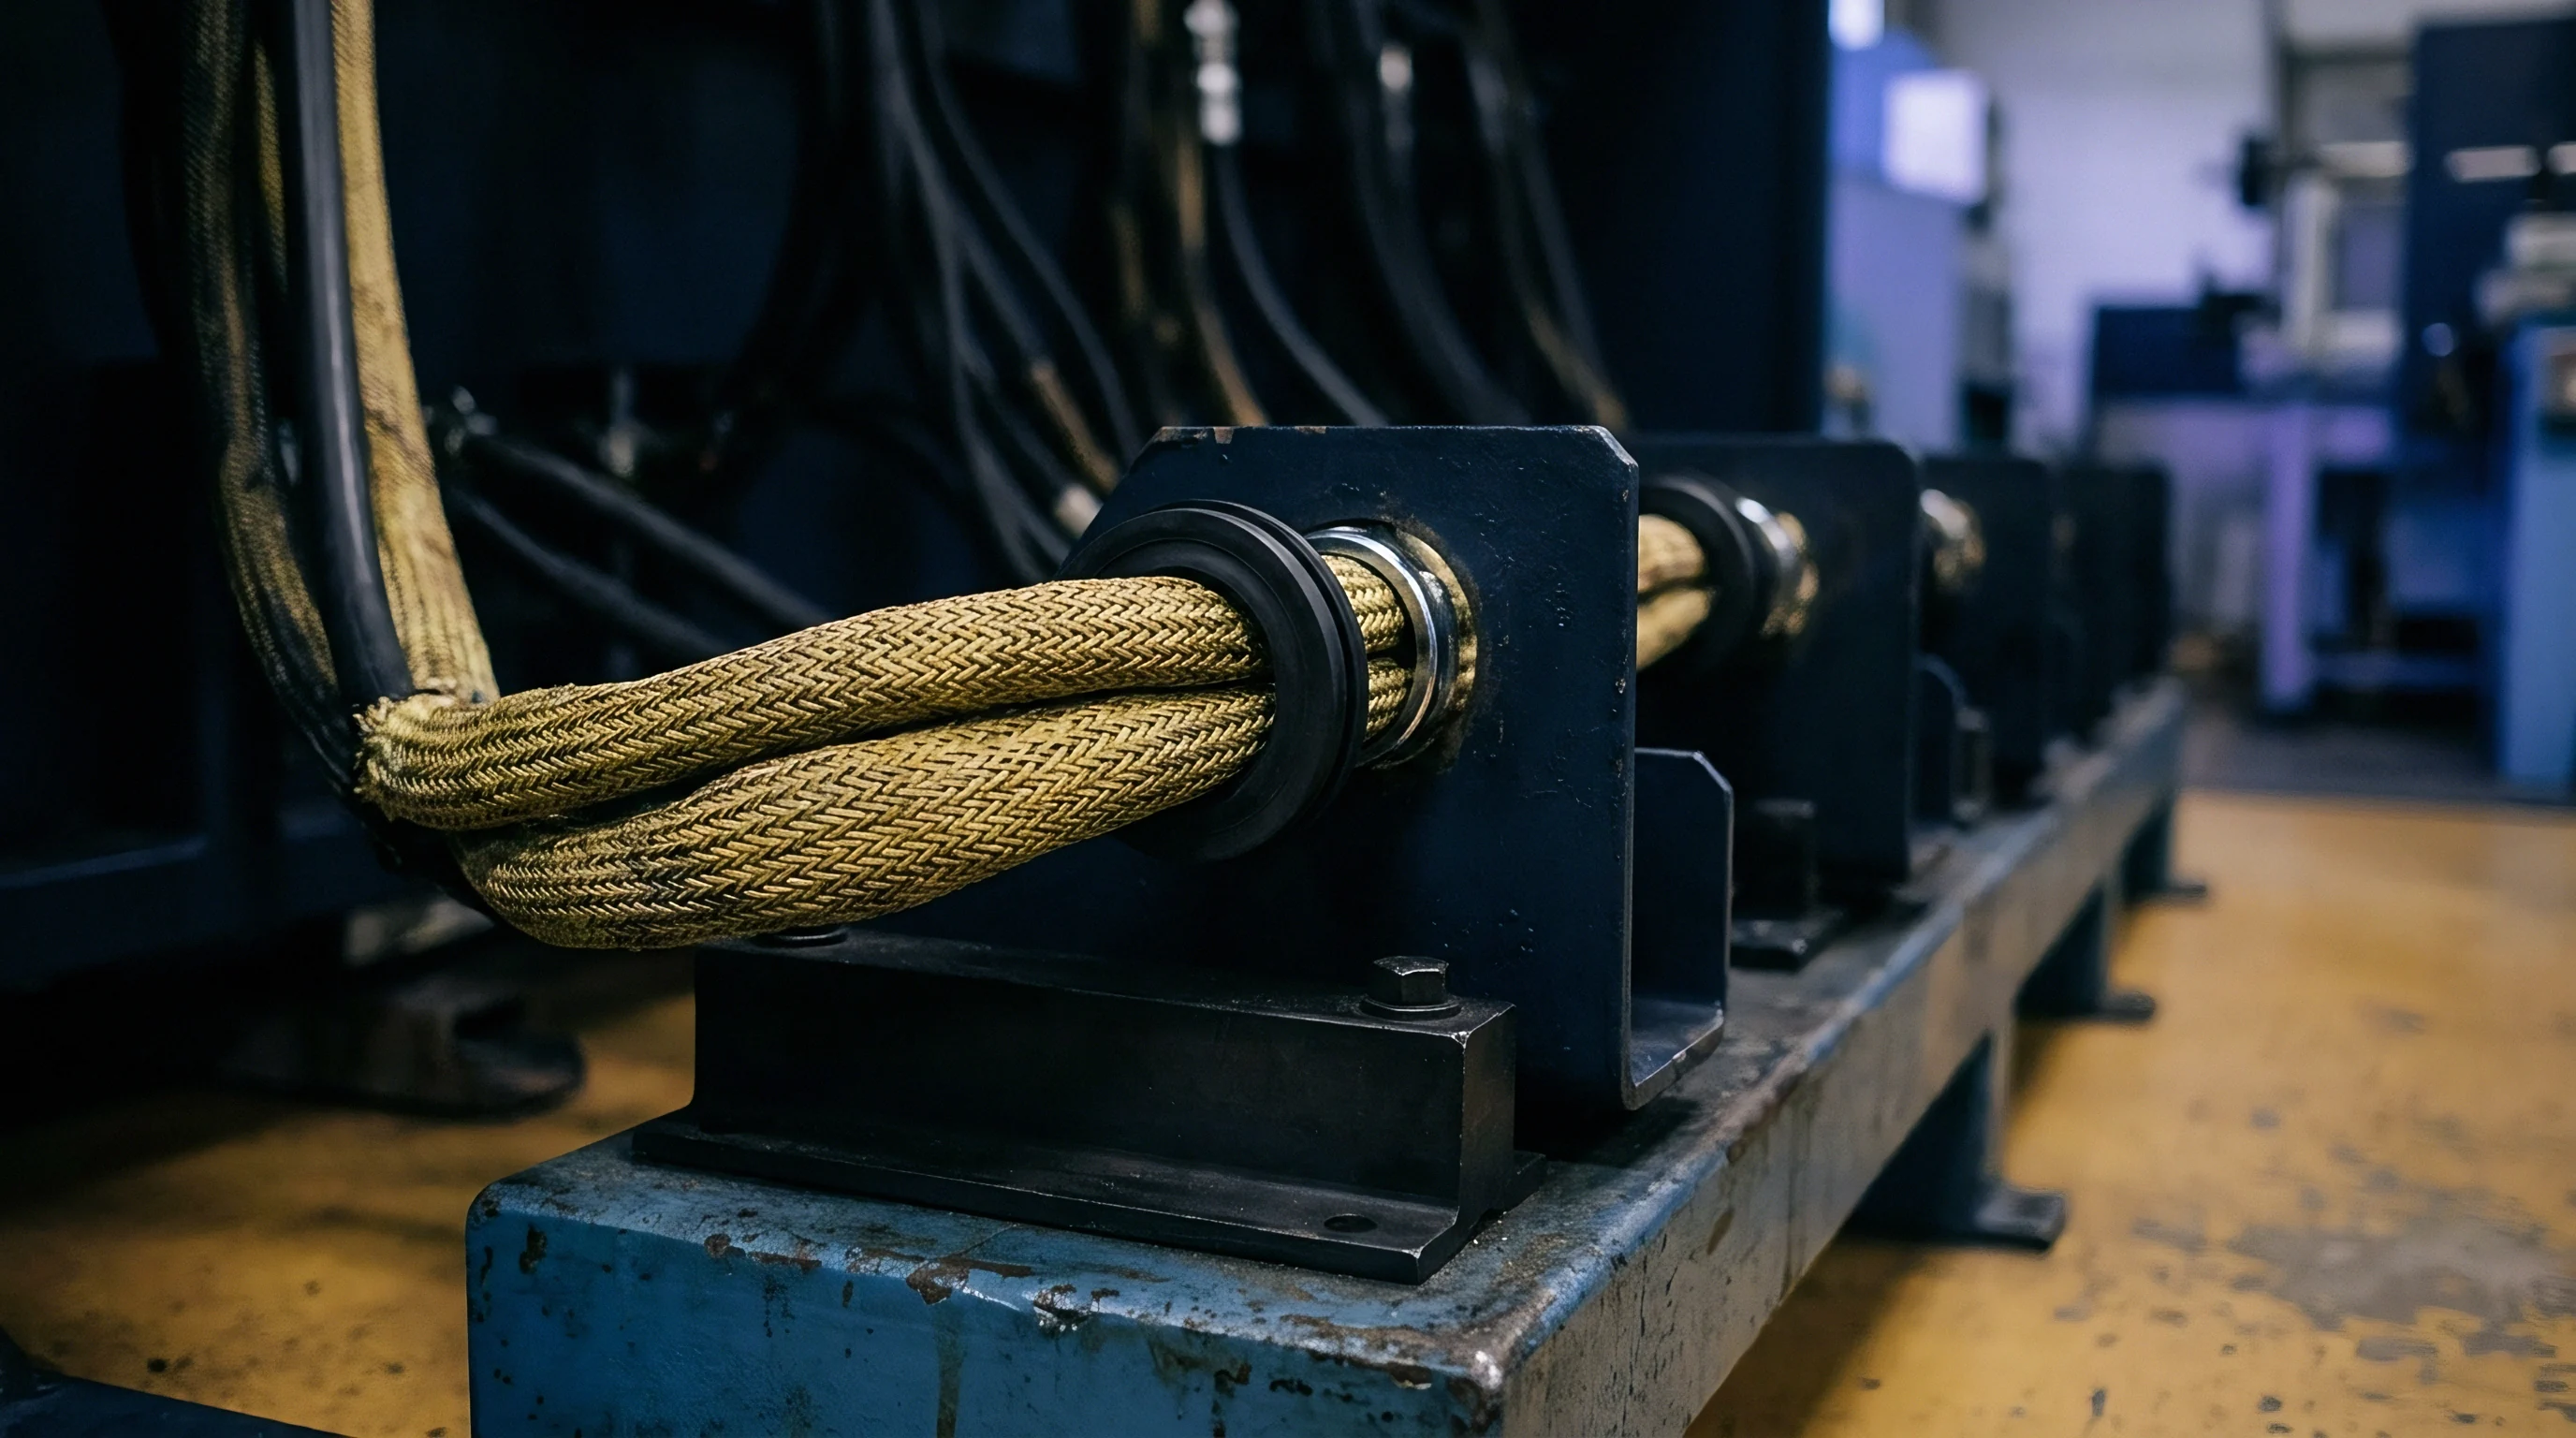
Viscoplastic Energy Dissipation and Crack Propagation
Crack propagation rates through etched interfaces depend heavily on the viscoelastic relaxation of the adjacent epoxy mold compound. As test temperatures approach the glass transition range between 120 and 160 degrees Celsius, the storage modulus of the resin plummets from approximately 22 Gigapascals down to less than 1.5 Gigapascals. The loss modulus surges simultaneously, denoting an expansion of the crack-tip plastic dissipation zone.
The energy applied by the external load frame divides into two parts: the true thermodynamic work of adhesion required to break the interfacial bonds, and the viscoplastic dissipation occurring within the bulk polymer surrounding the crack tip. The extraction protocol must separate these distinct energy sinks to yield transportable material parameters.
The total energy release rate extracted directly from load-displacement curves overstates interfacial strength if plastic dissipation remains uncorrected. At ambient temperatures, the crack-tip plastic zone spans only a few micrometers, rendering linear elastic fracture mechanics valid for extracting interfacial toughness. At 220 degrees Celsius, this plastic dissipation zone expands significantly, sometimes engulfing the entire thickness of the polymer beam layer.
The mechanics transition fully into elastic-plastic fracture territory. The J-integral method replaces standard beam theory formulations under these high-temperature conditions. Calculating the J-integral demands continuous integration of the stress and displacement fields along an arbitrary path enclosing the crack tip outside the localized inelastic deformation zone.
Loading rates dictate whether the interface fractures in a stable or unstable regime. Applying crosshead speeds of 0.50 millimeters per minute allows extensive viscoplastic flow in the polymer, raising the apparent critical energy release rate. Increasing the crosshead speed to 50.0 millimeters per minute restricts molecular chain motion, driving the polymer into a glassy, brittle state that drops the apparent fracture toughness toward the true thermodynamic adhesive value.
Sourcing qualifications demand uniform crosshead velocities to ensure valid comparisons between different vendor lots. Typical qualification protocols fix crosshead rates at 1.00 millimeter per minute with a displacement tolerance of plus or minus 0.01 millimeters per minute.
| Temperature Regime | Test Range (°C) | Storage Modulus (GPa) | Loss Tangent (tan δ) | Typical Fracture Mode |
|---|---|---|---|---|
| Sub-Ambient | -40 to 0 | 24.5 ± 0.8 | 0.015 ± 0.002 | Interfacial Cleavage |
| Room Temperature | 20 to 25 | 21.0 ± 0.5 | 0.022 ± 0.003 | Interfacial / Micro-Shear |
| Glass Transition Range | 120 to 160 | 8.5 down to 1.8 | 0.280 ± 0.040 | Viscoplastic Tearing |
| Reflow Peak Range | 220 to 260 | 1.1 ± 0.2 | 0.085 ± 0.010 | Cohesive Oxide / Resin Failure |
The fracture resistance curves, or R-curves, illustrate crack propagation resistance as a function of delamination extension length. For a smooth copper surface, the R-curve remains flat, indicating brittle, history-independent crack growth. For a micro-etched surface, the R-curve climbs steeply over the first 500 micrometers of crack growth.
Mechanical interlocking creates an active bridging zone behind the advancing crack tip. As the crack opens, micro-ligaments of epoxy remain trapped inside the undercut copper cavities. These ligaments stretch, pull out, and tear cohesively, dissipating mechanical energy behind the crack tip.
The plateau of the R-curve represents the steady-state fracture toughness, which can be up to three times higher than the crack initiation toughness.
The mathematical extraction of the critical energy release rate from double cantilever beam specimens applies the modified beam theory formulation incorporating shear corrections and crack-tip rotation:
G_c = (3 P_c δ_c) / (2 b (a + Δ))
The critical load at crack initiation appears as P_c, while δ_c represents the corresponding crosshead displacement. The beam width is represented by b, and a denotes the measured crack length. The correction term Δ accounts for compliance contributions from crack-tip rotation and deflection within the specimen arm.
Engineers extract Δ experimentally by plotting the cube root of specimen compliance against crack length; the negative intercept on the horizontal axis yields the exact correction parameter. Omitting Δ inflates the computed toughness value by 8 to 15 percent, obscuring weak bonding interfaces during incoming lot inspections.
Micro-structural examination confirms that when temperatures exceed the glass transition point, the dominant crack trajectory often shifts out of the direct interface, wandering into the first few micrometers of the bulk resin.

Yield
How Sourcing Specifications Enforce Reflow Survival?
Delamination during industrial surface-mount assembly directly destroys manufacturing yield. Package sourcing teams must translate mechanical fracture values into enforceable purchase specifications. Sourcing documents that simply mandate compliance with generic IPC/JEDEC J-STD-020 guidelines transfer packaging risk directly to the buyer.
Suppliers select the most compliant epoxy compound formulations to pass initial qualification testing on pristine test vehicles, then implement unannounced resin filler adjustments to accelerate injection cycle times in high-volume production. When filler loadings change, interfacial toughness plummets at elevated temperatures, leading to acoustic micro-imaging failures after mass assembly.
A rigorous leadframe specification enforces minimum fracture toughness thresholds across three distinct operational temperatures. The threshold table forms an integral part of the incoming master service agreement. Leadframe shipments failing these energy release rate benchmarks face immediate lot rejection at the receiving dock.
Incoming inspection requires harvesting random leadframe coupons from each production plating lot, followed by standardized mold-compound bonding tests using dedicated laboratory transfer presses. Without these quantitative mechanical gates, the assembly plant absorbs the entire cost of scrap when packages crack open during double-sided reflow passes.
Leadframe purchase specifications without temperature-staged fracture toughness thresholds transfer reflow delamination risks entirely to the assembly line.
1. Extract four coupon samples from the leadframe strip reels representing the leading edge, center, and trailing edge of each electroplating batch run.
2. Subject the coupon samples to micro-etch bath immersion for exactly 50 seconds followed by deionized cascade rinsing and rapid infrared drying.
3. Transfer-mold standardized bi-material beams using the buyer’s approved qualification mold compound at 175 degrees Celsius.
4. Precondition the finished test beams under JEDEC Level 3 moisture soak profiles for 192 hours at 30 degrees Celsius and 60 percent relative humidity.
5. Execute four-point bend delamination testing inside an environmental chamber at 23, 150, and 260 degrees Celsius within 15 minutes of moisture chamber removal.
6. Verify that extracted steady-state critical energy release rates exceed the agreed baseline limits across all thermal test stations.
The commercial gap between raw leadframe pricing and the total landed cost of finished packages penalizes buyers who ignore interface fracture extraction. Micro-etched leadframes carry a price premium over mechanically roughened or smooth alternatives, typically adding between 0.008 and 0.015 dollars per unit on a standard quad-flat no-lead package. However, running standard smooth copper frames through double-sided reflow lines induces an average package delamination reject rate of 1.2 to 2.4 percent under automated acoustic scanning.
On a run of 500,000 sensor packages, that yield loss scraps more than 12,000 units, completely wiping out the upfront savings achieved on cheaper frame finishes.
Suppliers frequently defend high-temperature delamination failures by citing moisture exposure beyond specified floor life limits rather than acknowledging degradation in their chemical micro-etching baths.

Arithmetic
Worked Yield Model and Sourcing Cost Comparison
Quantifying the return on investment for high-toughness micro-etched leadframes demands modeling the financial fallout of package failure. Consider a production run of 1,000,000 packaged environmental sensor units destined for automotive engine control modules. The sensor incorporates an exposed-pad quad-flat no-lead package measuring 5.00 by 5.00 millimeters with a 0.85-millimeter profile.
The bill of materials assigns an integrated circuit die cost of 1.45 dollars, wire bonding and package assembly expenses of 0.35 dollars, and a testing overhead of 0.12 dollars, producing a base manufacturing cost of 1.92 dollars before factoring in leadframe options.
Assume three competing leadframe surface treatments: Option A utilizes standard mechanical flash copper with minimal micro-roughness. Option B implements standard chemical micro-etching without an organosilane adhesion monolayer. Option C specifies advanced chemical micro-etching combined with an organosilane coupling layer optimized for high-temperature fracture resistance.
Option A commands a unit cost of 0.040 dollars, Option B costs 0.052 dollars, and Option C carries a premium unit price of 0.065 dollars. The mechanical properties dictate assembly yield under standard triple-reflow conditions (representing two board assembly passes plus one potential rework cycle).
| Evaluation Parameter | Option A: Mechanical Flash | Option B: Standard Micro-Etch | Option C: Advanced Silane Etch |
|---|---|---|---|
| Fracture Toughness at 260°C (J/m²) | 4.2 ± 0.6 | 11.5 ± 1.2 | 22.8 ± 1.5 |
| Reflow Delamination Failure Rate (%) | 3.80 | 0.85 | 0.04 |
| Scrapped Packaged Units | 38,000 | 8,500 | 400 |
| Direct Material Loss ($) | 74,480 | 16,762 | 794 |
| Acoustic Scanning Inspection Cost ($) | 25,000 | 25,000 | 5,000 |
| Leadframe Procurement Expense ($) | 40,000 | 52,000 | 65,000 |
| Total Realized Cost of Packaging ($) | 139,480 | 93,762 | 70,794 |
Option A triggers catastrophic financial losses during board-level reflow qualification. A failure rate of 3.80 percent scraps 38,000 completed IC assemblies. The scrapped dies, gold wire, molding compound, and testing time generate a direct financial loss of 74,480 dollars.
Furthermore, because Option A exhibits known marginality, the assembly line must subject 100 percent of the finished batch to scanning acoustic microscopy, adding 25,000 dollars in non-destructive testing line time. The total packaging expense for Option A reaches 139,480 dollars, despite providing the lowest nominal piece price on the original bill of materials.
Option C requires an initial procurement premium of 25,000 dollars over Option A. However, the high critical fracture toughness of 22.8 Joules per square meter prevents crack propagation through the entire reflow temperature excursion. The delamination rate plummets to 0.04 percent, scrapping only 400 units and losing just 794 dollars in materials. Because the fracture distribution curve remains well separated from the internal thermal stress baseline, acoustic scanning scales down to standard statistical process control sampling, reducing inspection costs to 5,000 dollars.
Option C delivers a net savings of 68,686 dollars compared to Option A, and 22,968 dollars compared to Option B.
The operational arithmetic demonstrates that interfacial fracture extraction is a direct tool for cost avoidance. The cost of running environmental high-temperature fracture characterization to qualify Option C totals approximately 12,000 dollars in laboratory fixture time, specimen preparation, and analytical modeling hours. This non-recurring engineering cost recovers itself within the first quarter of production.
When sourcing packaging materials for high-reliability applications, engineering teams must evaluate fracture energy data rather than nominal leadframe quotes.
The failure to account for temperature-dependent toughness degradation during material selection results in line stoppages, uncontained field recalls, and permanent brand erosion when delaminated units escape into customer assembly lines.