Digital Interface Signal Integrity and Bus Capacitance Optimization
Optimizing bus capacitance demands matching package pin loading and trace geometry against pull-up resistance limits to guarantee rise time margins.

Pulse
Electrical wave transitions across open-drain and push-pull digital lines determine maximum attainable clock frequencies and data reliability in surface-mounted system topologies. When a driver transistor toggles from a logic high to a logic low state, it actively pulls the line to ground through an internal low-resistance channel. The transition speed depends on the driver sinking capability, which usually ranges between 3 mA for standard open-drain buses and 20 mA for high-drive interfaces.
Conversely, the transition from logic low to logic high on an open-drain bus relies on external pull-up resistors to charge the entire line capacitance. Signal distortion corrupts timing parameters.
The time constant governing the rising edge equals the product of the total bus capacitance and the pull-up resistance. Threshold levels defined by standard digital interfaces specify logic high input voltage at 0.7 times the supply voltage and logic low input voltage at 0.3 times the supply voltage. Evaluating the rise time between these two voltage thresholds yields a scaling factor of approximately 0.8473.
The rise time formula resolves directly to:
t_r = 0.8473 x R_pullup x C_bus
Interface specifications impose strict upper bounds on acceptable rise times to maintain frame integrity and prevent setup and hold time violations within peripheral ICs. Standard-Mode I2C operating at 100 kHz permits a maximum rise time of 1000 ns, Fast-Mode at 400 kHz restricts rise time to 300 ns, and Fast-Mode Plus at 1 MHz imposes a 120 ns edge limit. High-Speed Mode running at 3.4 MHz mandates active pull-up current sources or specialized transition-accelerator circuits to meet a 40 ns edge ceiling.
Excessive impedance stalls rise edges.
Electrical Edge Timing Boundaries across Operating Modes
Signal transition parameters directly restrict the physical length of interconnecting traces and the total count of connected packages on a shared interface rail. Higher frequencies enforce strict constraints.
| Interface Mode | Clock Rate | Max Rise Time (ns) | Max Bus Capacitance (pF) | Min Pull-Down Current (mA) |
|---|---|---|---|---|
| I2C Standard-Mode | 100 kHz | 1000 | 400 | 3.0 |
| I2C Fast-Mode | 400 kHz | 300 | 400 | 3.0 |
| I2C Fast-Mode Plus | 1.0 MHz | 120 | 550 | 20.0 |
| I2C High-Speed Mode | 3.4 MHz | 40 | 100 | 3.0 |
| SPI Push-Pull Standard | 25.0 MHz | 10 | 50 | 10.0 |
| I3C SDR Mode | 12.5 MHz | 12 | 50 | 10.0 |
Push-pull drivers eliminate the asymmetric rise and fall times inherent to open-drain lines by actively driving both logic transitions through low-impedance MOSFET pairs. SPI, I3C, and UART interfaces utilize push-pull topologies to achieve higher clock speeds, yet line capacitance continues to present a limiting factor. High trace capacitance paired with low driver impedance introduces high-frequency ringing, ground bounce, and overshoot during fast switching transients.
Transients exceeding the supply rail or dropping below reference ground trigger internal ESD protection diodes, injecting unwanted currents into the substrate and causing logic soft errors. Parasitic storage degrades fall times.
Fast-Mode Plus specifications limit maximum allowable bus capacitance to 550 pF at 1 MHz clock frequencies under a 3.3 V rail.
System designers calculating noise margins must compare the driver output low voltage level against the receiver input low voltage threshold. Standard CMOS logic targets a low-level noise margin equal to the difference between 0.3 VDD and 0.4 V. When heavy capacitive loads prevent the line from settling within the clock low period, the residual voltage on the line remains above receiver threshold limits. The open question remains how temperature-induced driver output impedance shifts affect this rising edge margin during continuous thermal cycling across industrial ambient ranges.
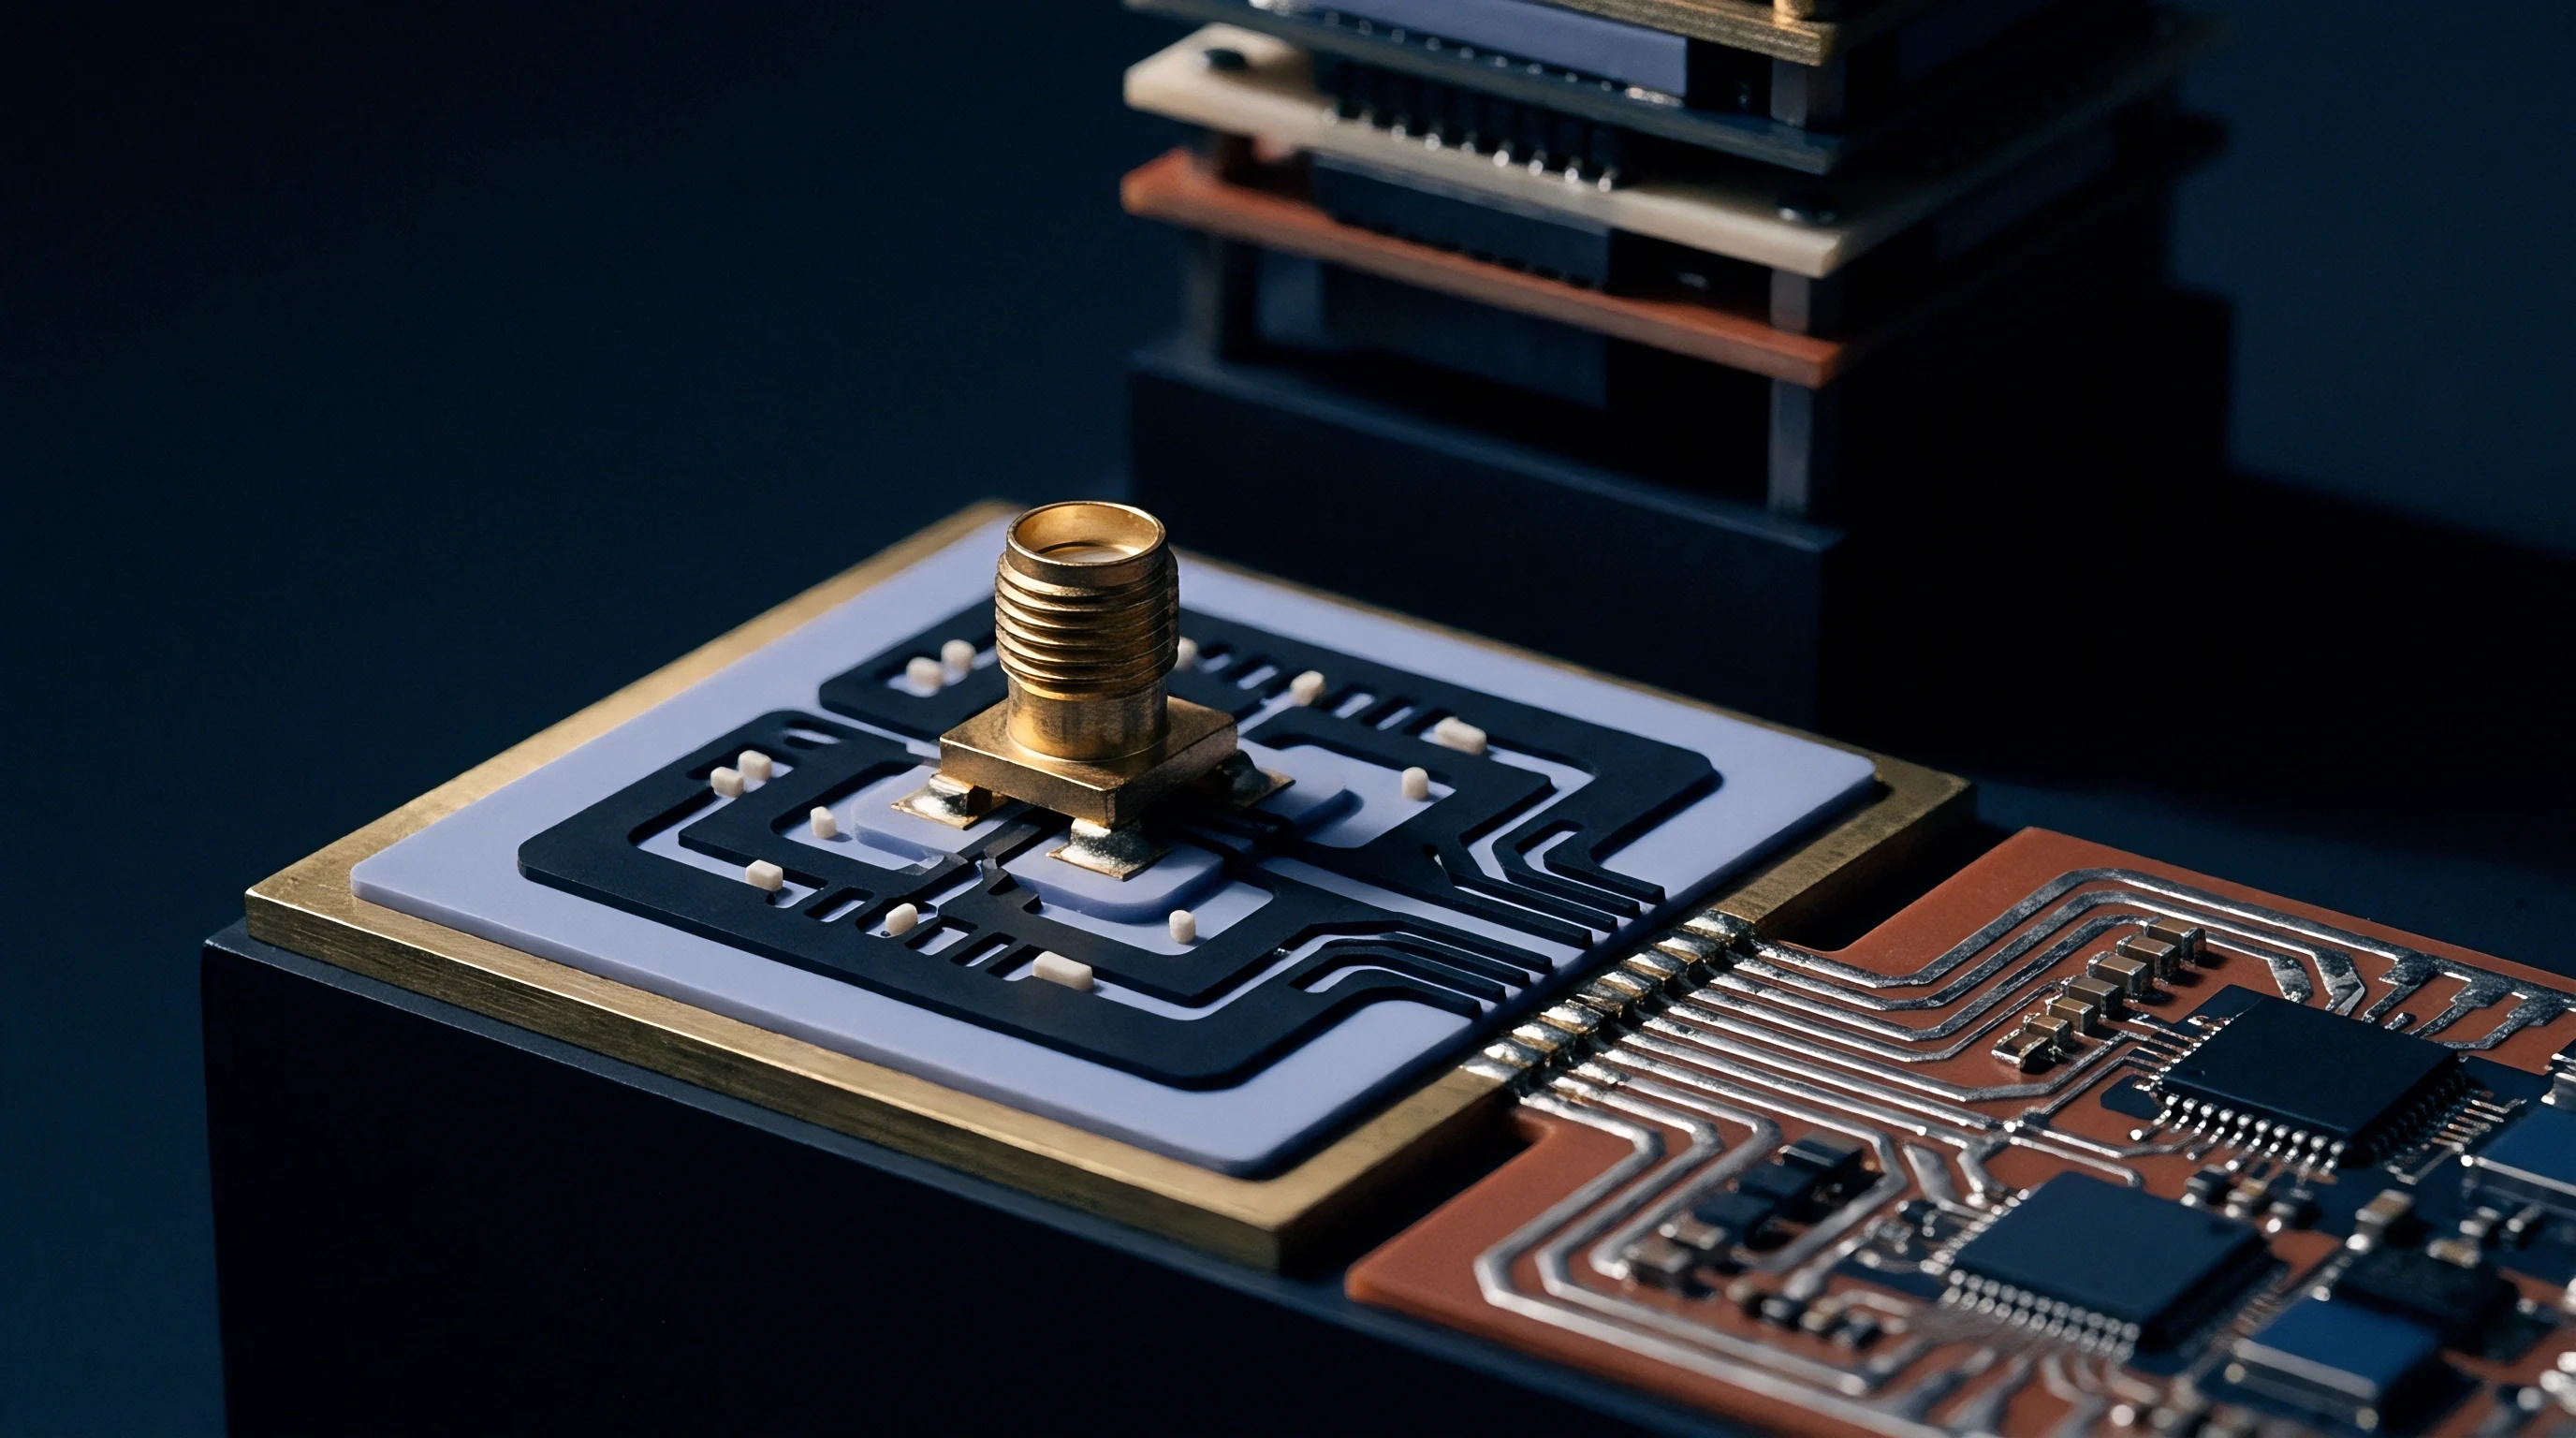
Loading
Component selection and physical footprint design directly aggregate parasitic capacitive elements across a shared digital interconnect. Total bus load consists of three distinct electrical contributors: the pin capacitance of every device tied to the line, the parasitic capacitance generated by PCB trace copper over reference planes, and stray capacitance introduced by test pads, ESD diodes, and interconnecting connectors. Minimizing cumulative parasitic accumulation preserves clock square-wave fidelity.

Package Pin Parasitics
Integrated circuit packaging contributes a baseline capacitive load that varies dramatically by physical form factor. Dual In-line Packages (DIP) and Small Outline Integrated Circuits (SOIC) feature long internal leadframes and wide leads, contributing 4.0 pF to 8.0 pF per pin. Plastic Quad Flatpack (PQFP) and Thin Shrink Small Outline Packages (TSSOP) reduce pin loading to 2.5 pF through 5.0 pF.
Modern Quad Flat No-lead (QFN) and Land Grid Array (LGA) surface-mount packages yield 1.0 pF to 2.5 pF pin capacitance due to shortened bond wires and eliminated lead legs. Wafer Level Chip Scale Packages (WLCSP) achieve minimal parasitics, averaging 0.5 pF to 1.2 pF per pin. Silicon die revision updates often alter internal pin capacitance without revising external mechanical package dimensions.
| Package Form | Typical Pin Capacitance (pF) | Board Area (mm²) | Thermal Resistance (C/W) | Reflow Sensitivity Level |
|---|---|---|---|---|
| SOIC-8 | 5.5 | 31.0 | 120 | MSL 1 |
| TSSOP-8 | 3.5 | 19.5 | 160 | MSL 1 |
| QFN-16 (3×3 mm) | 1.8 | 9.0 | 45 | MSL 3 |
| LGA-12 (2×2 mm) | 1.2 | 4.0 | 60 | MSL 3 |
| WLCSP-8 (1.5×1.0 mm) | 0.7 | 1.5 | 90 | MSL 1 |
Accumulated pin loading scales linearly with the device count on a shared bus segment. Connecting twelve TSSOP-packaged sensor ICs to a single microcontroller I2C channel contributes 42 pF of static pin load before adding printed wiring traces. Substituting WLCSP variants of the identical sensing silicon drops the static pin loading to 8.4 pF, reclaiming 33.6 pF of capacitance budget for trace extension or lower power pull-up resistor selection.
Compliance with UM10204 Section 6 specifies maximum rise times of 300 ns, forcing hardware designers to reject packages with pin capacitance exceeding 10 pF when node counts exceed eight devices.
Printed circuit board trace geometries introduce parallel-plate and fringe capacitance relative to adjacent reference planes. Trace capacitance per unit length scales with dielectric constant, trace width, and plane separation. Standard FR-4 substrates with a relative permittivity of 4.3 yield approximately 1.2 pF to 1.8 pF per inch of standard 5-mil 50-ohm microstrip trace.
Microstrip lines routed on outer layers produce lower capacitance than inner-layer striplines due to air exposure reducing the effective dielectric constant. Ground plane voids trim local capacitance.
Placing discrete TVS ESD protection arrays on peripheral connectors adds discrete capacitance to signal lines. Standard ESD diodes present 10 pF to 30 pF of junction capacitance, which severely degrades fast switching edges. Ultra-low capacitance ESD suppressors designed for digital signal integrity limit junction parasitics to 0.2 pF through 0.5 pF.
Selecting general-purpose ESD arrays instead of specialized RF/digital suppressors rapidly consumes the entire allowable bus load budget.
A safe operational design principle reserves forty percent of total bus capacitance margin for unexpected manufacturing tolerances and component lot variance.
Termination
Impedance matching and passive pull-up component selection establish the static DC power dissipation and dynamic timing capabilities of a digital interface segment. Passive open-drain configurations require pull-up resistors sized within a rigid operational window bounded by minimum current sinking limits and maximum allowed edge rise times. Sizing resistor values incorrectly either overloads internal driver transistors or introduces pulse width distortion that renders the bus unreadable.
Calculating Pull-Up Boundaries
The lower resistance limit protects open-drain driver transistors from excessive current stress during logic low output assertions. Driver output stages guarantee a maximum low-level output voltage V_OL of 0.4 V while sinking a specific current I_OL. For standard 3.3 V logic with I_OL equal to 3 mA, the absolute minimum pull-up resistance calculation follows Ohm’s law:
R_min = (V_DD – V_OL) / I_OL = (3.3 V – 0.4 V) / 0.003 A = 966.7 ohms
Selecting a pull-up resistor below 967 ohms forces the driver to sink current beyond its rated spec, elevating V_OL above the 0.4 V limit and eroding logic low noise margins. Drivers operating on Fast-Mode Plus buses support 20 mA sink capability, lowering R_min to 145 ohms under a 3.3 V rail. Driver strength limits pull-down speed.
The upper resistance limit ensures the RC time constant permits signal transition to logic high within the mandated rise time window. Rearranging the rise time equation determines the maximum allowable resistance for a given bus load:
R_max = t_r / (0.8473 x C_bus)
On a Fast-Mode bus running at 400 kHz with a measured total line load of 250 pF and a maximum rise time allowance of 300 ns, R_max resolves to:
R_max = 300 x 10^-9 s / (0.8473 x 250 x 10^-12 F) = 1416 ohms
Designers selecting standard 1% surface-mount resistor values must specify a 1.3 kohm component to satisfy both boundaries. When bus load increases to 380 pF, R_max drops to 932 ohms, creating an impossible design condition where R_max sits below R_min. Resolving this conflict demands active acceleration or bus segmentation.
| Bus Load (pF) | I2C Mode | Passive R_max (ohms) | Passive R_min (ohms) | Active Accelerator Transition Time (ns) |
|---|---|---|---|---|
| 100 | Fast-Mode (400 kHz) | 3540 | 967 | 18 |
| 200 | Fast-Mode (400 kHz) | 1770 | 967 | 22 |
| 300 | Fast-Mode (400 kHz) | 1180 | 967 | 28 |
| 400 | Fast-Mode Plus (1 MHz) | 542 | 145 | 35 |
| 500 | Fast-Mode Plus (1 MHz) | 433 | 145 | 42 |
Active pull-up circuitry overcomes passive resistor limits by replacing or augmenting discrete pull-up resistors with switched current sources. Active accelerators monitor line voltage during rising transitions. When the voltage slew rate exceeds an internal trigger threshold, the IC turns on low-impedance internal MOSFETs to inject heavy charging currents (typically 2 mA to 10 mA) directly into the bus.
Active terminators inject current rapidly. Once the line voltage reaches logic high threshold, the accelerator switches off, allowing a weak passive resistor to maintain steady-state high levels without drawing continuous power.
Reducing series damping resistor values increases edge overshoot while widening noise margin gaps across ungrounded board transitions.
High-speed push-pull lines such as SPI clock and data lines utilize series damping resistors positioned directly at the driver output pads. These series resistors align driver output impedance with the characteristic impedance of the PCB trace, absorbing high-frequency reflections. Typical series resistor values range between 22 ohms and 47 ohms.
Trace geometry dictates line impedance.
High-Density Interface Integrity Degradation Modes
Ignoring capacitive loading and drive strength limitations during system layout introduces distinct signal corruption phenomena across operating states.
- Edge Rounding Distortion slows rising edge transitions past defined logic setup times, inducing bit corruption and slave device frame timeouts.
- Spurious Clock Glitches occur when fast signal transitions on adjacent data lines couple capacitively into high-impedance clock traces, triggering unintentional register increments.
- Ground Bounce Transients elevate local substrate reference voltages during simultaneous low assertion across multiple high-drive outputs, inducing false logic transitions.
- Reflective Ringing Waves arise from unmatched trace termination, causing line voltage to swing outside rail limits and triggering input protection clamping.
- Bus Hold Stalling develops when excessive series resistance prevents active pull-down transistors from discharging line voltage below V_IL limits.
Inadequate termination design yields unreliable field performance, leading to elevated packet drop rates, system lockups, and unrecoverable interface bus hangs.
Routing
Physical trace layout on multilayer printed circuit boards dictates the final parasitic load and coupling vulnerability of high-speed digital buses. Trace clearance, dielectric height, and reference plane integrity establish the distributed capacitance and inductance experienced by propagating signals. Layout strategies must minimize trace length while maximizing distance to non-referenced copper structures.
How Does Parasitic Clearance Reduce Trace Capacitance?
Expanding spatial isolation between adjacent copper conductors diminishes mutual capacitance and cross-talk coupling. Standard PCB layout guidelines recommend a minimum trace-to-trace clearance equal to three times the trace width, known as the 3W rule. Implementing the 3W rule reduces fringing electric field coupling between signal lines by over seventy percent compared to minimum trace spacing.
High-speed SPI clock lines running parallel to sensitive analog traces require a 5W separation boundary to eliminate capacitive crosstalk entirely.
Engineers reduce trace capacitance directly to ground planes by removing copper on immediate underlying layers, creating ground plane voids beneath surface-mount land patterns. Component solder pads for 0402 passive parts and SMT IC packages generate localized parallel-plate capacitance due to enlarged copper surface areas. Etching a ground clearance window beneath component pads drops pad capacitance by 0.4 pF to 1.2 pF per pin landing.
This plane voiding technique must maintain reference continuity on lower adjacent layers to prevent unshielded signal radiation.
Trace capacitance scales directly with substrate dielectric constant and ground plane proximity.
Vias used for layer transitions contribute localized parasitic inductance and capacitance. A standard 1.6 mm thick PCB via with a 10-mil drill hole and 20-mil pad adds approximately 0.5 pF to 1.0 pF of stray capacitance and 1.2 nH of series inductance. Signal routes switching layers multiple times accumulate via parasitics that alter line characteristic impedance.
Unused stub lengths on blind or buried vias act as open transmission lines, generating high-frequency resonant reflections. Via stubs act as open transmission lines.
Automotive sensor applications often extend digital buses across off-board wire harnesses, increasing system capacitance by 30 pF to 100 pF per meter of cabling. This wire harness load dwarfs on-board trace capacitance, demanding differential conversion or active buffer insertion at PCB connectors.
Substrate material selection influences parasitic capacitance per unit length. Standard FR-4 glass-epoxy materials exhibit a relative dielectric constant (D_k) of 4.2 to 4.5 at 1 GHz. Advanced high-frequency substrates such as Rogers RO4003C or Isola FR408HR provide lower D_k values ranging from 3.3 to 3.7.
Using low-dielectric materials decreases trace-to-plane capacitance by up to twenty percent for identical copper geometries, broadening the physical layout routing window on high-density assemblies. Board fabricators frequently substitute high-D_k core materials without customer notification when stack-up dielectric thickness is specified without an explicit material dielectric property callout.
Topology
Architectural arrangements of interconnecting bus nodes govern signal reflection characteristics, total cumulative capacitance, and address resolution limits. Branching structures, multi-drop lines, and star topologies exhibit distinct impedance profiles that mandate targeted physical and electrical isolation strategies. Selecting the appropriate topological layout isolates bus capacitance while preserving operational bandwidth.
Bus Architecture Comparison
Point-to-point connections present minimal parasitic loading, restricting traces to a single driver and receiver pair. Multi-drop topologies chain multiple device loads along a continuous physical trunk line, accumulating pin capacitance and trace parasitics across every added node. Star topologies branch signal lines outwards from a central host controller to multiple peripheral endpoints, creating severe impedance mismatches at the central junction.
Reflections from open-ended star branches collide at the central node, causing destructive interference and invalidating edge threshold timing.
| Topology Configuration | Max Node Count | Capacitance Isolation | Signal Integrity Profile | Routing Complexity |
|---|---|---|---|---|
| Point-to-Point | 2 | Complete | Optimal high-speed switching | Low |
| Daisy-Chain Trunk | 12 – 32 | None (Cumulative) | Good with end termination | Moderate |
| Unbuffered Star | 4 – 8 | None (Cumulative) | Poor due to junction reflections | High |
| Multiplexed Branches | 64+ | Branch Isolated | Excellent per selected segment | Moderate |
| Buffered Bus Split | 32+ | Bidirectionally Isolated | Controlled per isolated domain | High |
Isolating heavy capacitive loads demands active physical segmentation using bidirectional bus buffers, multiplexers, or switches. An I2C multiplexer IC, such as the PCA9548A, splits an incoming bus segment into eight independent downstream channels. Channel isolation disconnects non-active branches, presenting only the active channel’s pin and trace capacitance to the host controller.
Buffer insertion divides physical channels. Selecting a multiplexer isolates downstream device address collisions while maintaining bus load within specified operating limits.
Bidirectional bus buffers (such as the PCA9515A or ISO1540 galvanic isolators) connect two distinct capacitive domains using internal voltage-level translation and current amplification circuitry. The buffer presents a single device pin load (typically 6 pF) to the primary bus while driving an independent secondary bus segment loaded up to 400 pF. Bidirectional buffers utilize offset voltage mechanisms to prevent latch-up conditions, where an output low voltage generated by side A does not re-trigger side A inputs.
Offset logic low levels sit slightly higher (typically 0.52 V) than standard driver low levels, reducing receiver low noise margins on connected sub-buses.
Bus Bring-Up and Capacitance Debug Sequence
Bringing up a heavily loaded multi-node digital bus requires a systematic verification process to detect capacitive signal degradation and address collisions before committing to production firmware.
- Confirm baseline DC voltage levels on clock and data lines while the host controller holds lines in an idle high state.
- Measure static pull-up resistance values using a precision multimeter with power removed to verify equivalent network resistance.
- Capture clock and data rising edges on an oscilloscope with at least 500 MHz bandwidth and low-capacitance active probes (< 1 pF probe load).
- Calculate actual bus capacitance by measuring 10% to 90% edge rise times and applying the inverse timing constant equation.
- Inject full-speed read commands to peripheral devices while monitoring for clock stretching assertions or missing acknowledgment bits.
- Verify logical low voltage levels under full sinking load to confirm signal margins stay below 0.3 VDD limits across all temperature extremes.
Executing this sequence exposes marginal timing conditions before field deployment. Standard compliance frameworks demand documentable proof that signal setup and hold margins maintain a minimum twenty percent timing window under worst-case thermal and voltage operational corners.

Expenditure
Engineering decisions balancing component counts, PCB stack-up complexity, and active signal conditioning devices directly drive landed bill-of-materials costs and manufacturing yields. Resolving bus capacitance challenges through hardware additions increases unit pricing, whereas optimizing trace layout requires additional engineering design hours. Quantifying trade-offs between physical board real estate, silicon package variants, and active termination ICs establishes the minimum total cost of ownership for a electronic product.
Make-or-Buy Interface Optimization Economics
Addressing signal degradation on an over-capacitive bus allows for multiple competing engineering approaches, each carrying distinct unit costs and layout implications. Board area incurs direct assembly cost. Silicon area drives unit pricing.
Hardware teams face three primary implementation paths when expanding node counts on a legacy 3.3 V interface:
Path A retains passive pull-up resistors, adding two active transition-accelerator ICs to boost edge slew rates across heavy capacitive loads. This path incurs a unit component cost of $0.45 per accelerator IC in 10,000-unit volumes, adding $0.90 to the BOM while preserving existing low-cost SOIC peripheral sensor packages.
Path B replaces standard SOIC and TSSOP peripheral sensors with advanced WLCSP footprint variants. WLCSP packages reduce pin capacitance by over sixty percent, eliminating the need for active pull-up acceleration. However, WLCSP silicon variants command a 12% to 18% unit price premium over standard QFN/SOIC packages due to specialized redistribution layer processing and low-yield test handling.
On an assembly containing eight sensors priced at $1.20 baseline, the package premium adds $1.44 to unit BOM costs. Furthermore, WLCSP adoption mandates upgrading PCB manufacturing from standard 4-mil laser-drilled vias to high-density interconnect (HDI) microvia stack-ups, increasing bare-board fabrication costs by 25% across all production volumes.
Path C incorporates a dedicated I2C multiplexer IC to segment the bus into four discrete lower-capacitance domains. The multiplexer IC costs $0.32 in volume, requiring 12 mm² of additional PCB routing footprint and two additional decoupling capacitors costing $0.03 total. Path C adds $0.35 to unit BOM costs while requiring three days of firmware development time to manage multiplexer channel switching logic within host driver stacks.
Shorter traces minimize parasitic storage.
| Remediation Strategy | Added Unit BOM Cost ($) | PCB Cost Impact | Firmware Impact | Tooling / NRE Impact |
|---|---|---|---|---|
| Path A: Active Accelerators | 0.90 | Negligible (< 5 mm²) | Zero modification | None |
| Path B: WLCSP Package Migration | 1.44 | +25% (HDI Board Upgrade) | Zero modification | High (Land pattern redraw + stencil) |
| Path C: Active Bus Multiplexing | 0.35 | Minor (+12 mm² footprint) | 3 Firmware Days | Low (Driver software updates) |
An evaluation of interface component selection parameters requires analyzing physical and operational trade-offs early in the design cycle.
- Cumulative pin capacitance totals across all proposed silicon node packages.
- Maximum operational clock frequency mandated by system throughput requirements.
- Physical trace length and layer stack-up dielectric constant specifications.
- Direct unit price differentials between standard and ultra-low parasitic component packages.
- Non-recurring engineering costs associated with firmware driver revisions for active bus switches.
- Manufacturing yield loss risks stemming from tight timing margins on high-speed lines.
Selecting Path C yields the lowest landed manufacturing cost for high-volume production runs exceeding 50,000 units annually. The initial software engineering outlay amortizes rapidly across volume production, whereas Path B PCB fabrication premiums impose perpetual margin degradation on every manufactured board. Early integration of capacitance budgeting within the hardware design lifecycle prevents late-stage board spins, protecting production schedules and baseline product profitability.