Calculating Surface Strain Fields on Circuit Assemblies during Bending
Calculate surface strain fields using triaxial rosettes and Mohr circle transformations to keep assembly principal strains within IPC-9704 strain-rate limits.
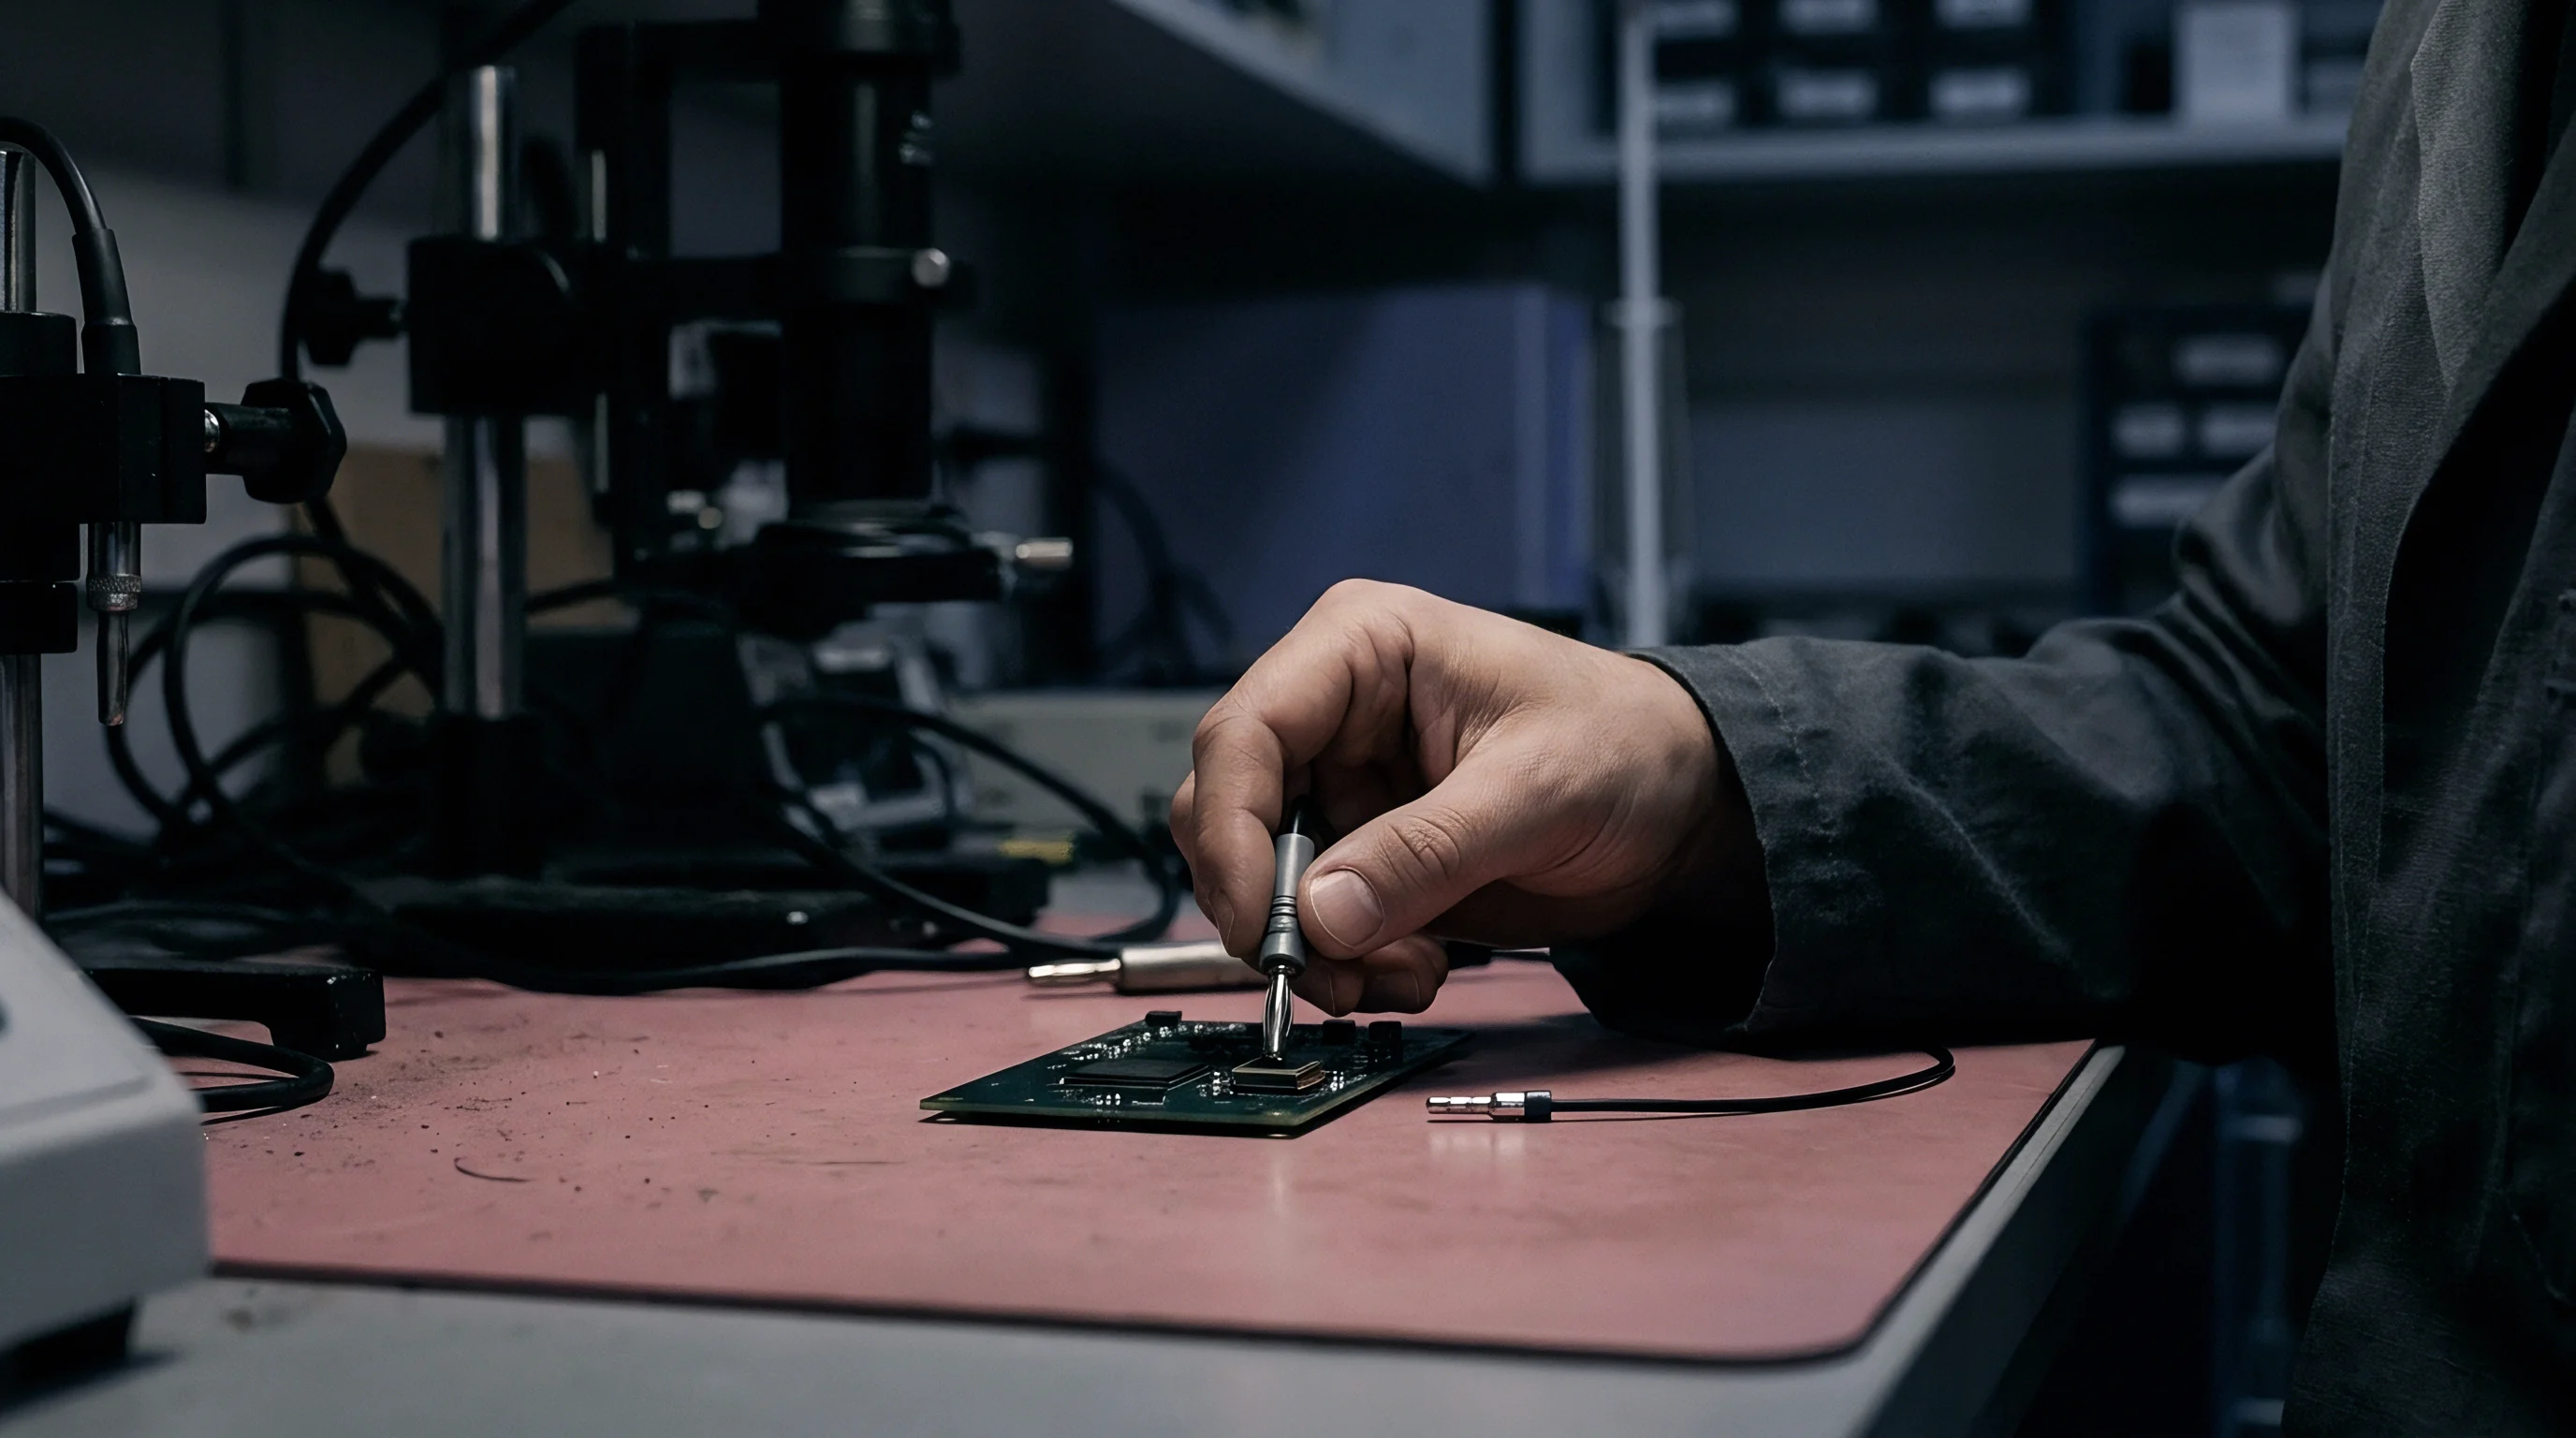

Rosette
Board flexure translates into interconnect shear, pad cratering, and capacitor fracture during in-circuit testing, daughtercard insertion, and chassis assembly. Quantifying the actual surface strain field requires planar strain rosette analysis right at component land patterns rather than single-axis approximations. Solder joints under fine-pitch BGAs and multilayer ceramic capacitors fail when local tensile strain exceeds laminate adhesion thresholds.
Resolving surface strain calculates the principal strains and strain rates that drive operational risk.
Measuring surface strain on circuit card assemblies relies on triaxial foil rosettes in 0° ~ 45° ~ 90° rectangular or 60° delta configurations. A single-axis gauge records elongation only along its own grid axis, missing transverse strains and shear across the resin-glass matrix. The full two-dimensional strain tensor accounts for x-axis normal strain, y-axis normal strain, and in-plane engineering shear.
Extracting these tensor values from three separate gauge grids requires solving the transformation equations derived from planar strain mechanics.
IPC-JEDEC-9704 defines mechanical test boundaries across four-point bending and assembly fixtures to protect ball grid array solder joints from microcracking.
Triaxial rosettes convert discrete axial measurements into global strain tensors. For a rectangular rosette with grids at 0, 45, and 90 degrees relative to a reference axis, the strain transformation equations follow directly from Mohr circle geometry:
The normal strain along the primary x-axis matches the first gauge grid reading:
e_x = e_1
The normal strain along the transverse y-axis matches the third gauge grid reading:
e_y = e_3
Engineering shear strain across the xy-plane combines all three grid readings to eliminate directional ambiguity:
gamma_xy = 2 e_2 – (e_1 + e_3)
These transformation equations convert resistance changes into principal strain values. Maximum principal strain marks the peak tensile state on the surface matrix, which drives brittle fracture in ceramic dielectrics and trace necks. Minimum principal strain captures compressive deformation, indicating local buckling or compressive pad shear under surface-mount terminations.
These principal states are calculated as:
e_max = (e_x + e_y) / 2 + sqrt(((e_x – e_y) / 2)^2 + (gamma_xy / 2)^2)
e_min = (e_x + e_y) / 2 – sqrt(((e_x – e_y) / 2)^2 + (gamma_xy / 2)^2)
The principal angle gives the offset between the gauge reference axis and the direction of maximum tension:
theta = 0.5 atan2(gamma_xy, e_x – e_y)
Isotropic constitutive equations yield the biaxial stress field from these strains. While copper foils and laminate resin create local orthotropy, standard qualification routines estimate equivalent isotropic surface stress by pairing principal strains with the effective in-plane modulus and Poisson ratio of the cured dielectric. Rosettes measure deformation on the outer resin layer, providing a practical proxy for strain transferred through solder joints and pads.
When the primary strain direction across a panel is unknown, test coupons use delta rosettes with elements set at 0, 60, and 120 degrees. The transformation solves the same 2D tensor while spreading angular sensitivity evenly across all directions:
e_x = e_1
e_y = (2 e_2 + 2 e_3 – e_1) / 3
gamma_xy = 2 (e_2 – e_3) / sqrt(3)
As a general rule, maximum principal strain dictates tensile pad cratering, while shear strain governs solder joint fatigue under cyclic twisting.
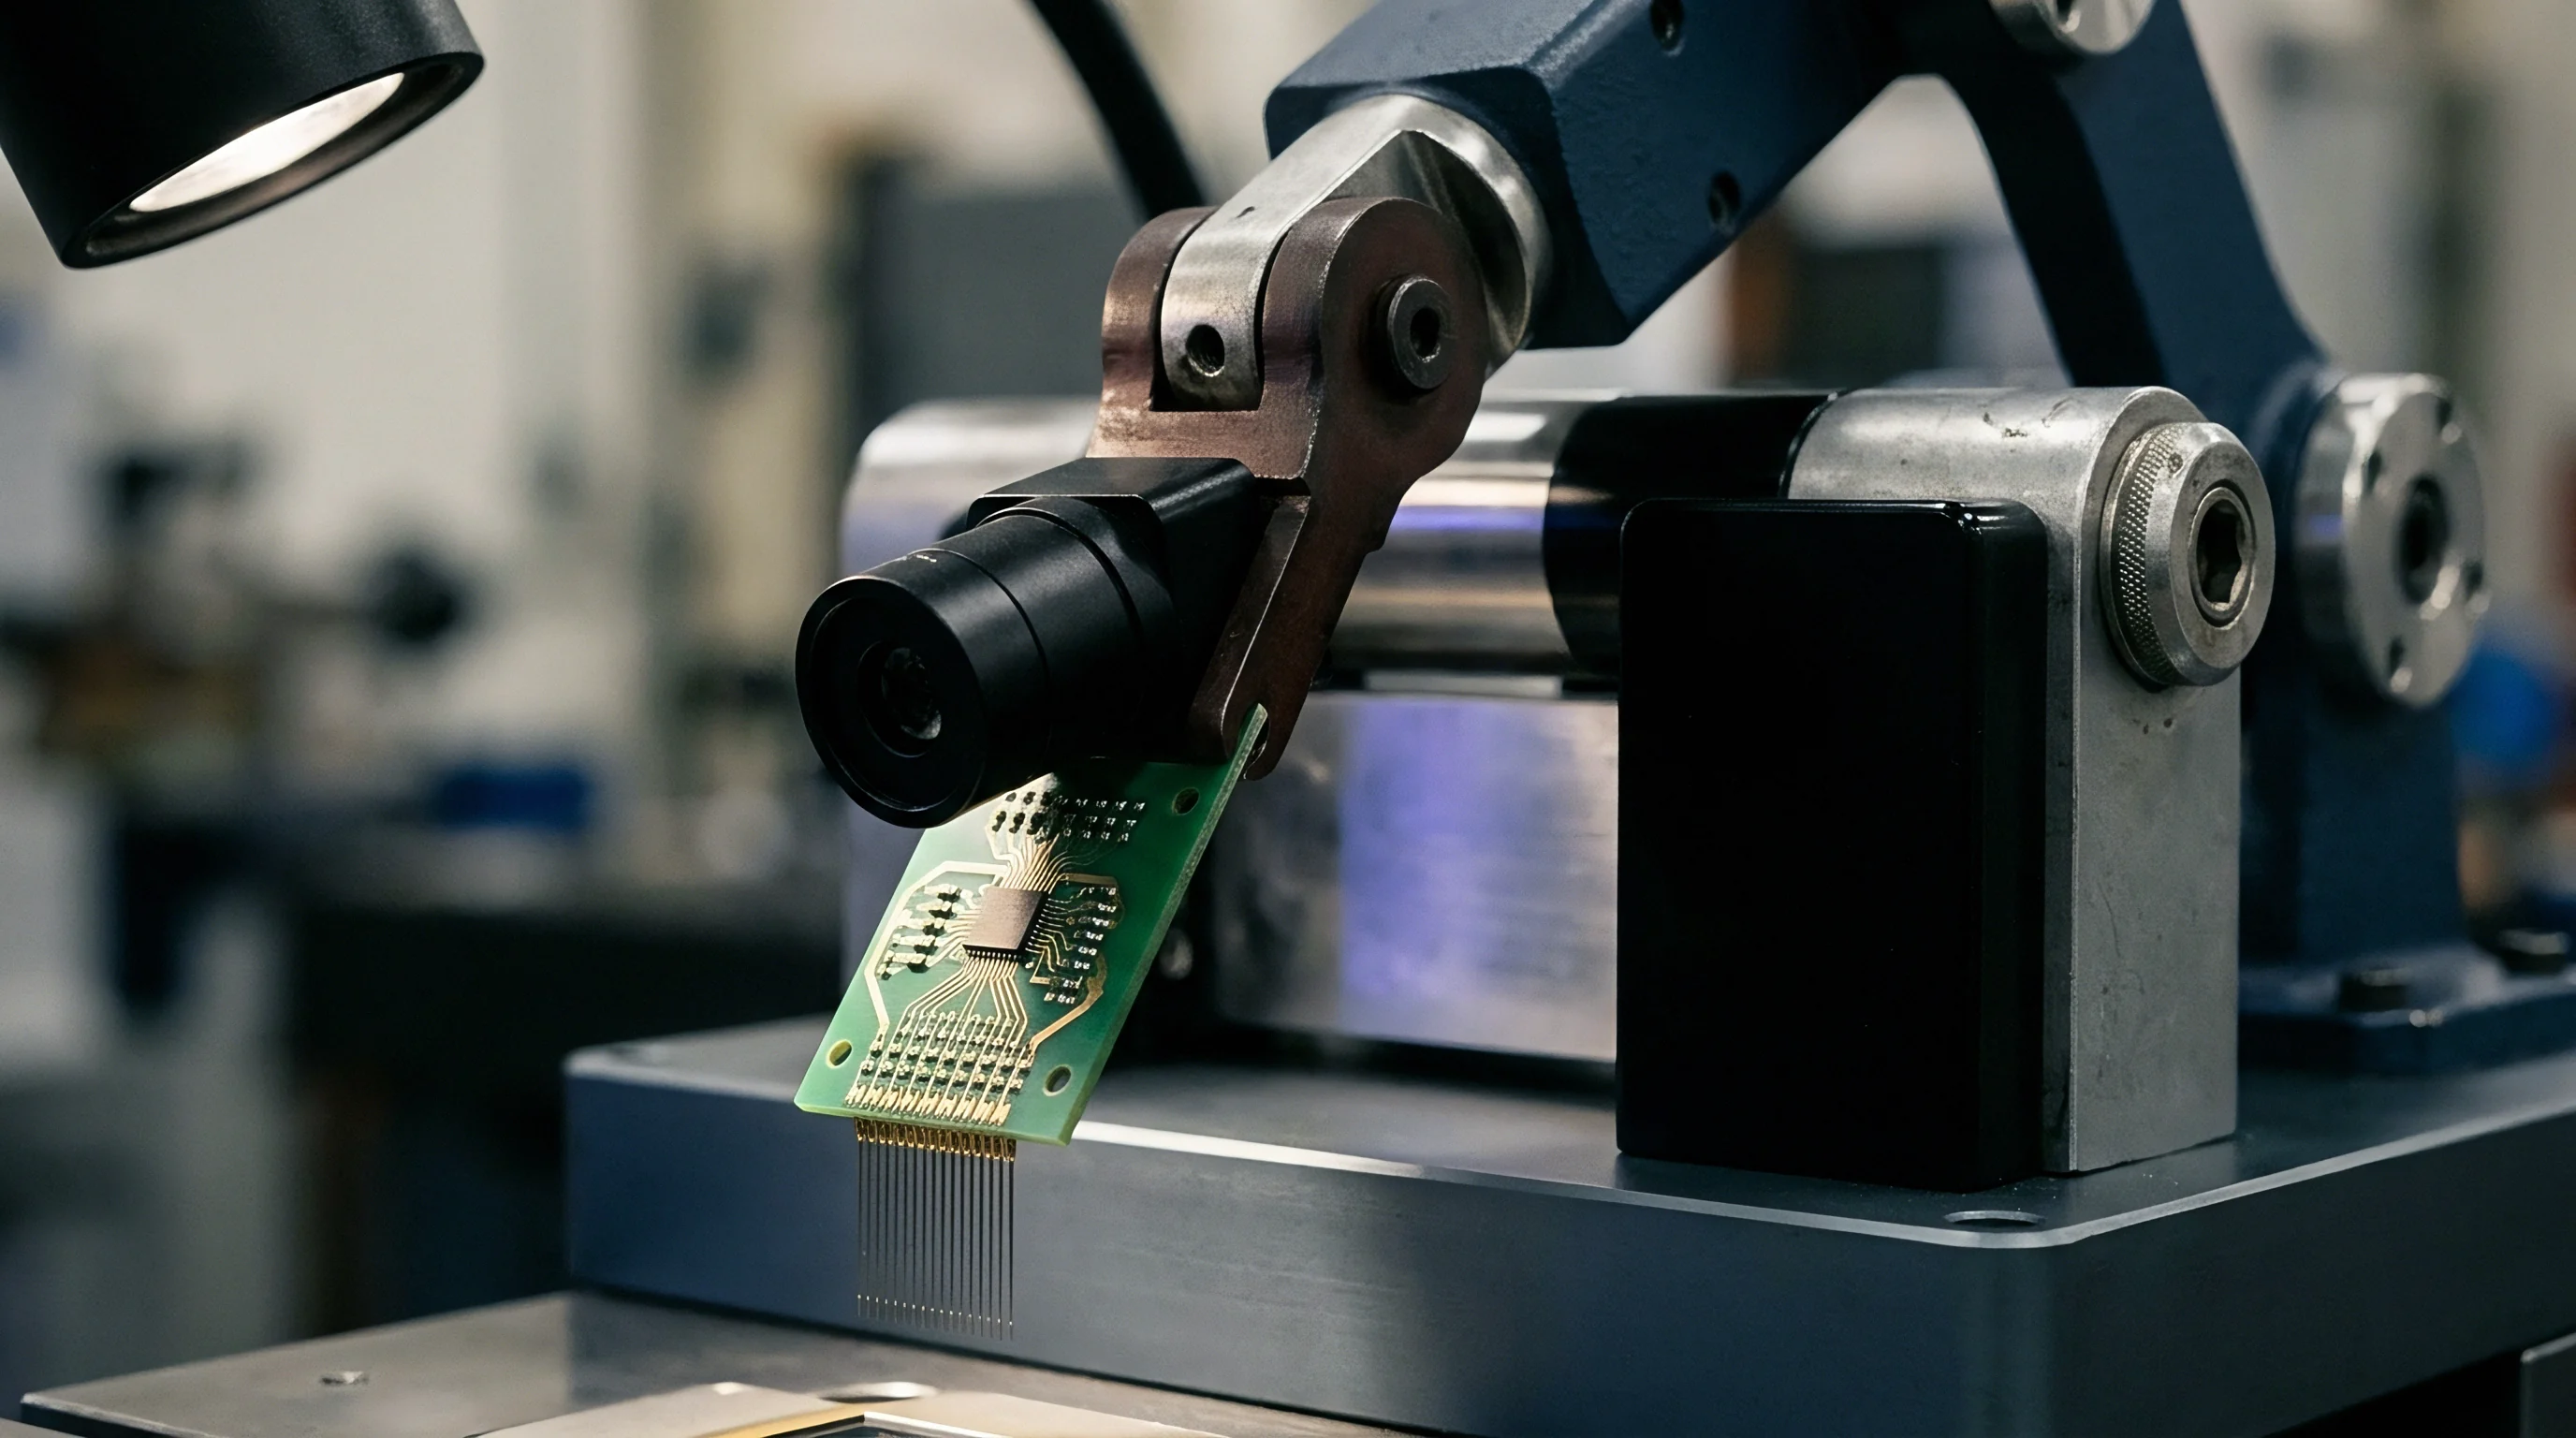
Flexure
Circuit assemblies face bending loads at several manufacturing steps: SMT placement, second-side reflow cooling, panel routing, ICT bed-of-nails engagement, chassis integration, and screw torquing. Plate bending mechanics dictate local strain on the outer copper layer. Under transverse loading, surface strain on an unsupported board depends on plate thickness, support span, fixture constraints, and local flexural stiffness.
Classical plate theory makes surface bending strain proportional to distance from the neutral axis. For a balanced, symmetric multilayer stack of thickness h bent to radius R, surface strain follows a simple curvature relation:
e_surface = h / (2 R)
Asymmetrical copper distribution shifts the neutral axis toward heavier plane layers, increasing surface strain on the sparser outer face. On an 8-layer, 1.60 mm board with solid power planes clustered on layers 5 and 6, the neutral axis can shift up to 0.12 mm off the geometric midplane. The outer face furthest from that copper mass then sees higher strain for a given board deflection.
Soldered stiff components alter the local bend radius even more sharply.
Package bodies and solder fillets act as localized stiffeners, turning smooth panel curvature into sharp strain concentrations at outer solder pads. Under point loading, the unpopulated board flexes while the area beneath a rigid land grid array stays flat. That abrupt change concentrates strain at corner solder joints.
Strain gauges placed near component perimeters pick up these elevated strains right in the transition zone where the board emerges from under the package.
Strain Rates in Dynamic Processing
Calculating dynamic strain rates is vital for setting strain limits during fast operations. Quasi-static deflection limits miss solder fractures caused by rapid mechanical events like punch depaneling or pneumatic fixture closure. Lead-free SAC305 and SAC400 alloys are highly strain-rate sensitive: higher rates raise yield strength but drastically cut plastic elongation, promoting brittle interfacial fracture along the intermetallic layer.
Strain rates are derived from discrete time-series measurements. Taking the central difference of maximum principal strain over successive sample intervals gives the instantaneous strain rate:
de_max / dt = (e_max(t + dt) – e_max(t – dt)) / (2 dt)
IPC-JEDEC-9704 defines maximum allowable strain as an inverse power function of strain rate. At quasi-static rates under 1000 microstrain per second, standard FR-4 assemblies can tolerate up to 1200 microstrain without risking pad lift. At dynamic rates over 100,000 microstrain per second, allowable principal strain drops below 400 microstrain on the same footprint.
Data acquisition systems need sampling rates between 10 kHz and 50 kHz to capture transient strain spikes without filtering out fast fracture triggers.
| Strain Rate (microstrain/s) | Max Principal Strain (microstrain) | Critical Failure Mode | Process Vulnerability |
|---|---|---|---|
| 10 to 1,000 | 1,200 | Bulk Solder Plastic Shear | Manual Secondary Assembly |
| 1,000 to 10,000 | 850 | Intermetallic Microcracking | In-Circuit Test Fixture Closure |
| 10,000 to 100,000 | 550 | Pad Cratering Beneath Resin | Router Bit Depaneling |
| 100,000 to 1,000,000 | 380 | Trace Neck Rupture | Pneumatic Connector Press-Fit |
Yields drop sharply when process steps are evaluated using static displacement metrics rather than instantaneous multi-axis strain fields across the board surface.
Gauge
Installing a physical strain gauge introduces mechanical and geometric constraints that bias measured surface strain. A foil gauge averages strain across its active sensing area rather than reading a single point. Near chip-scale packages or fine-pitch BGAs, strain gradients decay rapidly over less than 2.0 mm.
Choosing gauge size is therefore a direct trade-off between signal-to-noise ratio and spatial resolution.
Gauge Selection and Placement Geometries
Grid length determines measurement accuracy in high-gradient regions. A 0.38 mm active grid captures peak strain at a package footprint perimeter with minimal spatial averaging. A 1.50 mm or 3.00 mm grid smooths out the peak by averaging over the lower-strain laminate nearby.
On 0.8 mm pitch packages, gauges over 1.0 mm in active length underestimate peak land-pattern strain by 15 to 40 percent.
IPC-9704 specifies placing the center of the rosette grid 1.00 mm ± 0.10 mm from the package edge, aligned with the corner solder joint. Moving closer risks mechanical interference with standoffs and glue fillets; moving further away captures far-field board flexure rather than local footprint strain concentration. Transverse alignment errors must stay under 0.25 mm to preserve principal angle accuracy.
- Grid Center Offset keeps the distance from package perimeter to active grid center within 0.90 mm to 1.10 mm.
- Active Pattern Dimension limits grid length to 0.80 mm maximum to prevent spatial averaging across sharp strain gradients.
- Adhesive Layer Thickness keeps structural cyanoacrylate or epoxy bondlines below 0.015 mm to minimize shear lag through the glue.
- Leadwire Strain Decoupling anchors leadwires to the board using stress-relief loops at least 5.0 mm from active sensing grids.
A cyanoacrylate bondline exceeding 0.025 mm thickness attenuates calculated peak strain by introducing compliance into the measurement interface.
Wheatstone Bridge Circuitry and Cable Mechanics
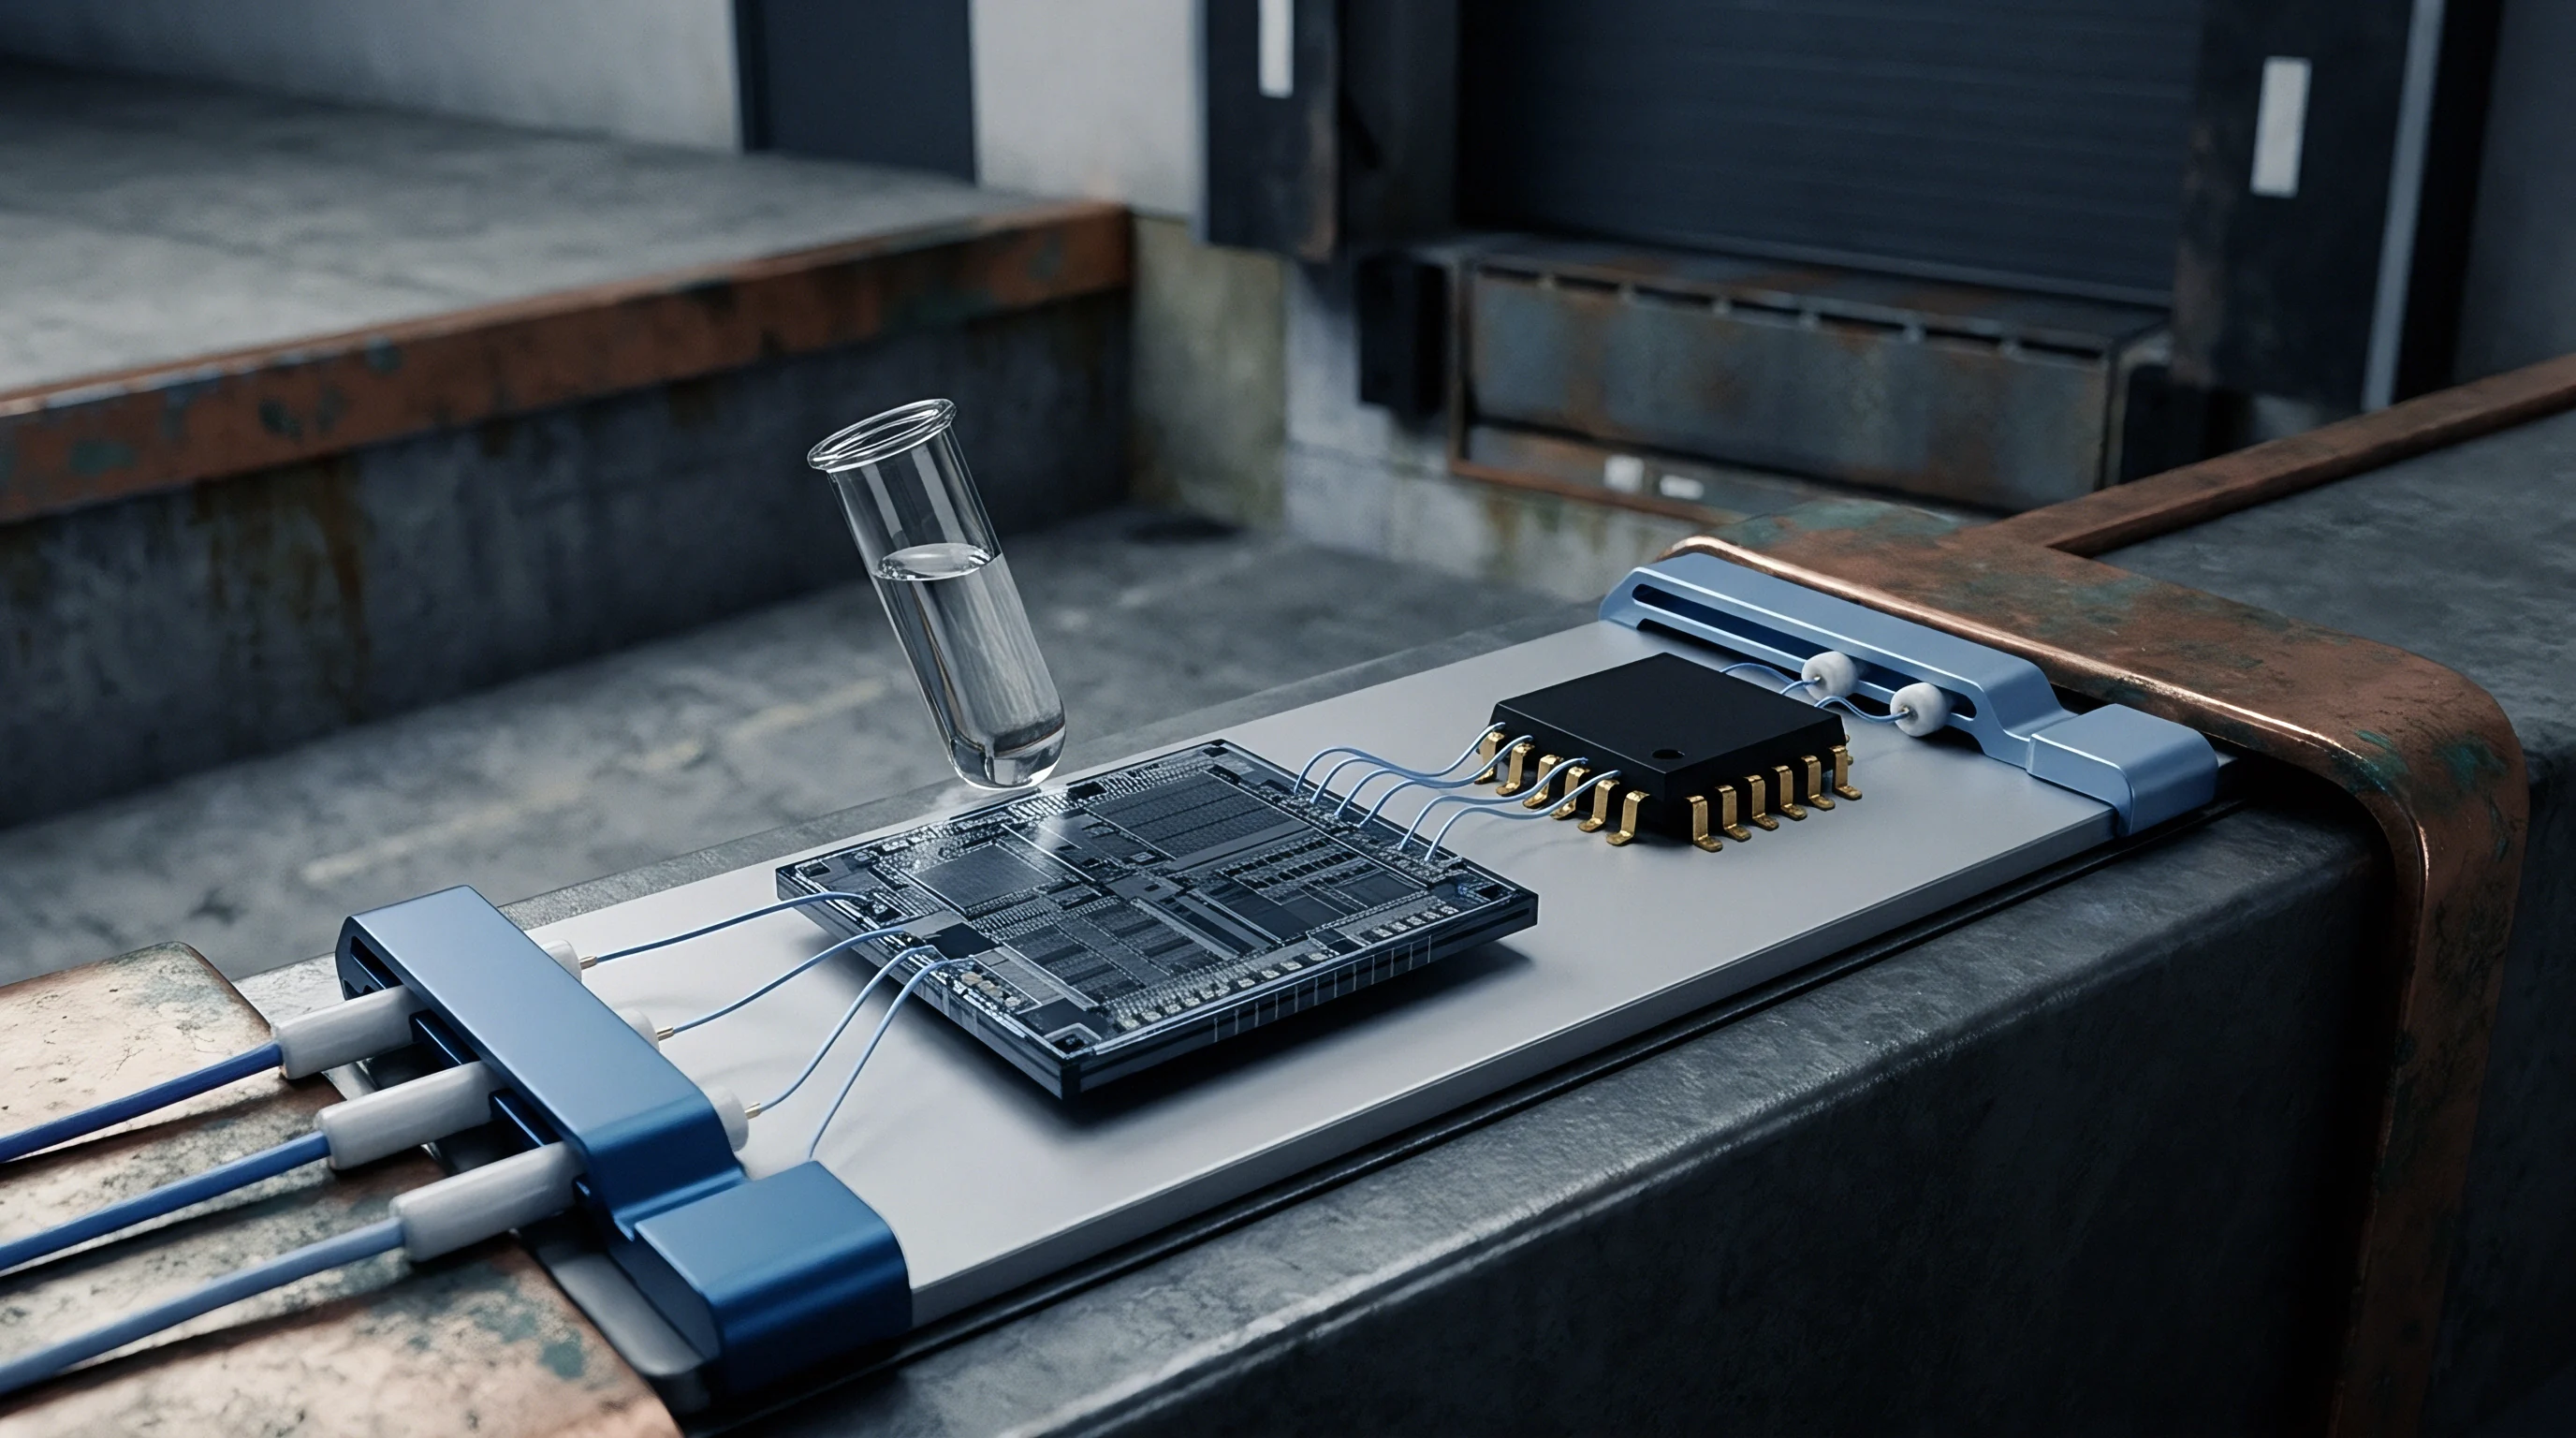
Calculating strain relies on converting fractional resistance changes into voltage signals through a Wheatstone bridge. Foil rosettes for circuit board testing typically use 120-ohm or 350-ohm nominal resistance. The higher 350-ohm grid reduces self-heating in the resin matrix, preventing thermal offset drift during test runs.
Three-wire quarter-bridge circuits cancel out leadwire resistance shifts caused by temperature swings along long cable runs to environmental chambers.
Quarter-bridge output voltage relates to grid strain based on excitation voltage and gauge factor:
V_out / V_in = (GF e) / (4 + 2 GF e)
The gauge factor GF measures grid sensitivity, typically ranging from 2.00 to 2.15 for constantan foils. Higher excitation voltages boost signal level but increase localized heating. On thin laminates under 1.0 mm, excitation voltage should stay below 2.0 V RMS so local heating doesn’t drive board temperatures above the resin glass transition point.
Transverse sensitivity introduces errors into multi-axis strain calculations if uncorrected. Manufacturers specify a transverse sensitivity factor Kt reflecting grid sensitivity to strain perpendicular to its main axis. Foil rosettes typically show Kt values between 0.005 and 0.035.
Correcting for transverse sensitivity adjusts the measured strains via standard formulas:
e_true_1 = (e_meas_1 (1 – nu_0 Kt) – Kt e_meas_3 (1 – nu_0 Kt)) / (1 – Kt^2)
The variable nu_0 is the Poisson ratio used during factory calibration, usually 0.285. Skipping this correction can shift calculated principal angles by up to 8 degrees and alter peak tensile strain values by up to 6 percent in torsional bending.
Standard gauge factor calibration covers nominal circuit card testing without specialized leadwire compensation.


Arithmetic
Converting bridge voltage measurements into mechanical strain requires a defined sequence: bridge linearization, thermal drift correction, transverse sensitivity adjustment, and coordinate rotation to calculate principal strains. Modern acquisition software handles this automatically, but working through the math reveals how errors propagate through coordinate transformations.
Stepwise Tensor Derivation Workflow
The calculation sequence converts raw voltage ratios from an ADC or digital multimeter into strain metrics in five steps:
- Convert calibrated bridge voltage ratios into raw apparent strain using bridge offsets and manufacturer gauge factors.
- Apply transverse sensitivity factors to raw grid strains using calibration coefficients to resolve true axial strain.
- Assemble the planar strain tensor matrix by calculating normal x-strain, normal y-strain, and shear strain from corrected grid values.
- Determine maximum principal strain, minimum principal strain, and principal angle by solving the planar tensor characteristic equation.
- Calculate instantaneous strain rates by differentiating successive principal strain values against hardware timestamps.
Consider an assembly subjected to an in-circuit test fixture cycle with a triaxial 0-45-90 rectangular rosette bonded adjacent to a 35 mm ball grid array corner. The instrumentation returns the following stabilized readings during full mechanical push-pin engagement:
Grid 1 reading: e_1 = 420 microstrain
Grid 2 reading: e_2 = 180 microstrain
Grid 3 reading: e_3 = -210 microstrain
Normal strain along the x-axis equals grid 1 (e_x = 420 microstrain), and normal strain along the y-axis equals grid 3 (e_y = -210 microstrain). Engineering shear strain combines all three channels:
gamma_xy = 2 (180) – (420 + (-210))
gamma_xy = 360 – 210 = 150 microradians
The hydrostatic strain component ~ the center of Mohr circle ~ gives the average normal strain:
e_avg = (e_x + e_y) / 2
e_avg = (420 + (-210)) / 2 = 105 microstrain
The maximum in-plane shear strain radius follows from normal strain divergence and planar shear:
R_strain = sqrt(((e_x – e_y) / 2)^2 + (gamma_xy / 2)^2)
R_strain = sqrt(((420 – (-210)) / 2)^2 + (150 / 2)^2)
R_strain = sqrt((315)^2 + (75)^2)
R_strain = sqrt(99225 + 5625) = sqrt(104850) = 323.8 microstrain
Calculating the principal strain limits yields:
e_max = e_avg + R_strain = 105 + 323.8 = 428.8 microstrain
e_min = e_avg – R_strain = 105 – 323.8 = -218.8 microstrain
Evaluating the principal angle confirms the orientation of maximum tensile deformation relative to the package edge:
theta = 0.5 atan2(150, 420 – (-210))
theta = 0.5 atan2(150, 630) = 0.5 0.2336 radians = 0.1168 radians = 6.69 degrees
This indicates peak tensile strain is oriented 6.69 degrees from the component edge. At 428.8 microstrain, maximum principal strain exceeds the 400 microstrain threshold for fast pneumatic ICT closure, indicating the fixture risks fracturing corner solder joints during production.
A raw single-gauge reading misses multi-axial bending peaks by failing to resolve the rotational shear component that expands the Mohr circle.
Stress calculation proceeds from these strain metrics by applying Hooke generalized plane stress equations for isotropic regions of the laminate:
sigma_max = (E / (1 – nu^2)) (e_max + nu e_min)
Assuming an effective in-plane laminate modulus of 22.0 GPa and an effective Poisson ratio of 0.14 for standard FR-4 material, the corresponding surface stress computes as:
sigma_max = (22.0 10^9 / (1 – 0.14^2)) (428.8 10^-6 + 0.14 (-218.8 10^-6))
sigma_max = (22.0 10^9 / 0.9804) (428.8 – 30.63) 10^-6
sigma_max = (22.44 10^9) (398.17 10^-6) = 8.93 MPa
This tensile stress feeds directly into pad cratering risk assessments across IPC-9704 audit dossiers.
Section 4.3 of the corporate build standard invalidates qualification data whenever the computed principal angle deviates by more than 15 degrees from the finite element model prediction without root-cause documentation.
Optics
Optical full-field measurement systems replace discrete rosettes by capturing complete displacement gradients across the board surface. Digital Image Correlation (DIC) relies on a random speckle pattern applied to the assembly, tracking pixel movements across multi-camera setups as the board flexes. Where a physical gauge gives sub-microstrain resolution at one spot, DIC maps strain contours across the whole board.
Digital Image Correlation Mechanics
DIC maps surface displacements by tracking high-contrast speckle patterns under uniform light. Preparation involves applying a matte white base layer followed by a fine mist of black speckles. Average speckle size should cover 3 to 5 pixels on the sensor to satisfy Nyquist sampling limits and avoid aliasing.
Stereoscopic dual-camera setups measure 3D displacements, separating out-of-plane board warpage from true in-plane bending strain.
The correlation software divides images into sub-pixel windows (facets or subsets), typically 15×15 to 29×29 pixels. Tracking subset movements across load frames yields the displacement field u(x, y) and v(x, y). Taking spatial derivatives of these fields gives the Green-Lagrange strain tensor across the view:
e_xx = du / dx + 0.5 ((du / dx)^2 + (dv / dx)^2 + (dw / dx)^2)
e_yy = dv / dy + 0.5 ((du / dy)^2 + (dv / dy)^2 + (dw / dy)^2)
e_xy = 0.5 (du / dy + dv / dx + (du / dx du / dy + dv / dx dv / dy + dw / dx dw / dy))
Optical strain measurement bypasses several limitations of physical gauges: it eliminates leadwire routing, avoids local stiffening from adhesives, and maps neutral-axis shifts around rigid components in real time. Spatial resolution depends on sensor resolution and subset step size. For example, imaging a 100 mm × 100 mm area with a 5-megapixel sensor yields ~0.25 mm spatial resolution per subset, easily resolving strain gradients between 1206 capacitor pads.
| Measurement Parameter | Triaxial Foil Rosette | Digital Image Correlation (DIC) |
|---|---|---|
| Strain Resolution | 0.5 to 1.0 microstrain | 15 to 50 microstrain |
| Maximum Acquisition Rate | 100 kHz (Quarter Bridge) | 5 kHz (Full Frame High-Speed) |
| Spatial Coverage | Discrete Point (0.8 mm grid) | Full Field (200 mm x 200 mm typical) |
| Out-of-Plane Sensitivity | Blind to z-deflection | Decouples z-warpage directly |
| Surface Preparation | Adhesive bonding and wiring | Stochastic spray speckle pattern |
| Thermal Range Capability | -40 to +150 degrees C | -100 to +300 degrees C (with window) |
Thermal reflow profiling is a primary use case for DIC. Heated test chambers with quartz windows let stereo cameras measure board warpage and package tilt through the reflow cycle. The system tracks dynamic out-of-plane movements, capturing saddle and bowl distortion modes as lead-free solder transitions from liquid paste to solid joints.
Does Board Warpage Distort Surface Strain Results?
Large out-of-plane deflections introduce geometric nonlinearities that distort surface strain results. When a board flexes beyond roughly half its thickness, membrane tension develops alongside pure bending strain. Single-camera 2D DIC systems record false apparent strain because out-of-plane motion moves the speckle pattern closer to the lens, creating magnification shifts that look like tensile strain.
Stereoscopic 3D DIC fixes this by tracking coordinates in calibrated 3D space. The dual-camera setup measures out-of-plane position w(x, y) independently of in-plane movement, clarifying whether high strain comes from localized fixture bending or overall membrane stretching across the board.
Foil gauges also experience errors under severe warpage, where out-of-plane curvature creates peel stresses in the adhesive that can cause gauge debonding or signal distortion. Testing programs often combine both techniques: stereo DIC identifies high-strain hotspots across the panel, and foil rosettes are then placed at those locations to capture rapid transient strain rates during dynamic handling.
What remaining uncertainty governs optical DIC field calculations when measuring steep strain gradients near mirrored silicon die edges where stochastic speckle paint cannot adhere?
Qualification
Mechanical qualification translates strain field calculations into enforceable production limits. Assembly lines set strain thresholds to prevent field failures from latent solder microcracking or laminate pad cratering. Establishing these thresholds requires balancing principal strains, strain rates, package sizes, and laminate resin properties.
Implementing IPC-JEDEC Standards in Production
Electronics manufacturers qualify board handling using IPC-JEDEC-9704 and IPC-JEDEC-9702. IPC-JEDEC-9702 defines mechanical fracture test methods ~ such as four-point monotonic and cyclic bend testing ~ to set baseline component fracture limits. IPC-JEDEC-9704 adapts those limits for production line audits, detailing gauge placement, rosette configurations, and calculation methods across assembly steps.
Allowable surface strain follows an inverse power relationship with strain rate. IPC-9704 provides a standardized formula for maximum allowable principal strain based on package size and strain rate:
e_limit = e_nominal (alpha / (de / dt))^beta
Here, alpha is an empirical rate coefficient, beta is the strain rate sensitivity exponent, and e_nominal is the baseline allowable strain under static deflection. For large BGA packages, beta typically ranges from 0.15 to 0.20. As strain rate accelerates from 10 microstrain/s to 100,000 microstrain/s, allowable maximum principal strain drops by more than half.
Package dimensions also scale the allowable strain thresholds. Small components tolerate higher board curvature because their solder joint footprint spans a small area. Large packages span wider regions, multiplying mechanical displacement between the component substrate and PCB laminate.
Assembly standards therefore set lower allowable strain limits for 45 mm packages than for 15 mm packages under the same bending load.
Laminate resin choice strongly affects mechanical compliance and strain capability. Standard FR-4 with dicyandiamide (DICY) curing offers high elongation but degrades during lead-free reflow. High-performance FR-4 and polyimide using phenolic cures provide higher glass transition temperatures but are more brittle.
Under dynamic bending, phenolic systems experience pad cratering and microcracking at principal strains 20 to 30 percent lower than DICY baselines.
Qualification dossiers gather strain measurements across every tool in the manufacturing line. Fixtures that produce peak strains exceeding the calculated limit require mechanical rework. Systematic strain analysis ensures high-stress assembly steps are identified and corrected before releasing a process to volume production.