Calculating Parasitic Bus Capacitance Limits in Surface Mount Assemblies
Calculate bus parasitic limits by summing pin, pad, and trace capacitance against standard rise-time formulas to fix pull-up values before board layout freezes.


Budget
Fast-mode I2C lines hit their limit at 400 picofarads total capacitance, whereas Fast-mode Plus allows up to 550 picofarads to keep rise times under 120 nanoseconds. Routing six environmental sensors on a single trace alongside an analog front-end and host microcontroller rapidly accumulates stray capacitance. Physical transceiver pins add 2 to 10 picofarads apiece, depending on internal silicon design and ESD clamps, while copper traces on standard multilayer cores contribute roughly 0.5 to 1.2 picofarads per centimeter.
Pads, solder joints, and test points push that total higher, so establishing the parasitic budget means weighing driver strength against passive pull-up constraints before layout is complete.
A surface-mount bus line exceeding 400 picofarads at 400 kilohertz degrades signal edges beyond the 300-nanosecond rise threshold when tied to standard 4.7-kiloohm termination resistors.
Package choices directly influence available capacitance headroom. Choosing an environmental sensor in a plastic dual flat no-lead housing rather than a small outline integrated circuit cuts internal lead capacitance roughly in half. Pin pitch, thermal pad voiding, and solder fillet height all shift the fringing capacitance seen at the driver pins.
Intermittent arbitration failures on the test floor frequently originate from unaccounted pin-to-plane coupling caused by aggressive ground flooding right beneath sensor land patterns.
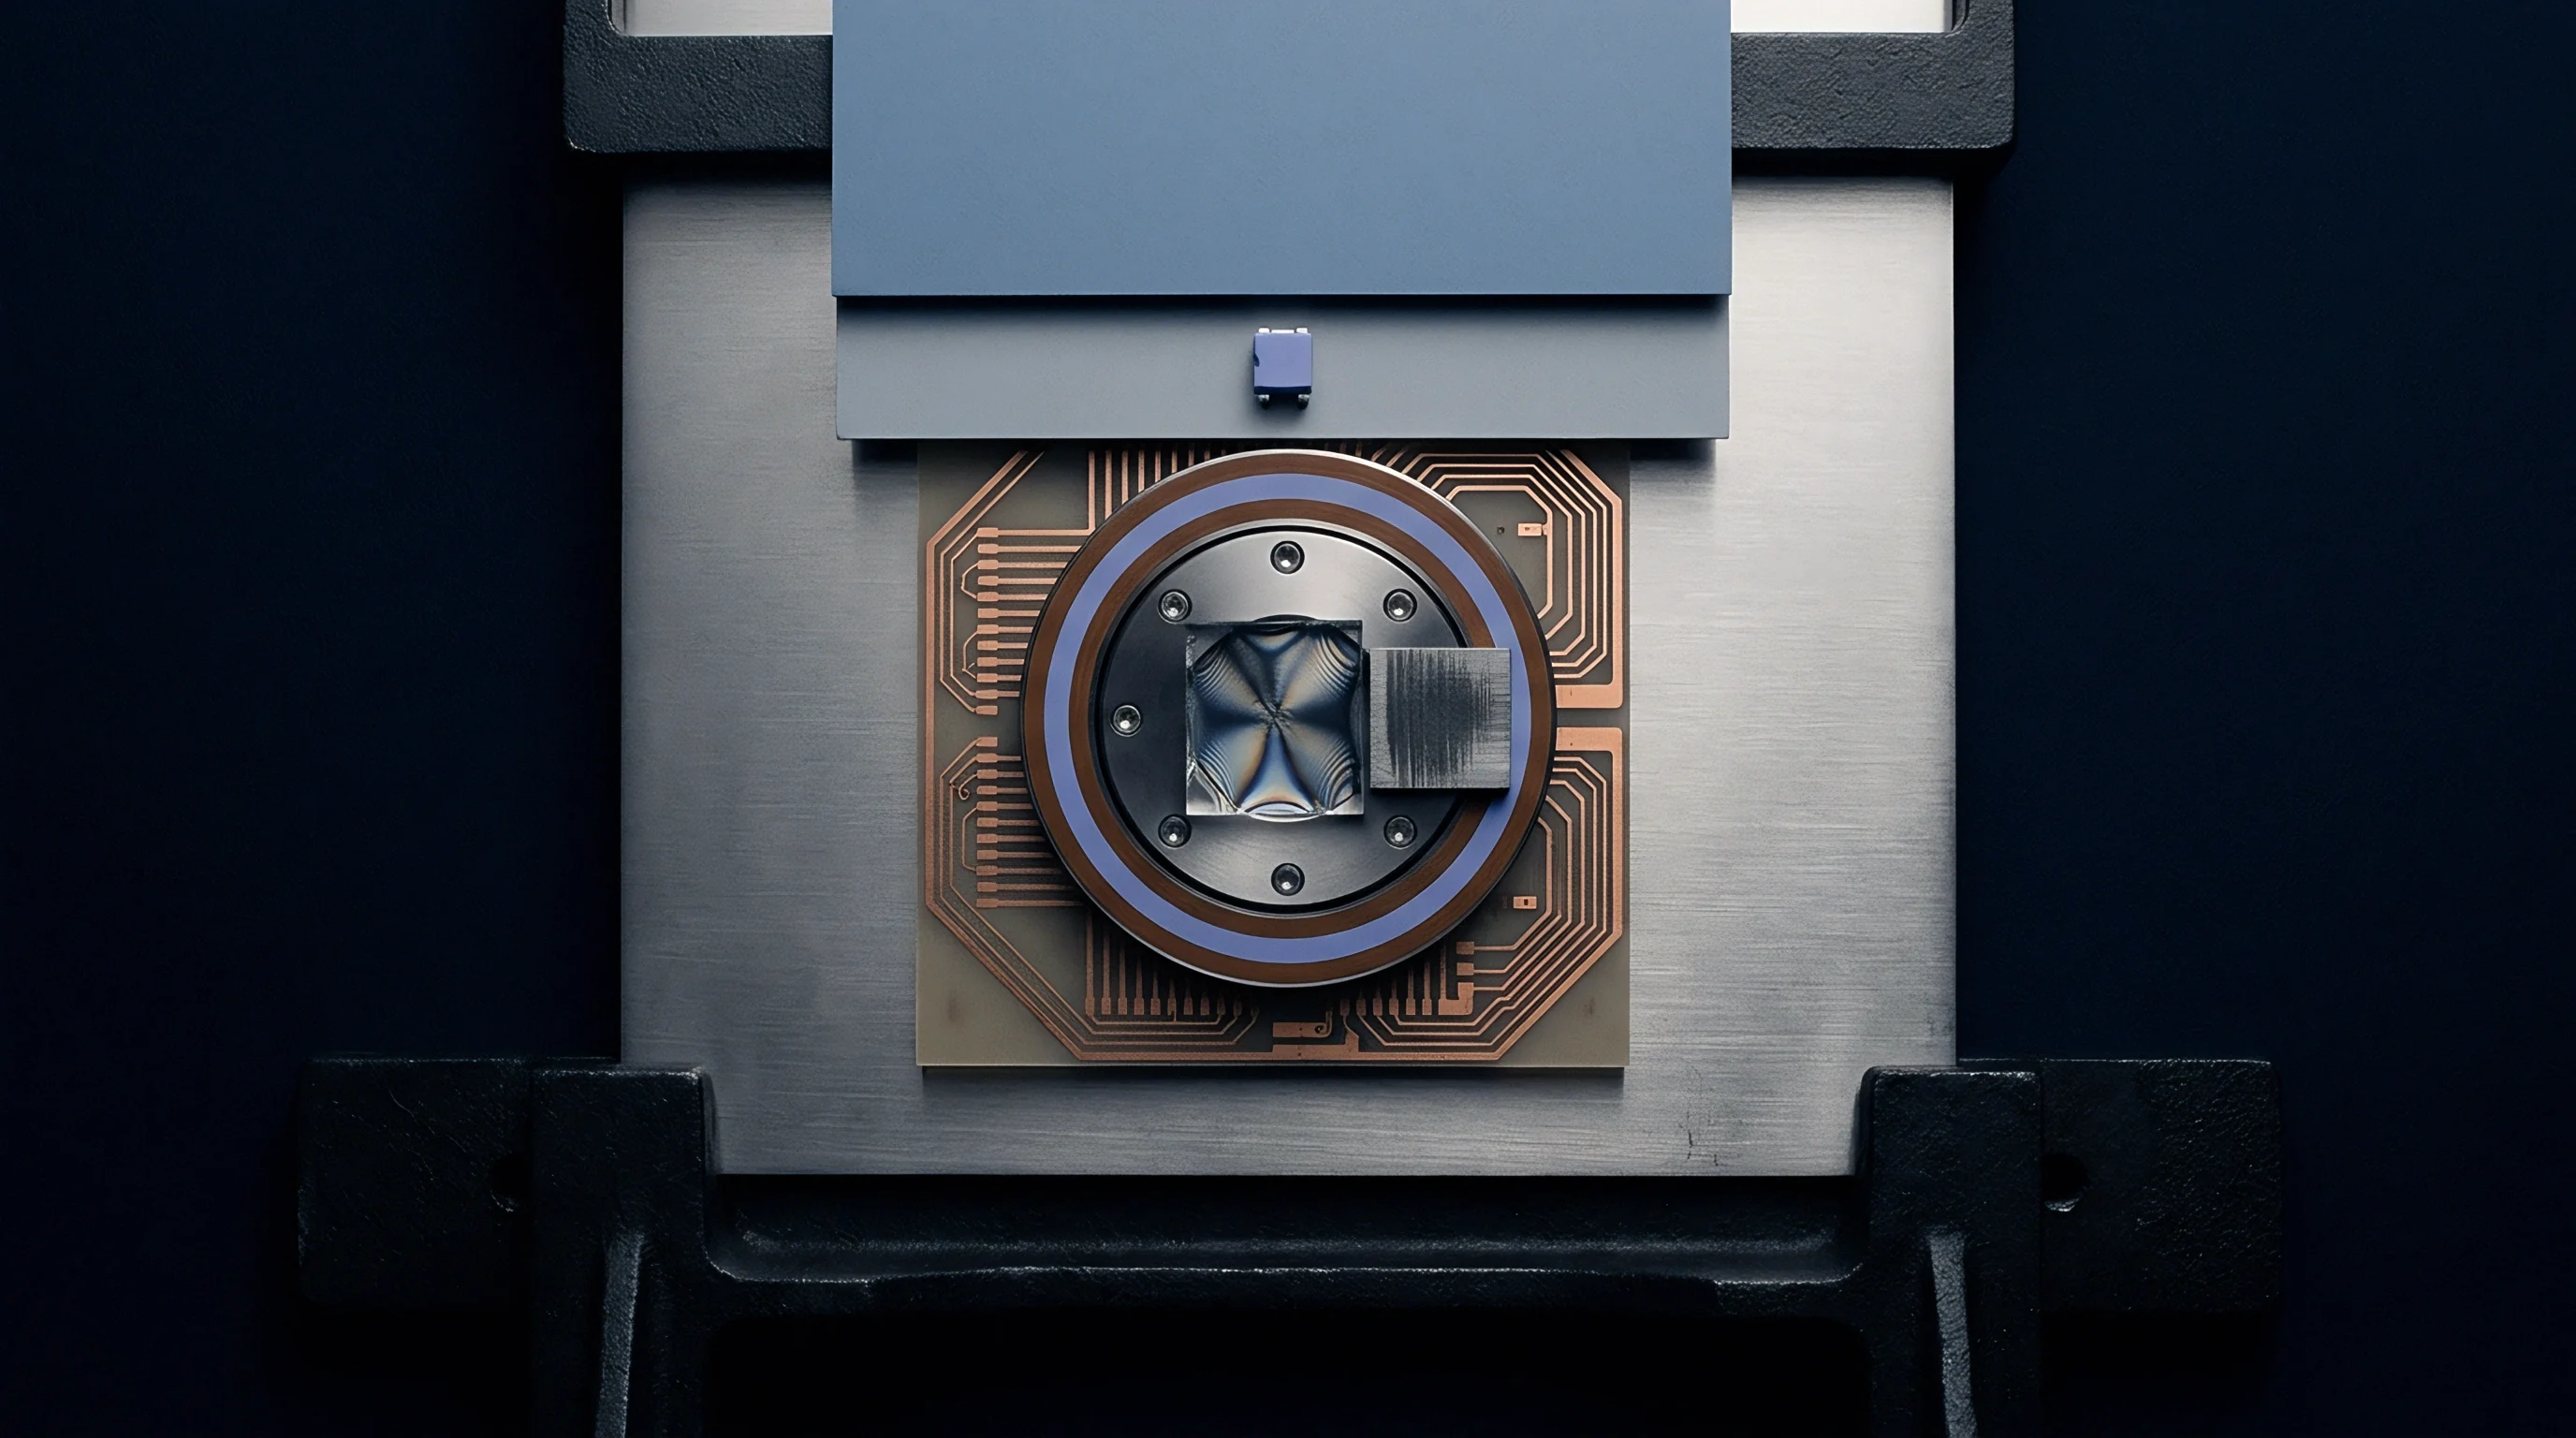
Package Parasitics across Common Sensor Outlines
Leadframe geometry sets the baseline for component parasitics. Molded packages like SOIC-8 or TSSOP-8 feature long lead fingers suspended over the board surface, generating mutual capacitance between neighboring pins and parallel-plate coupling to reference planes below. Bottom-terminated components forgo exterior leads altogether, using flat metallized lands soldered straight to board pads.
| Package Format | Pin Count | Lead Pitch (mm) | Pin Capacitance Typ (pF) | Pin Inductance Typ (nH) | Board Footprint Area (mm²) |
|---|---|---|---|---|---|
| WLCSP | 4 to 12 | 0.40 | 0.8 to 1.5 | 0.2 to 0.5 | 1.8 to 4.2 |
| DFN | 6 to 8 | 0.50 | 1.2 to 2.2 | 0.6 to 1.1 | 4.0 to 9.0 |
| QFN | 16 to 24 | 0.50 | 1.5 to 3.0 | 0.9 to 1.8 | 16.0 to 25.0 |
| LGA | 8 to 16 | 0.65 | 1.1 to 2.0 | 0.4 to 0.9 | 6.2 to 12.5 |
| SOIC | 8 | 1.27 | 3.5 to 6.5 | 2.5 to 4.0 | 30.0 to 32.0 |
Wafer-level chip-scale packages keep added parasitics minimal by routing signals straight from die redistribution layers to solder spheres. Omitting the internal leadframe drops pin capacitance below 1.5 picofarads under typical conditions. Land grid array packages run somewhat higher because of internal substrate traces, but still perform significantly better than gull-wing leads.
Selecting smaller package footprints helps protect the timing budget against excess capacitance.

Input Pin Capacitance Variations
Internal transceiver circuitry adds loading that datasheet tables often underestimate. Pin capacitance is typically specified at 1 megahertz with zero bias, but working voltages change junction depletion widths and shift that baseline in practice.
Parasitic capacitance arises at several points inside the assembled module:
- Integrated electrostatic discharge diodes add 1.5 to 5.0 picofarads of junction capacitance per signal line tied to the power clamp.
- Bond wire proximity creates 0.3 to 0.8 picofarads of mutual coupling between adjacent lines inside overmolded cavities.
- Silicon die redistribution traces contribute 0.5 to 1.2 picofarads depending on dielectric thickness above the silicon substrate.
- Surface-mount landing metallization adds 0.4 to 1.0 picofarad per pad through the laminate to underlying ground planes.
Placing seven peripherals on one digital line consumes roughly 35 picofarads of headroom before accounting for PCB traces. Variations in solder paste volume from stencil printing cause minor shifts in pad capacitance across assembly lots, as stencil thickness dictates total deposited volume. When determining allowed bus loading, allocating at least twenty percent of the total specification limit to internal component structures provides necessary margin.
Under Section 6.1 of the UM10204 specification, signal rise times must remain under 300 nanoseconds at 400 kilohertz to pass compliance testing.
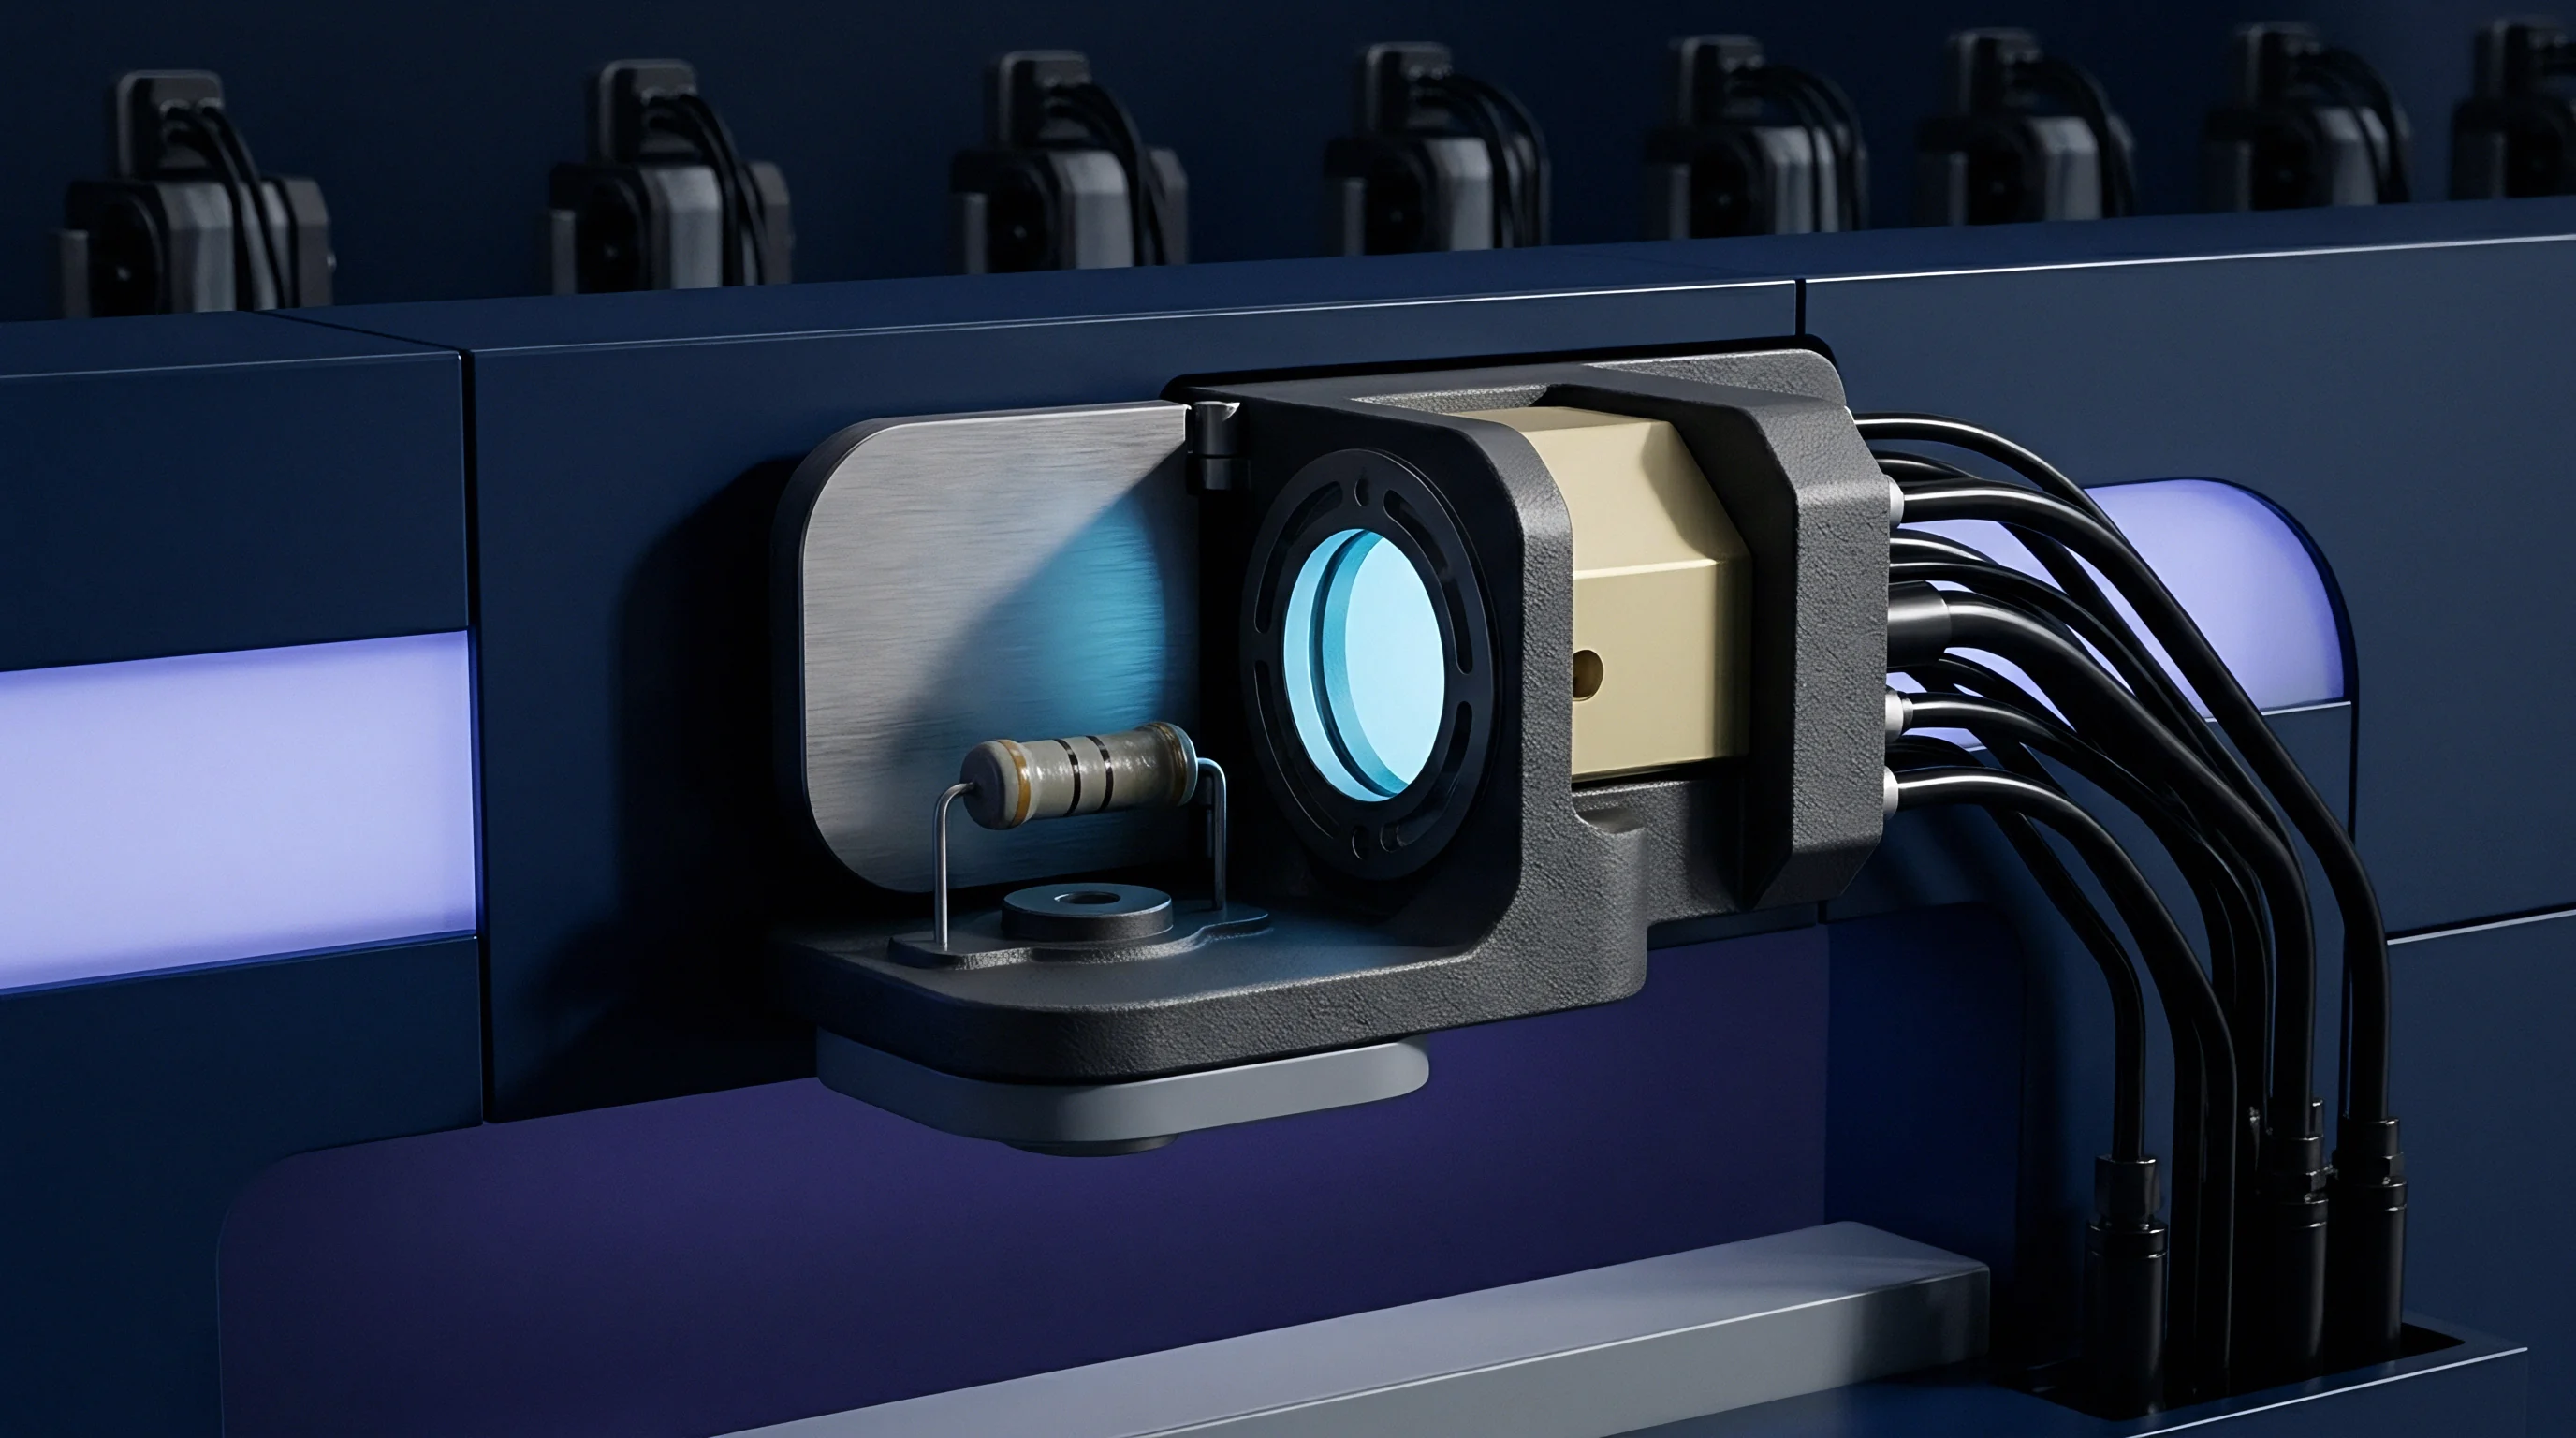

Pad
Traces interact electrostatically with internal reference planes, establishing baseline capacitance through the board dielectric. Standard FR-4 laminates exhibit a dielectric constant of 4.0 to 4.6 at high frequencies, distributing capacitance evenly along the length of the run. A 0.15-millimeter trace on a 4-layer stack-up with 0.1-millimeter prepreg insulation adds about 1.1 picofarads per centimeter, so a twelve-centimeter trace between sensor clusters consumes more than 13 picofarads.
Component land patterns add to this total by creating broader copper regions that act as parallel plates above internal planes.
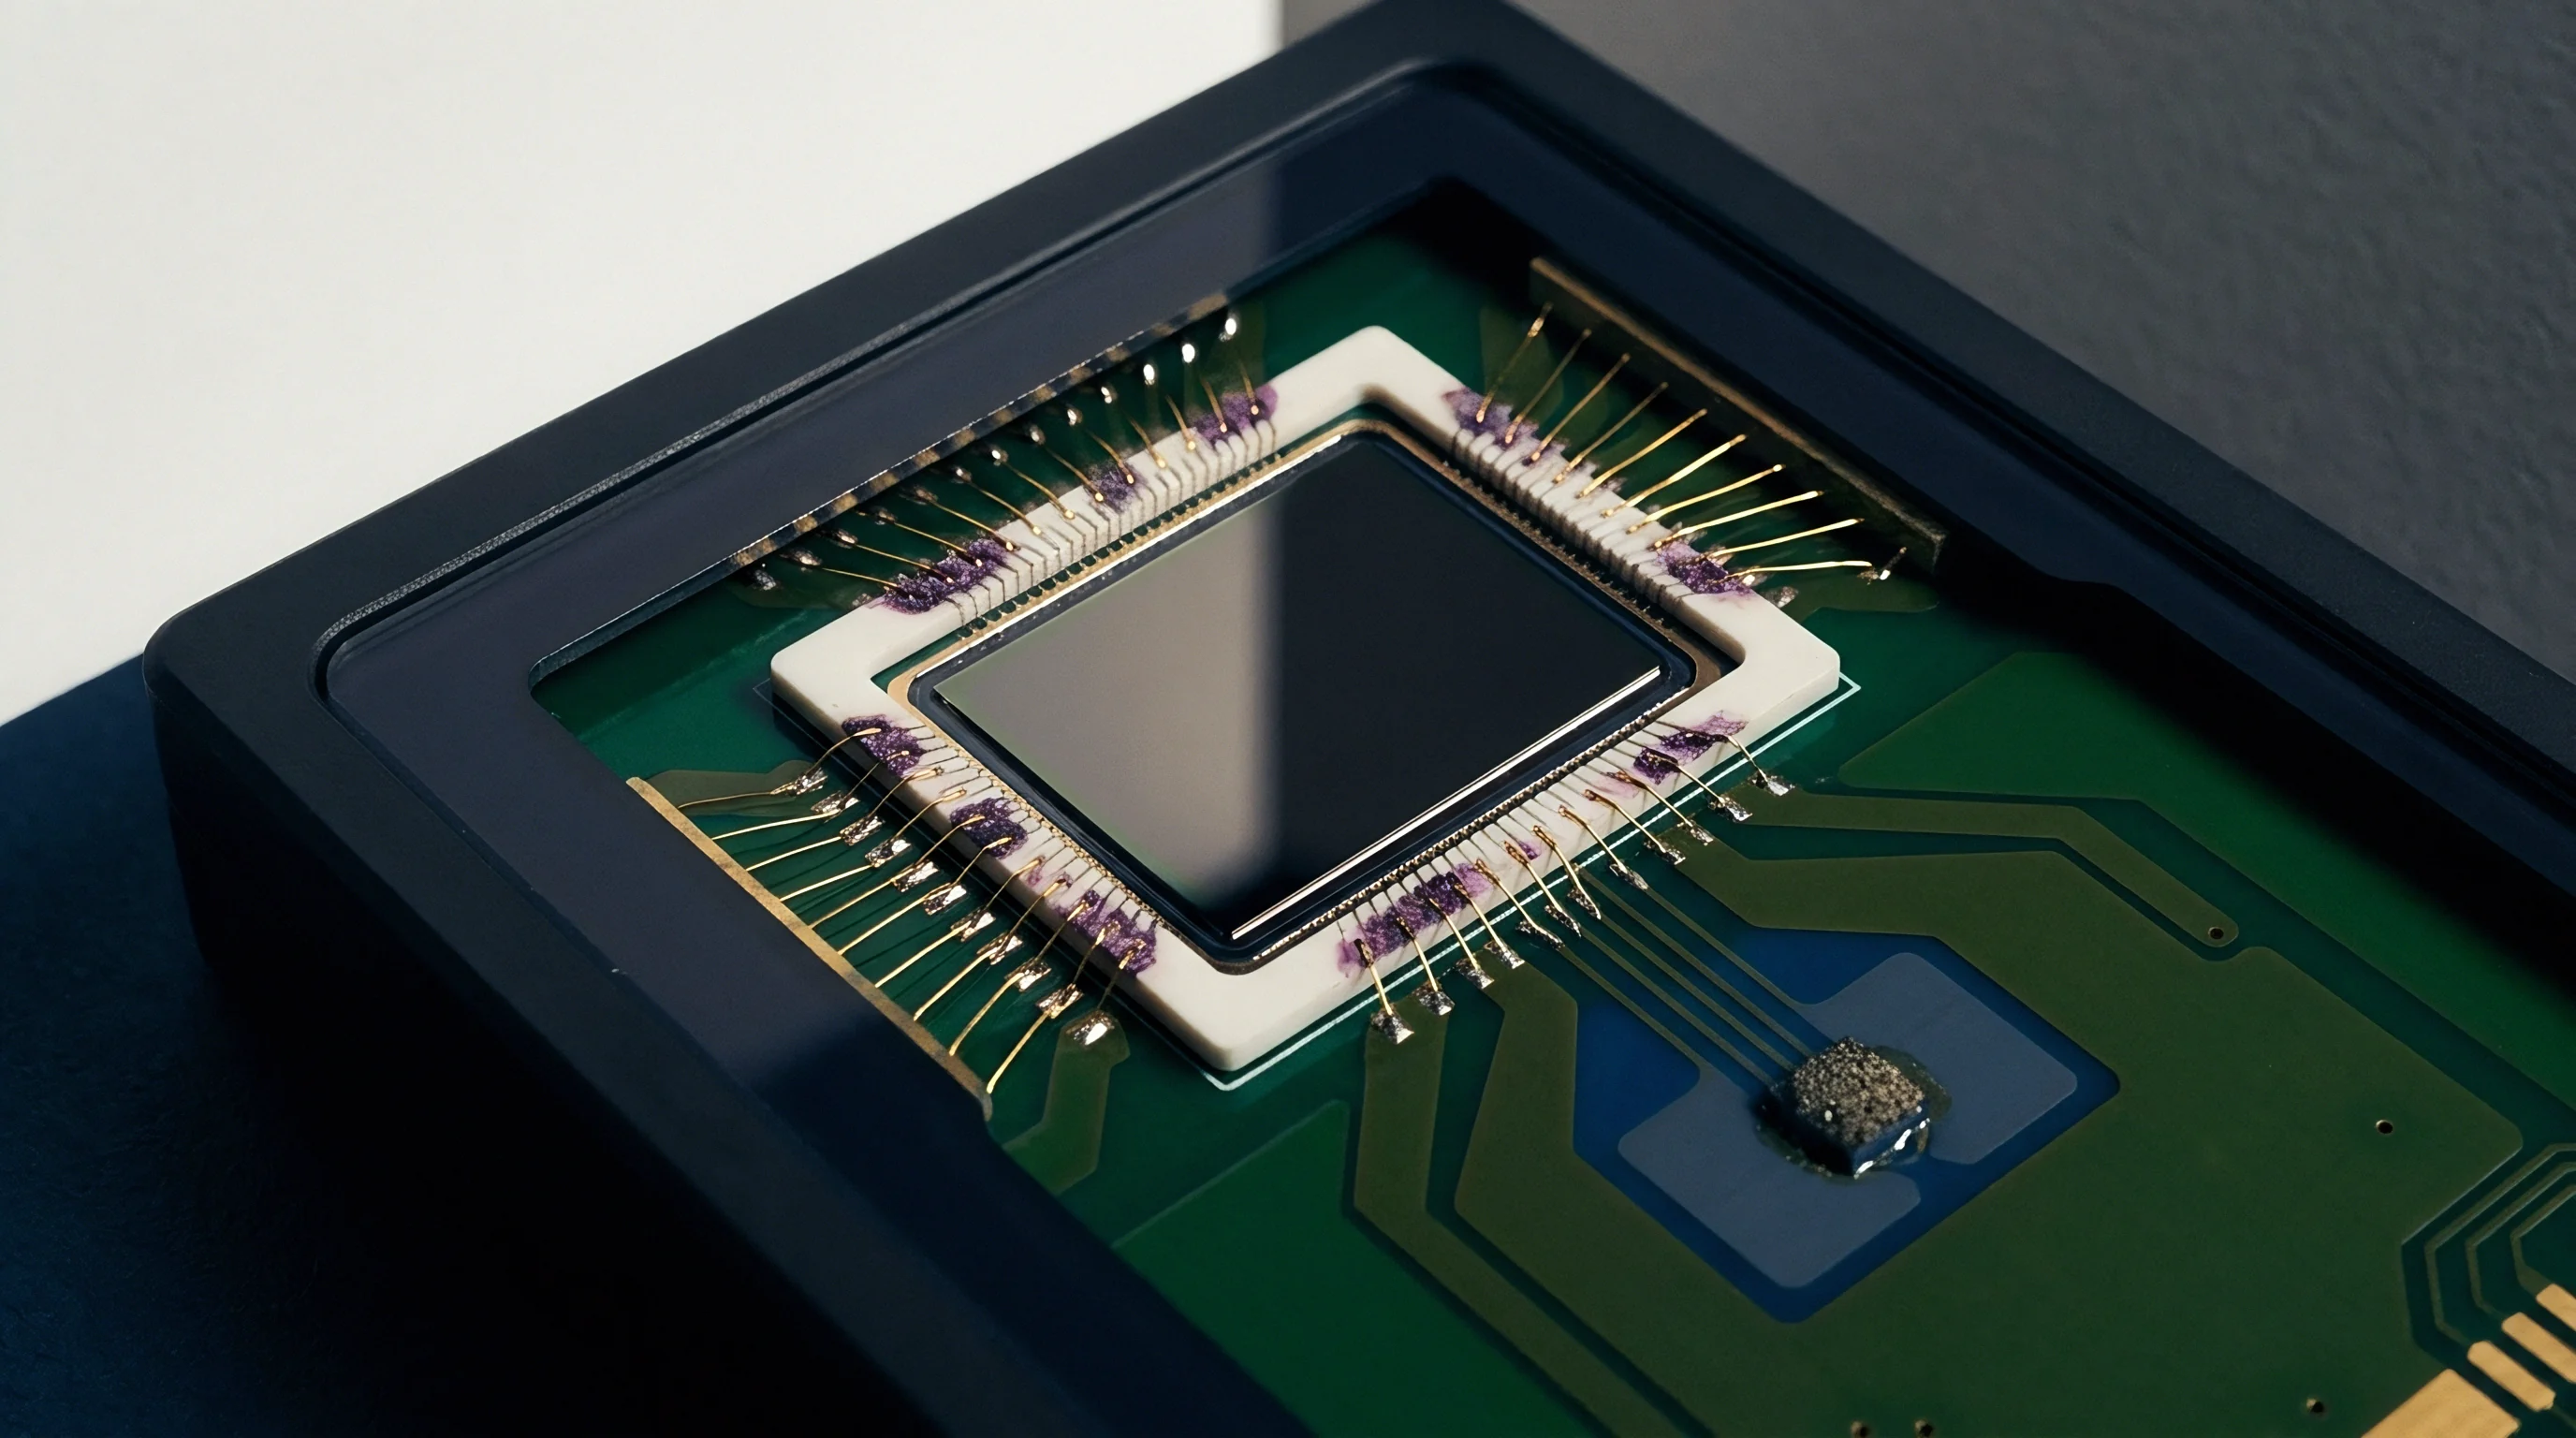
Substrate Coupling and Distributed Copper Area
Dielectric thickness impacts trace capacitance much more than trace width. Thin outer prepreg layers lower microstrip impedance while increasing distributed capacitance. Liquid photoimageable solder mask, with a relative permittivity between 3.3 and 3.8, adds another five to eight percent above bare trace estimates based on the standard microstrip formula:
C = (w epsilon_0 epsilon_r / h) + C_fringe
Here C is capacitance per unit length, w is trace width, h is dielectric height to the nearest reference plane, epsilon_0 is the permittivity of free space, and epsilon_r is the relative permittivity of the laminate. The fringing term, C_fringe, captures electric fields radiating laterally from trace sidewalls through air and solder mask into the ground plane. On narrow conductors, this fringing contribution accounts for over forty percent of total line capacitance.
Traces routed across inner board layers exhibit higher unit capacitance than equivalent surface microstrips due to continuous dielectric encirclement by resin and glass fibers.
Poured ground planes also increase line capacitance. Automated ground fills on the top layer add coplanar capacitance directly alongside the parallel-plate baseline. Keeping at least three times the trace width in clear space between signal lines and surrounding ground pours reduces lateral coupling to negligible levels.
| Dielectric Height (mm) | Dielectric Material (epsilon_r) | Trace Width (mm) | Copper Weight (oz) | Capacitance (pF/cm) | Characteristic Impedance (ohms) |
|---|---|---|---|---|---|
| 0.10 | Standard FR-4 (4.4) | 0.15 | 1.0 | 1.18 | 58.2 |
| 0.10 | Standard FR-4 (4.4) | 0.25 | 1.0 | 1.64 | 46.1 |
| 0.15 | High-Tg FR-4 (4.2) | 0.15 | 1.0 | 0.92 | 71.4 |
| 0.15 | High-Tg FR-4 (4.2) | 0.25 | 1.0 | 1.24 | 57.8 |
| 0.20 | Halogen-Free Core (4.0) | 0.20 | 0.5 | 0.79 | 76.3 |
| 0.08 | Polyimide Flex (3.4) | 0.12 | 0.5 | 1.05 | 59.7 |
Which Microstrip Geometry Minimizes Stray Capacitance?
Narrowing trace width reduces capacitance, though it increases line resistance and characteristic impedance. For digital sensor networks operating under 10 megahertz, trace resistance is trivial compared to driver output impedance. Routing signal lines at minimum fabricator process widths, such as 0.10 or 0.12 millimeters, effectively minimizes area-based capacitance.
Vias introduce lumped capacitance along the trace path. A standard through-hole via with a 0.45-millimeter pad and 0.20-millimeter drill on a 1.6-millimeter 4-layer board adds 0.3 to 0.6 picofarads, as the barrel couples to power and ground planes on every layer it passes through. Blind vias terminate at inner layers, eliminating stub length and keeping capacitance below 0.2 picofarads.
Removing non-functional pads on unused inner layers helps shave off additional loading.
Solder volume also affects pad parasitics. Excess paste spreads beyond the nominal footprint during reflow, expanding the effective conductor area. Mask clearances around fine-pitch DFN and LGA packages can allow fillets to bridge toward adjacent ground reference copper.
Specifying non-solder-mask defined pads maintains consistent copper boundaries, stabilizing capacitance across assembly runs.
Opening reference plane copper beneath sensor land patterns prevents localized capacitive loading without disrupting return current paths.

Edge
Transition times limit maximum clock speed on open-drain buses. When an active pull-down transistor inside a sensor turns off, external pull-up resistors charge the line back toward the supply rail along an exponential RC curve. Heavy parasitic loading flattens this slope, delaying the signal as it rises toward the input threshold V_IH.
Standard open-drain inputs set V_IH at seventy percent of V_DD and V_IL at thirty percent. The rise time t_r between these two levels follows:
t_r = R_p C_b ln( (V_DD – 0.3 V_DD) / (V_DD – 0.7 V_DD) )
This simplifies algebraically to:
t_r = R_p C_b ln(0.70 / 0.30) = 0.8473 R_p C_b
Here R_p is the pull-up resistance and C_b is total lumped bus capacitance. If layout parasitics and pin loading reach 350 picofarads, meeting a 300-nanosecond rise limit requires a pull-up resistor no larger than 1.01 kiloohms to establish the required RC product.

Dynamic Transition Constraints and Pullup Limits
Lowering pull-up resistance sharpens rising edges, but hits a firm limit in driver sink capacity. When a sensor asserts a logic low on an open-drain line, its output transistor sinks current through the pull-up resistor to keep voltage below V_OL, typically 0.4 volts maximum. Standard I2C specifications require a minimum sink capability, I_OL, of 3 milliamperes at 0.4 volts.
Calculating the minimum allowed pull-up resistance prevents output voltages from exceeding V_IL:
R_p_min = (V_DD – V_OL_max) / I_OL
For a 3.3-volt supply rail, this yields:
R_p_min = (3.3 V – 0.4 V) / 0.003 A = 966.7 ohms
The operating window narrows sharply as bus loading approaches 400 picofarads. The usable resistance range contracts to a narrow band between 967 ohms for driver sink limits and 1012 ohms for rise-time compliance. Standard five-percent tolerance resistors introduce significant yield risk here, as an upward shift violates the 300-nanosecond rise limit while a downward shift pulls the low level out of spec.
A 3.3-volt sensor bus running 380 picofarads of line loading leaves less than fifty ohms of permissible margin between driver sink limits and timing violations.
Fall times rely on active discharge through the driver’s internal FET pulling parasitic capacitance down to ground. Discharge speed scales with the transceiver’s output on-resistance R_on, typically between 10 and 60 ohms. Fall times rarely limit open-drain performance unless capacitance exceeds 600 picofarads, at which point discharge currents threaten the thermal limits of small dies.
Will Open Drain Drivers Tolerate Overloaded Traces?
Exceeding capacitance limits distorts clock edges into saw-tooth profiles, triggering false transitions on Schmitt-trigger inputs and causing spurious arbitration losses. Microcontrollers monitoring clock stretching detect prolonged low periods and slow bus throughput, while firmware stalls waiting for slave devices that miss address bits smeared across logic thresholds.
Evaluating an overloaded bus on the bench involves several targeted checks:
- Disconnect power rails and measure passive line resistance between serial data traces and the positive supply rail using a four-wire milliohm meter.
- Attach low-capacitance active probes under 0.8 picofarads tip capacitance at the sensor node farthest from the pull-up resistor.
- Capture continuous bitstreams at operational frequency, taking ten-percent to ninety-percent rise measurements across one hundred consecutive clock pulses.
- Cross-check low-level voltage drop at each sensor transceiver as nodes sequentially pull the data line to ground.
Because clock lines tolerate less distortion, excessive capacitance that stretches clock rise times before data lines settle introduces race conditions that corrupt shift registers. High sink currents through compact package footprints also induce local die heating, introducing drift in sensor calibrations.
Operating outside the allowable RC window results in missed acknowledgments, arbitration lockups in multi-master setups, and intermittent field dropouts.
Margin
When tight mechanical layouts or dense sensor counts push capacitance beyond limits, hardware designs usually require either board re-routing or active buffer silicon. Re-spinning an eight-layer board involves NRE charges, tool set changes, and schedule delays. Adding an active accelerator or dual-channel buffer IC to an existing footprint handles the excess load without forcing layout revisions across the board.
Active accelerators monitor signal slope. Once a rising edge crosses a threshold like 0.6 volts, an internal low-impedance transistor fires briefly to drive current into the trace. This boost pulls the voltage toward the rail in tens of nanoseconds, bypassing passive pull-up sluggishness.
The driver then turns off, letting standard logic levels hold the line without interfering with sensor pull-down stages.
Buffer Allocation against Rework Expenses
Dedicated buffer ICs divide capacitive loading into separate physical segments. Positioned midway along a sixteen-sensor bus, a buffer splits 500 picofarads of line capacitance into two independent 250-picofarad segments. Each side runs its own pull-up resistor, recovering edge rates and restoring noise margins while drivers manage low-level voltage clamp thresholds.
| Mitigation Route | Added BOM Cost ($) | Board Area Added (mm²) | Max Bus Capacitance (pF) | Firmware Changes Required | Quoted Part Lead Time |
|---|---|---|---|---|---|
| Passive Resistor Tuning | 0.00 | 0.0 | 400 | None | Immediate |
| Active Bus Accelerator IC | 0.32 to 0.55 | 4.2 | 1000 | None | 8 to 12 weeks |
| Bidirectional Buffer IC | 0.45 to 0.85 | 8.5 | 400 per segment | None | 10 to 14 weeks |
| Substrate Re-routing (4L) | 0.00 (Re-spin) | 0.0 | 250 | None | 4 to 6 weeks |
| Digital Multiplexer (I2C) | 0.60 to 1.10 | 12.0 | 400 per branch | Channel selection code | 12 to 16 weeks |
While active accelerators shorten rise times, adding active silicon increases supply current, unit BOM cost, and sourcing exposure. In battery-powered field devices, a quiescent draw of 150 to 300 microamperes noticeably reduces battery life. Lead times on specialized buffer ICs can also exceed twenty weeks during market shortages.
Assembly Yield and Variant Price Tradeoffs
Assembly yields drop when high-density sensor layouts run near their capacitive limits. Boards passed at room temperature during factory testing can fail at cold temperature extremes as silicon margins narrow, or under low battery voltage as open-drain sink current drops and parasitic loading degrades edge rates.
Selecting the right mitigation strategy depends on volume and system requirements:
- Passive network retuning works well when total calculated capacitance stays below 320 picofarads, leaving margin for component tolerance shifts.
- Substrate layer re-stacking makes financial sense above 50,000 units, where NRE costs spread across large production volumes.
- Active accelerator incorporation avoids layout redesigns on low- to mid-volume builds that encounter marginal rise times late in development.
- Interface protocol conversion moves the design to SPI or differential signaling when interconnect runs exceed thirty centimeters across modules.
Multi-sensor board designs require clear parasitic capacitance calculations before schematics and layout freeze. Package leadframes, substrate stack-ups, via geometries, and driver limits combine to define a rigid timing window. Ignoring stray capacitance early leads to late component swaps, unexpected BOM additions, and missed release schedules.
Ultra-thin flex-rigid designs with embedded dies present ongoing challenges in balancing capacitive coupling against dense interconnect routing as bus clock speeds push higher.