Extracting Cross Axis Vibration Rectification Coefficients for Dynamic Gravity Vector Estimation
Extracting cross axis rectification coefficients requires dual tone orthogonal excitation to isolate second order asymmetric stiffness shifts from true tilt.

Coupling
Capacitive microelectromechanical accelerometers undergo asymmetric mechanical displacement when subjected to high-amplitude oscillatory loads. In dynamic gravity vector tracking, where an attitude estimator relies on low-frequency acceleration readings to resolve local vertical, high-frequency vibratory motions introduce unexpected offsets. An oscillatory motion along a lateral axis transfers energy into the orthogonal sensing axis through mechanical non-linearities and electro-quasistatic asymmetries.
The resulting DC acceleration shift, known as the vibration rectification error, directly corrupts pitch and roll calculations. DC offsets mimic true tilt.
The physical origins of this cross-axis rectification reside within the differential capacitance architecture and flexure geometry. In a standard interdigitated finger topology, displacement along the nominal sensitive axis varies the capacitive gap. Lateral acceleration simultaneously induces out-of-plane or cross-axis proof mass displacement.
When the suspension flexures exhibit asymmetric compliance, lateral translation alters the nominal finger spacing unevenly. The differential capacitance output, inherently non-linear with respect to inverse gap distance, no longer cancels even-order distortion terms under zero-mean cyclic loading. A continuous high-frequency vibration across the orthogonal plane rectifies into a steady-state DC signal on the measurement channel.
Rectification errors in capacitive proof masses produce steady state DC acceleration signals indistinguishable from true gravitational tilt during continuous vibration.
Damping dynamics further compound this mechanical transfer. Squeeze-film gas damping between capacitive combs operates non-linearly when displacements exceed ten percent of nominal gap dimensions. As the comb fingers approach one another during one half of a high-frequency vibration cycle, viscous resistance increases nonlinearly compared to the retreating half-cycle.
This fluidic asymmetry generates a net unidirectional pressure against the proof mass. Even when suspension springs remain perfectly Hookean, fluid damping asymmetries generate a rectified DC force along the primary sensing axis. Phase shifts corrupt the sign.
Mechanical Nonlinearity across Orthogonal Axes
Suspension flexures exhibit non-Hookean behavior under severe mechanical excursions. Planar folded beams limit lateral compliance, yet machining tolerances across deep reactive-ion etching processes create sidewall angle variations between 88.5 and 91.2 degrees. These imperfect profiles couple orthogonal forces into the primary motion plane.
The proof mass displaces laterally. When an external vibratory field acts along an axis orthogonal to the detection plane, geometric cross-coupling combines with cubic spring hardening to shift the equilibrium position of the proof mass.
Signal processing stages behind the sensor element exacerbate this mechanical offset. Preamplifier front ends and discrete-time sigma-delta modulators maintain finite input voltage ranges and bounded slew rates. If cross-axis vibration drives mechanical comb fingers near resonance, displacement amplifies by the mechanical quality factor, often exceeding 15 in low-pressure hermetic packages.
The resulting high-frequency charge swings exceed the amplifier linear range, creating asymmetric waveform clipping. The demodulator subsequently averages this clipped signal into an artificial DC acceleration level indistinguishable from gravitational acceleration.

Second Order Rectification Math
Quadratic terms in sensor transfer functions generate non-zero time-averaged offsets from zero-mean sinusoidal inputs. The instantaneous indicated acceleration on axis i includes nominal input acceleration, linear cross-axis sensitivity, and second-order rectification coefficients acting on single-axis and cross-axis inputs. The operational acceleration model follows a second-order expansion:
A_indicated_i = A_true_i + S_ij A_true_j + S_ik A_true_k + K_ii (A_true_i)^2 + K_jj (A_true_j)^2 + K_kk (A_true_k)^2 + K_ij (A_true_i A_true_j) + K_ik (A_true_i A_true_k) + K_jk (A_true_j A_true_k)
Here S_ij represents linear cross-axis sensitivity, K_ii describes on-axis rectification, K_jj and K_kk define direct orthogonal cross-axis rectification coefficients, and K_ij, K_ik, and K_jk denote joint cross-axis rectification coefficients. When a sensor experiences simultaneous multi-harmonic vibration across orthogonal vectors, the cross-product terms generate beat-frequency rectification and persistent static bias. DC cross-axis rectification coefficients quantify this conversion efficiency in units of micro-g per g squared.
The physical mechanisms governing these secondary shifts divide into discrete electromechanical regimes:
- Capacitive comb gap asymmetry generates quadratic displacement-to-capacitance conversion offsets when cross-axis deflection alters nominal spacing unevenly.
- Squeeze film fluidic rectification produces unidirectional pressure differentials along the proof mass during large cyclic excursions at high ambient pressure.
- Electronic front end clipping introduces asymmetric truncation of high-amplitude AC signals prior to baseband digital filtering stages.
- Flexure sidewall etching bevels transform pure orthogonal mechanical forces directly into primary-axis spring displacement vectors.
| Transduction Architecture | Resonant Frequency (kHz) | Quality Factor (Q) | Cross-Axis Rectification K_ij (micro-g/g^2) | Dominant Rectification Mechanism |
|---|---|---|---|---|
| Closed-loop bulk silicon capacitive | 4.2 | 3.5 | 45 to 120 | Squeeze-film damping asymmetry |
| Open-loop surface micromachined | 18.5 | 18.0 | 350 to 980 | Comb gap nonlinearity and clipping |
| Resonant beam microelectromechanical | 28.0 | 250.0 | 12 to 35 | Nonlinear flexure beam tension |
| Quartz flexure pendulous | 1.8 | 4.0 | 1.5 to 8.0 | Suspension geometry cross-coupling |
Failing to characterize and isolate these cross-axis rectification terms forces attitude estimation filters to absorb the rectified DC offset as true gravitational tilt, producing continuous orientation drift exceeding two angular degrees during standard industrial machinery operations.

Rig
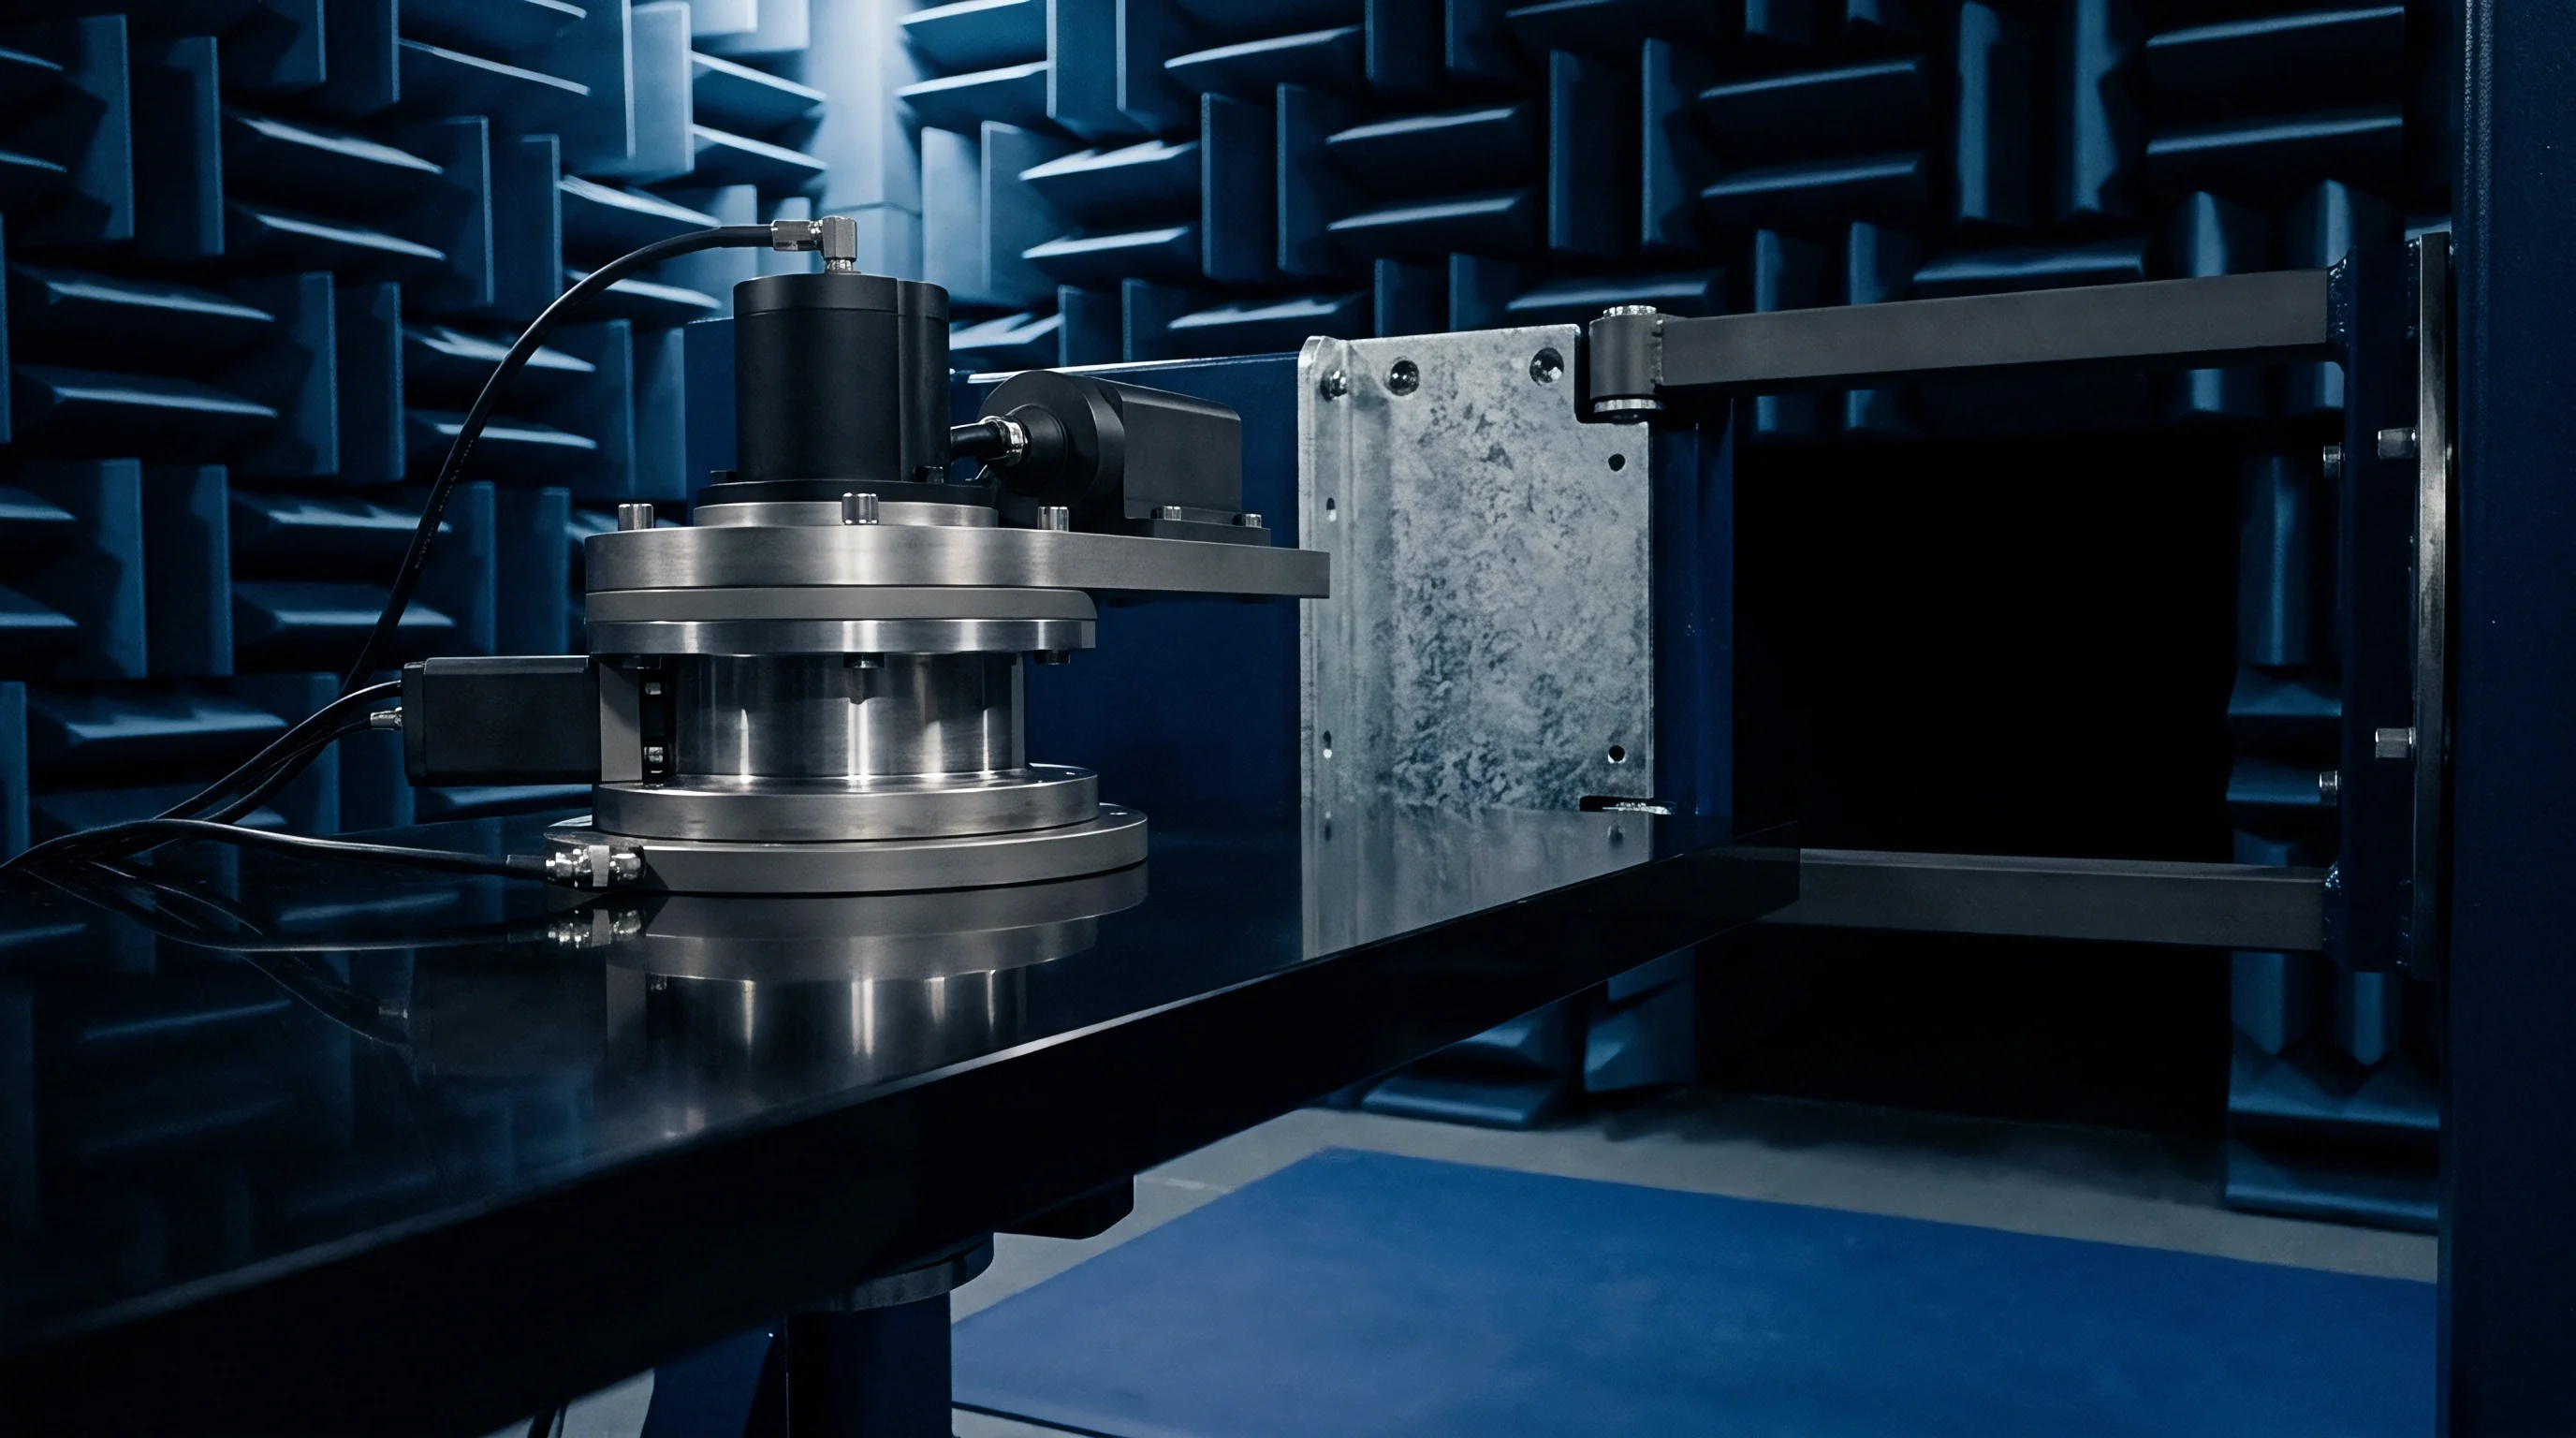
Electrodynamic shakers reproduce spectral acceleration profiles required to isolate multi-axis transfer functions. Isolating cross-axis rectification from primary-axis rectification demands mechanical test fixtures with structural resonances exceeding five times the highest vibration frequency under test. A fixture flexing at twelve hundred hertz introduces uncontrolled rotational acceleration, projecting true gravitational components directly onto the sensor active axes.
The shaker table introduces harmonics. Single-axis drives introduce mechanical cross-talk.
Test fixture blocks machined from sintered beryllium-copper or certified 7075-T6 aluminum provide the required structural rigidity. Mounting faces must remain planar within two micrometers across the contact boundary to prevent static packaging stress upon torquing. Packaging stress shifts the mechanical proof mass rest position, altering the capacitive comb gap and corrupting pre-test baseline balance.
Pure sinusoidal drive prevents smearing.
Alignment Tolerances for True Orthogonal Excitation
Angular offsets exceeding three milliradians between fixture surfaces contaminate cross-axis channels with primary drive acceleration. When an experiment intends to excite axis Y to measure the cross-rectification coefficient K_zy along axis Z, a mechanical misalignment angle theta injects a direct component equal to the drive acceleration multiplied by the sine of theta onto axis Z. At a vibration drive amplitude of 20 g peak, an angular misalignment of merely two milliradians projects 40 milli-g of direct oscillatory acceleration onto the measurement axis. If the accelerometer exhibits linear scale factor errors or primary rectification, this projected signal produces a false rectification signature.
Precision alignment protocols utilize dual-beam optical autocollimators and reference triaxial piezo-accelerometers calibrated under ISO 16063-21 standards. Reference sensors attached directly to the test block monitor transverse motion during every excitation sweep. Transverse cross-motion on high-performance electrodynamic slip tables typically ranges from two to five percent of primary drive amplitude.
This transverse motion must be continuously measured and accounted for in the regression matrices rather than assumed to be zero.
Can Single Axis Shakers Isolate Orthogonal Errors?
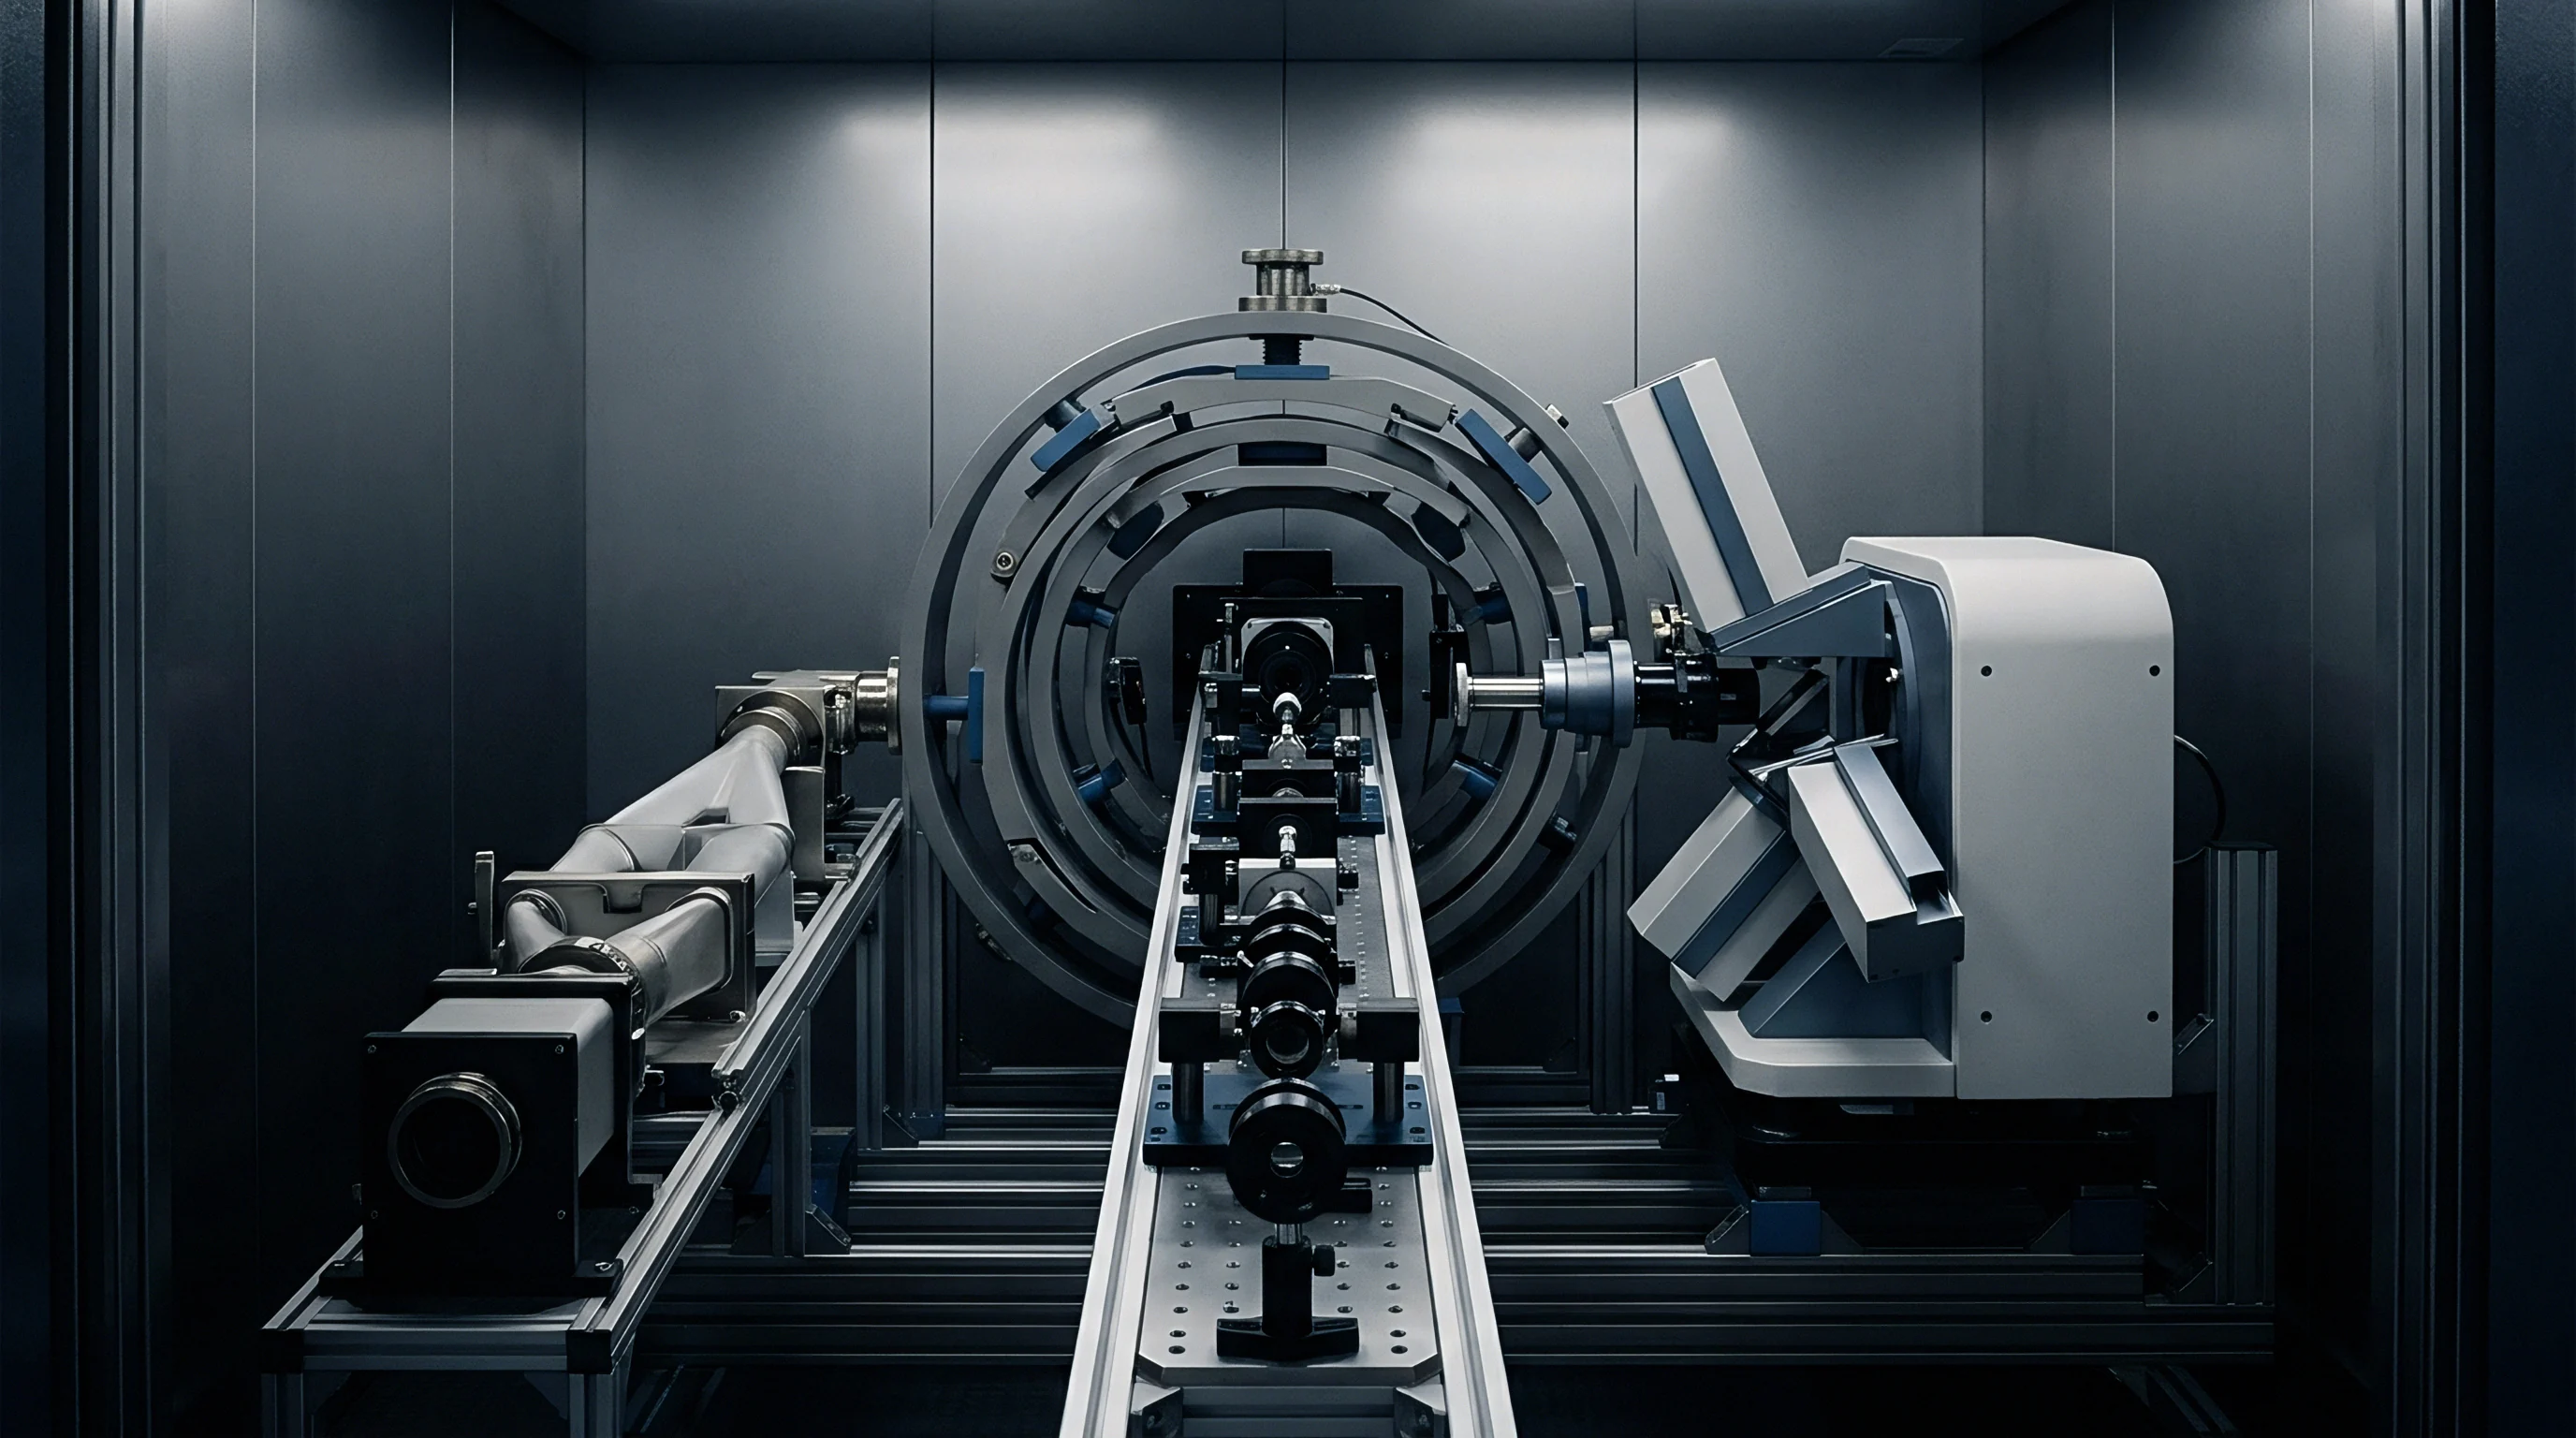
Precision cubic test fixtures rotated across twelve discrete orientations permit extraction of the full second-order tensor without multi-axis drive tables. Reorienting the cubic fixture by 180 degrees reverses the direction of the gravitational vector relative to the primary sensor axes while maintaining identical vibration vectors. This spatial inversion cancels out odd-order non-linear terms and cross-axis linear sensitivity components, isolating pure even-order rectification coefficients.
The test sequence executes a systematic progression:
- Mount the unit under test to the precision reference fixture cube using calibrated 1.2 Newton-meter fastener torque.
- Record static gravity vector outputs across six orthogonal orientations to map baseline bias, scale factor, and static cross-axis misalignments.
- Apply single-frequency sinusoidal dwell acceleration at twenty discrete frequencies spanning 50 Hz to 2500 Hz along the primary test axis.
- Capture simultaneous continuous time-series data from the unit under test and calibrated reference triaxial sensors at an acquisition rate exceeding 50 kilosamples per second.
- Invert the mounting cube orientation by 180 degrees and repeat the identical frequency sweep to enable spatial differential cancellation.
- Process collected datasets through synchronous frequency-domain bandpass filters to isolate carrier harmonics and true baseband DC shifts.
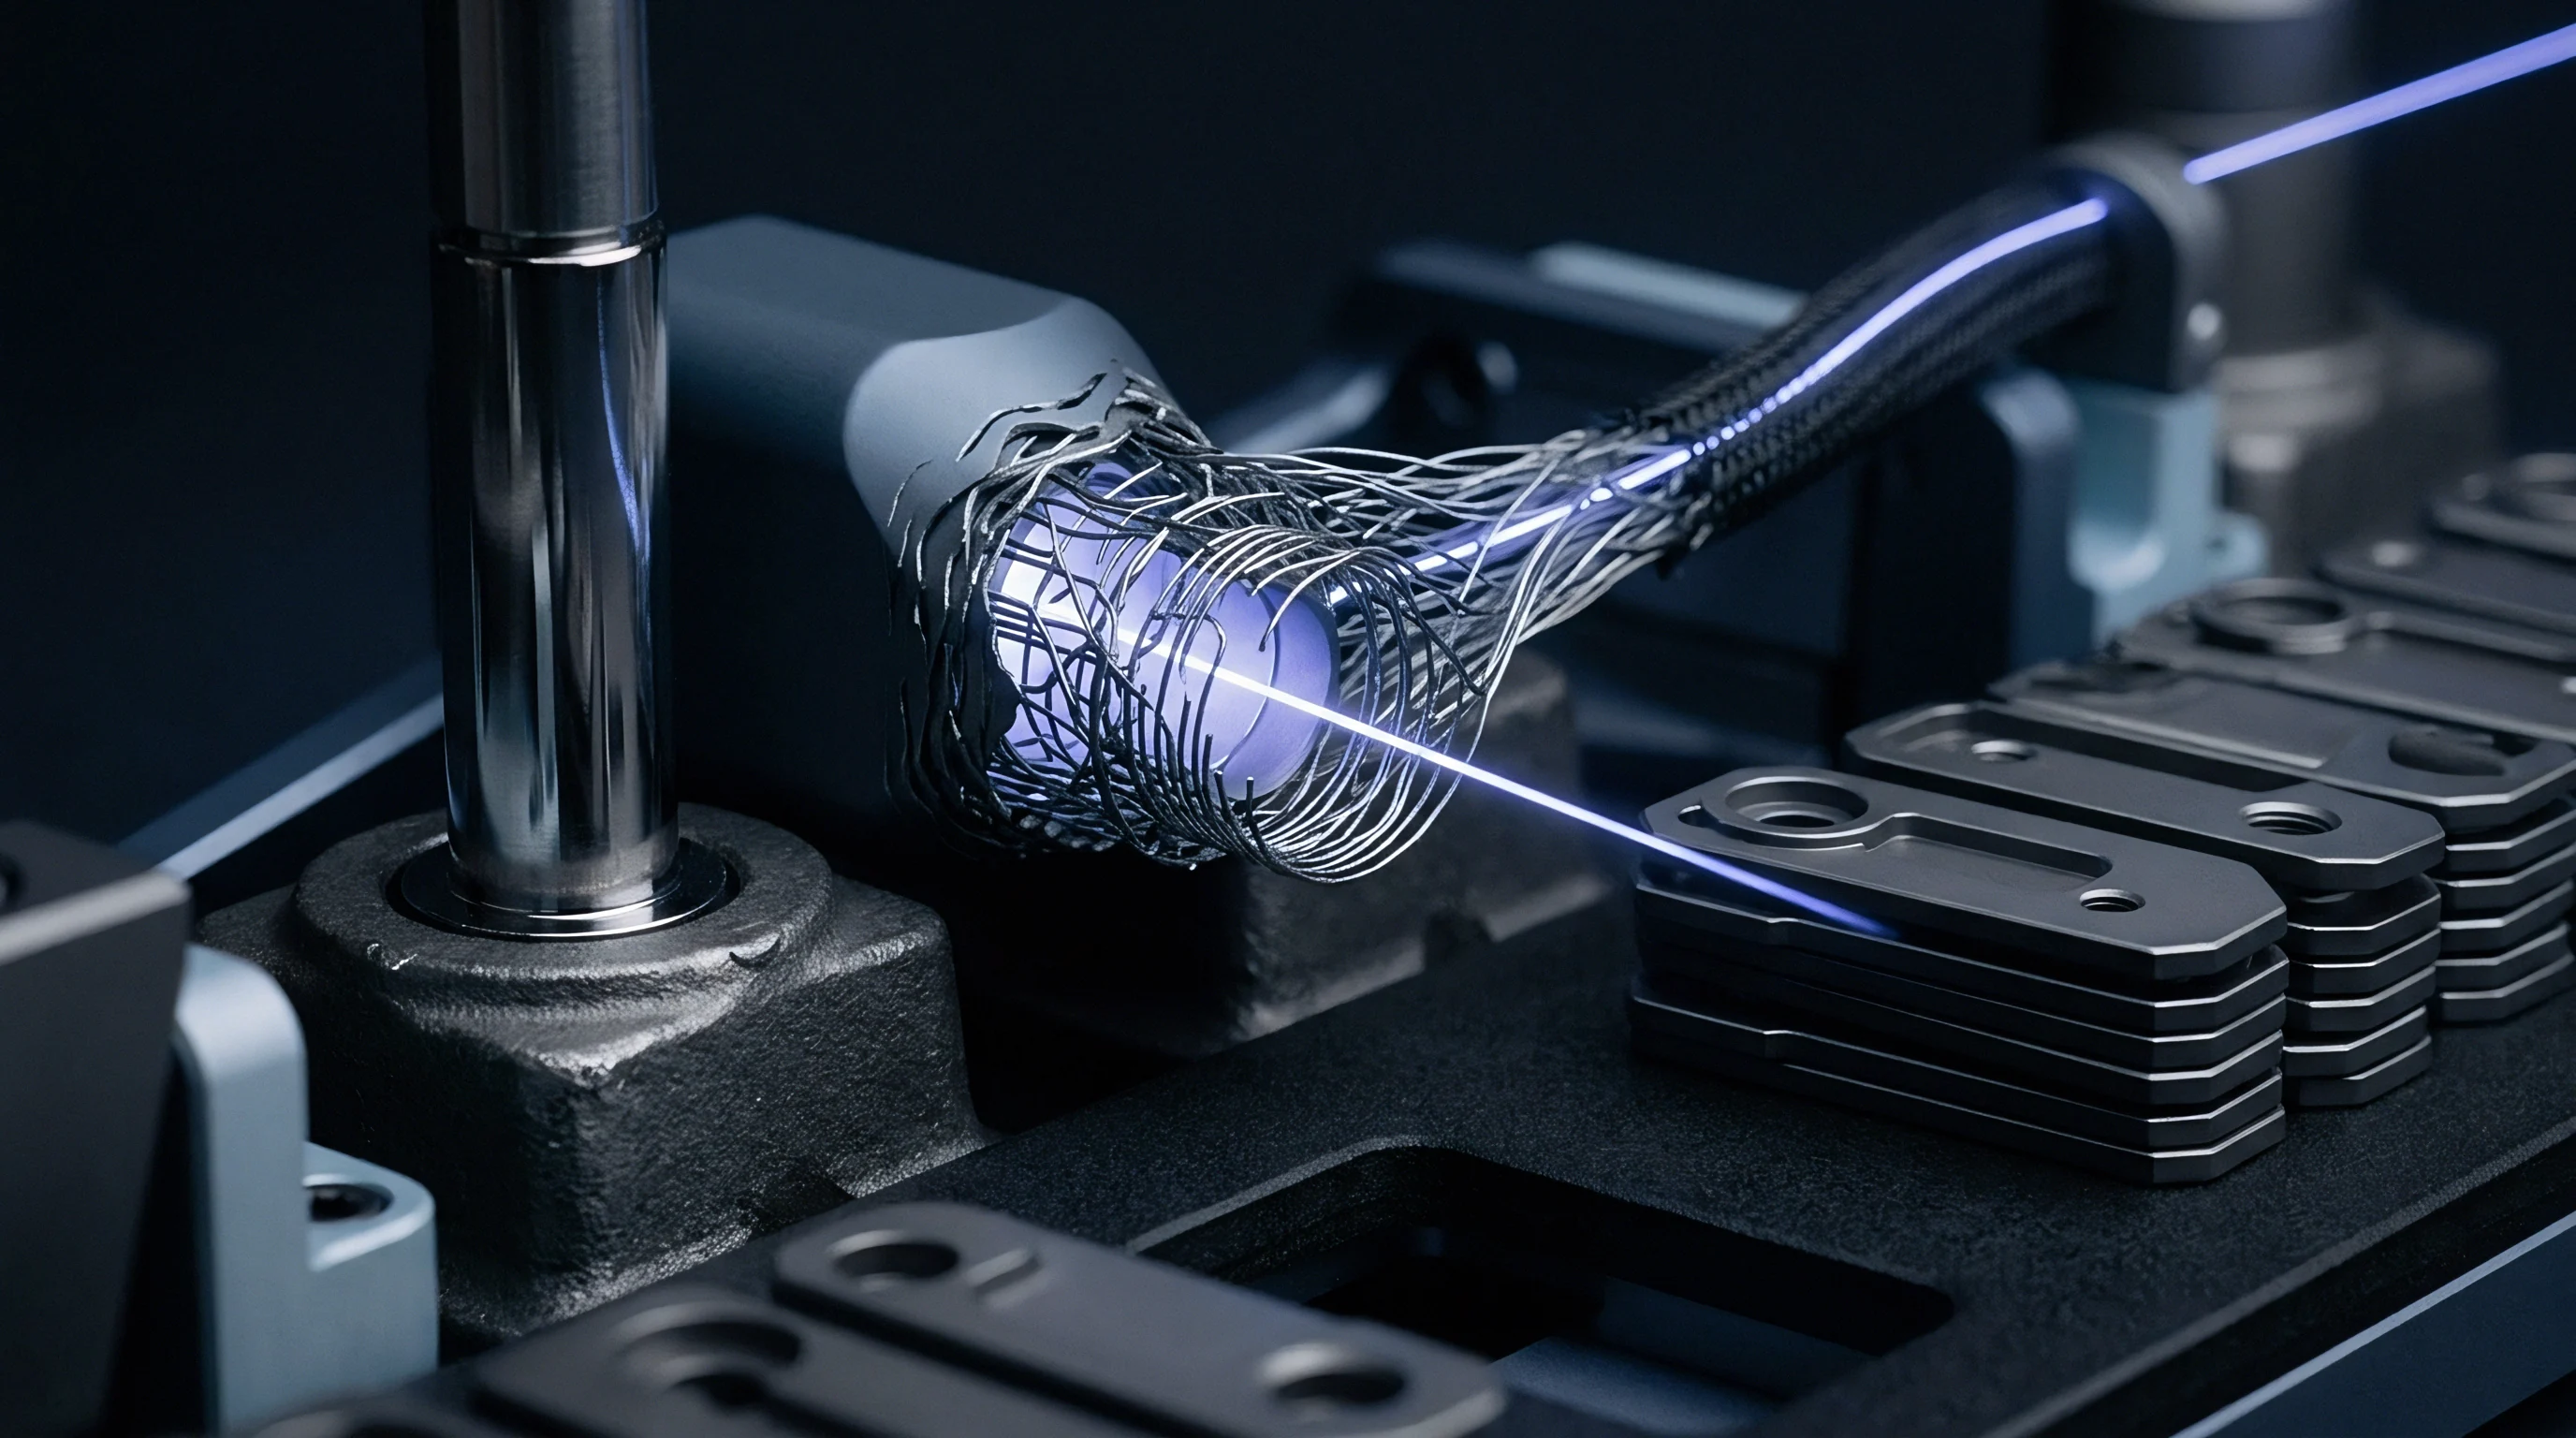
The unresolved question is whether dynamic mechanical stresses induced within internal wire bonds and package lids during prolonged single-axis shaker sweeps generate secondary thermal gradients that alter extracted rectification coefficients independently of inertial forces.

Extraction
Isolating quadratic cross-coefficients demands a structured progression through discrete single-frequency dwell profiles. Broadband random excitation obscures frequency-dependent resonance peaks, blending squeeze-film dampening effects with electrical anti-aliasing filter attenuations. Testing across single frequencies exposes the exact mechanical resonance where cross-axis rectification peaks.
At resonance, cross-axis energy couples into the primary sense comb with maximum mechanical amplification. Centering errors distort output signals.
The mathematical extraction requires decoupling the steady-state DC offset delta_A_i from the raw output. When axis j experiences sinusoidal vibration A_j(t) = A_peak sin(omega t), the instantaneous input squared produces a constant term equal to 0.5 (A_peak)^2 plus an oscillatory term at 2 omega. Low-pass filters in the digital signal chain eliminate the 2 omega ripple, leaving a net DC shift equal to 0.5 K_jj (A_peak)^2.
Raw residuals expose the offset.
Under 12 g RMS random vibration spanning 50 Hz to 2 kHz, an uncorrected cross-axis rectification coefficient of 1.4 mg per g squared shifts the estimated gravity vector by 11.8 milliradians.
Extracting the cross-coupling coefficient K_ij requires simultaneous two-tone or dual-axis excitation. Applying vibration along axis i at frequency omega_1 and along axis j at frequency omega_2 generates intermodulation products. The joint cross term A_i(t) A_j(t) expands into sum and difference frequencies: 0.5 A_peak_i A_peak_j.
When omega_1 equals omega_2 with an active phase relationship phi, the expansion yields a direct rectification term equal to 0.5 K_ij A_peak_i A_peak_j cos(phi). By modulating the relative phase angle phi between two orthogonal shakers or resolving cross-motion on a single-axis angled mount, K_ij emerges directly from the phase-dependent DC response.

Matrix Inversion for Coefficient Identification
A linear regression framework maps observed DC bias deviations directly to input vibration power across each axis pair. Let Y be the vector of observed DC shifts across N distinct vibration test conditions. Let matrix H contain the measured vibration power terms derived from reference accelerometers, and let C be the parameter vector containing the rectification coefficients:
Y = ^T
Each row n of matrix H consists of:
Parameter vector C contains: ^T
The parameter vector solves through weighted least squares estimation:
C = (H^T W H)^(-1) H^T W Y
Weighting matrix W incorporates the inverse variance of measurement noise across individual frequency steps. Because mechanical shakers experience higher harmonic distortion at low frequencies and reduced displacement amplitudes at high frequencies, setting W proportional to reference signal purity prevents distorted drive conditions from biasing the extracted parameters. Harmonic distortion corrupts cross coupling.

Worked Extraction Sequence with Stated Assumptions
Consider a triaxial surface-micromachined capacitive accelerometer under test for downhole drilling orientation. Assume an operating temperature held constant at 25 degrees Celsius within a thermal chamber mounted to the shaker. Assume reference sensors establish shaker transverse cross-axis motion at exactly 3.2 percent of primary drive amplitude during Y-axis excitation.
Primary vibration frequency is set to 400 Hz at an amplitude of 10.0 g peak (50.0 g^2 power).
During excitation along the fixture Y-axis, reference sensors measure true excitation power terms: (A_y)^2 = 50.0 g^2, (A_x)^2 = 0.0512 g^2, and cross power (A_x A_y) = 1.60 g^2. The observed DC shift along the Z-axis output is 24.5 milli-g. Inverting the fixture by 180 degrees produces an observed DC shift of 23.9 milli-g.
Averaging the spatial orientations eliminates residual odd-order terms, yielding a net even-order rectified DC shift delta_A_z of 24.2 milli-g.
Next, apply excitation along the fixture X-axis at 400 Hz and 10.0 g peak. The measured power terms show (A_x)^2 = 50.0 g^2, (A_y)^2 = 0.048 g^2, and (A_x A_y) = 1.55 g^2. The resulting spatially averaged DC shift along the Z-axis output is 12.1 milli-g.
Finally, mount the sensor on a 45-degree angled wedge fixture relative to the shaker axis, driving simultaneous X and Y excitation. Shaker drive is set to 14.14 g peak, delivering nominal 10.0 g peak along both X and Y axes. Measured reference power values confirm (A_x)^2 = 50.2 g^2, (A_y)^2 = 49.8 g^2, and (A_x A_y) = 49.9 g^2.
The observed Z-axis DC shift reaches 68.4 milli-g.
Populating the linear system for Z-axis coefficients :
Condition 1: 0.0512 K_zx + 50.0 K_zy + 1.60 K_zxy = 24.2 milli-g
Condition 2: 50.0 K_zx + 0.048 K_zy + 1.55 K_zxy = 12.1 milli-g
Condition 3: 50.2 K_zx + 49.8 K_zy + 49.9 K_zxy = 68.4 milli-g
Solving the system yields the definitive cross-axis rectification coefficients for the Z channel at 400 Hz: K_zx = 0.238 milli-g per g squared, K_zy = 0.471 milli-g per g squared, and joint coefficient K_zxy = 0.655 milli-g per g squared. Third order terms remain negligible.

Residual Bias Separation under Thermal Variance
Thermal drift coexists with vibratory bias shifts throughout prolonged test sweeps. Piezoresistive and capacitive sensors exhibit temperature coefficients of bias ranging from 0.1 to 1.5 milli-g per degree Celsius. Internal power dissipation within interface application-specific integrated circuits raises die temperature during continuous high-rate sampling.
Stiffness varies with thermal load.
Separating thermal bias from vibration rectification requires steady-state thermal soaking prior to every vibration dwell. Real-time temperature sensors integrated directly onto the accelerometer die provide thermal telemetry. By maintaining zero vibration for sixty seconds before and after each vibration burst, the baseline thermal trajectory is interpolated using a cubic spline.
Subtracting this interpolated thermal curve from the raw output during vibration leaves the pure inertially induced rectification signal.
| Excitation Frequency (Hz) | Drive Axis | Sense Axis | Input Level (g RMS) | Linearity R^2 | Coefficient (micro-g/g^2) | Uncertainty (+/- micro-g/g^2) |
|---|---|---|---|---|---|---|
| 100 | Y | Z | 5.0 | 0.998 | 142.3 | 4.2 |
| 500 | Y | Z | 10.0 | 0.994 | 285.7 | 8.5 |
| 1200 | Y | Z | 15.0 | 0.989 | 612.4 | 18.1 |
| 2400 (Resonance) | Y | Z | 10.0 | 0.971 | 1840.0 | 65.0 |
| 3500 | Y | Z | 5.0 | 0.992 | 310.2 | 11.4 |
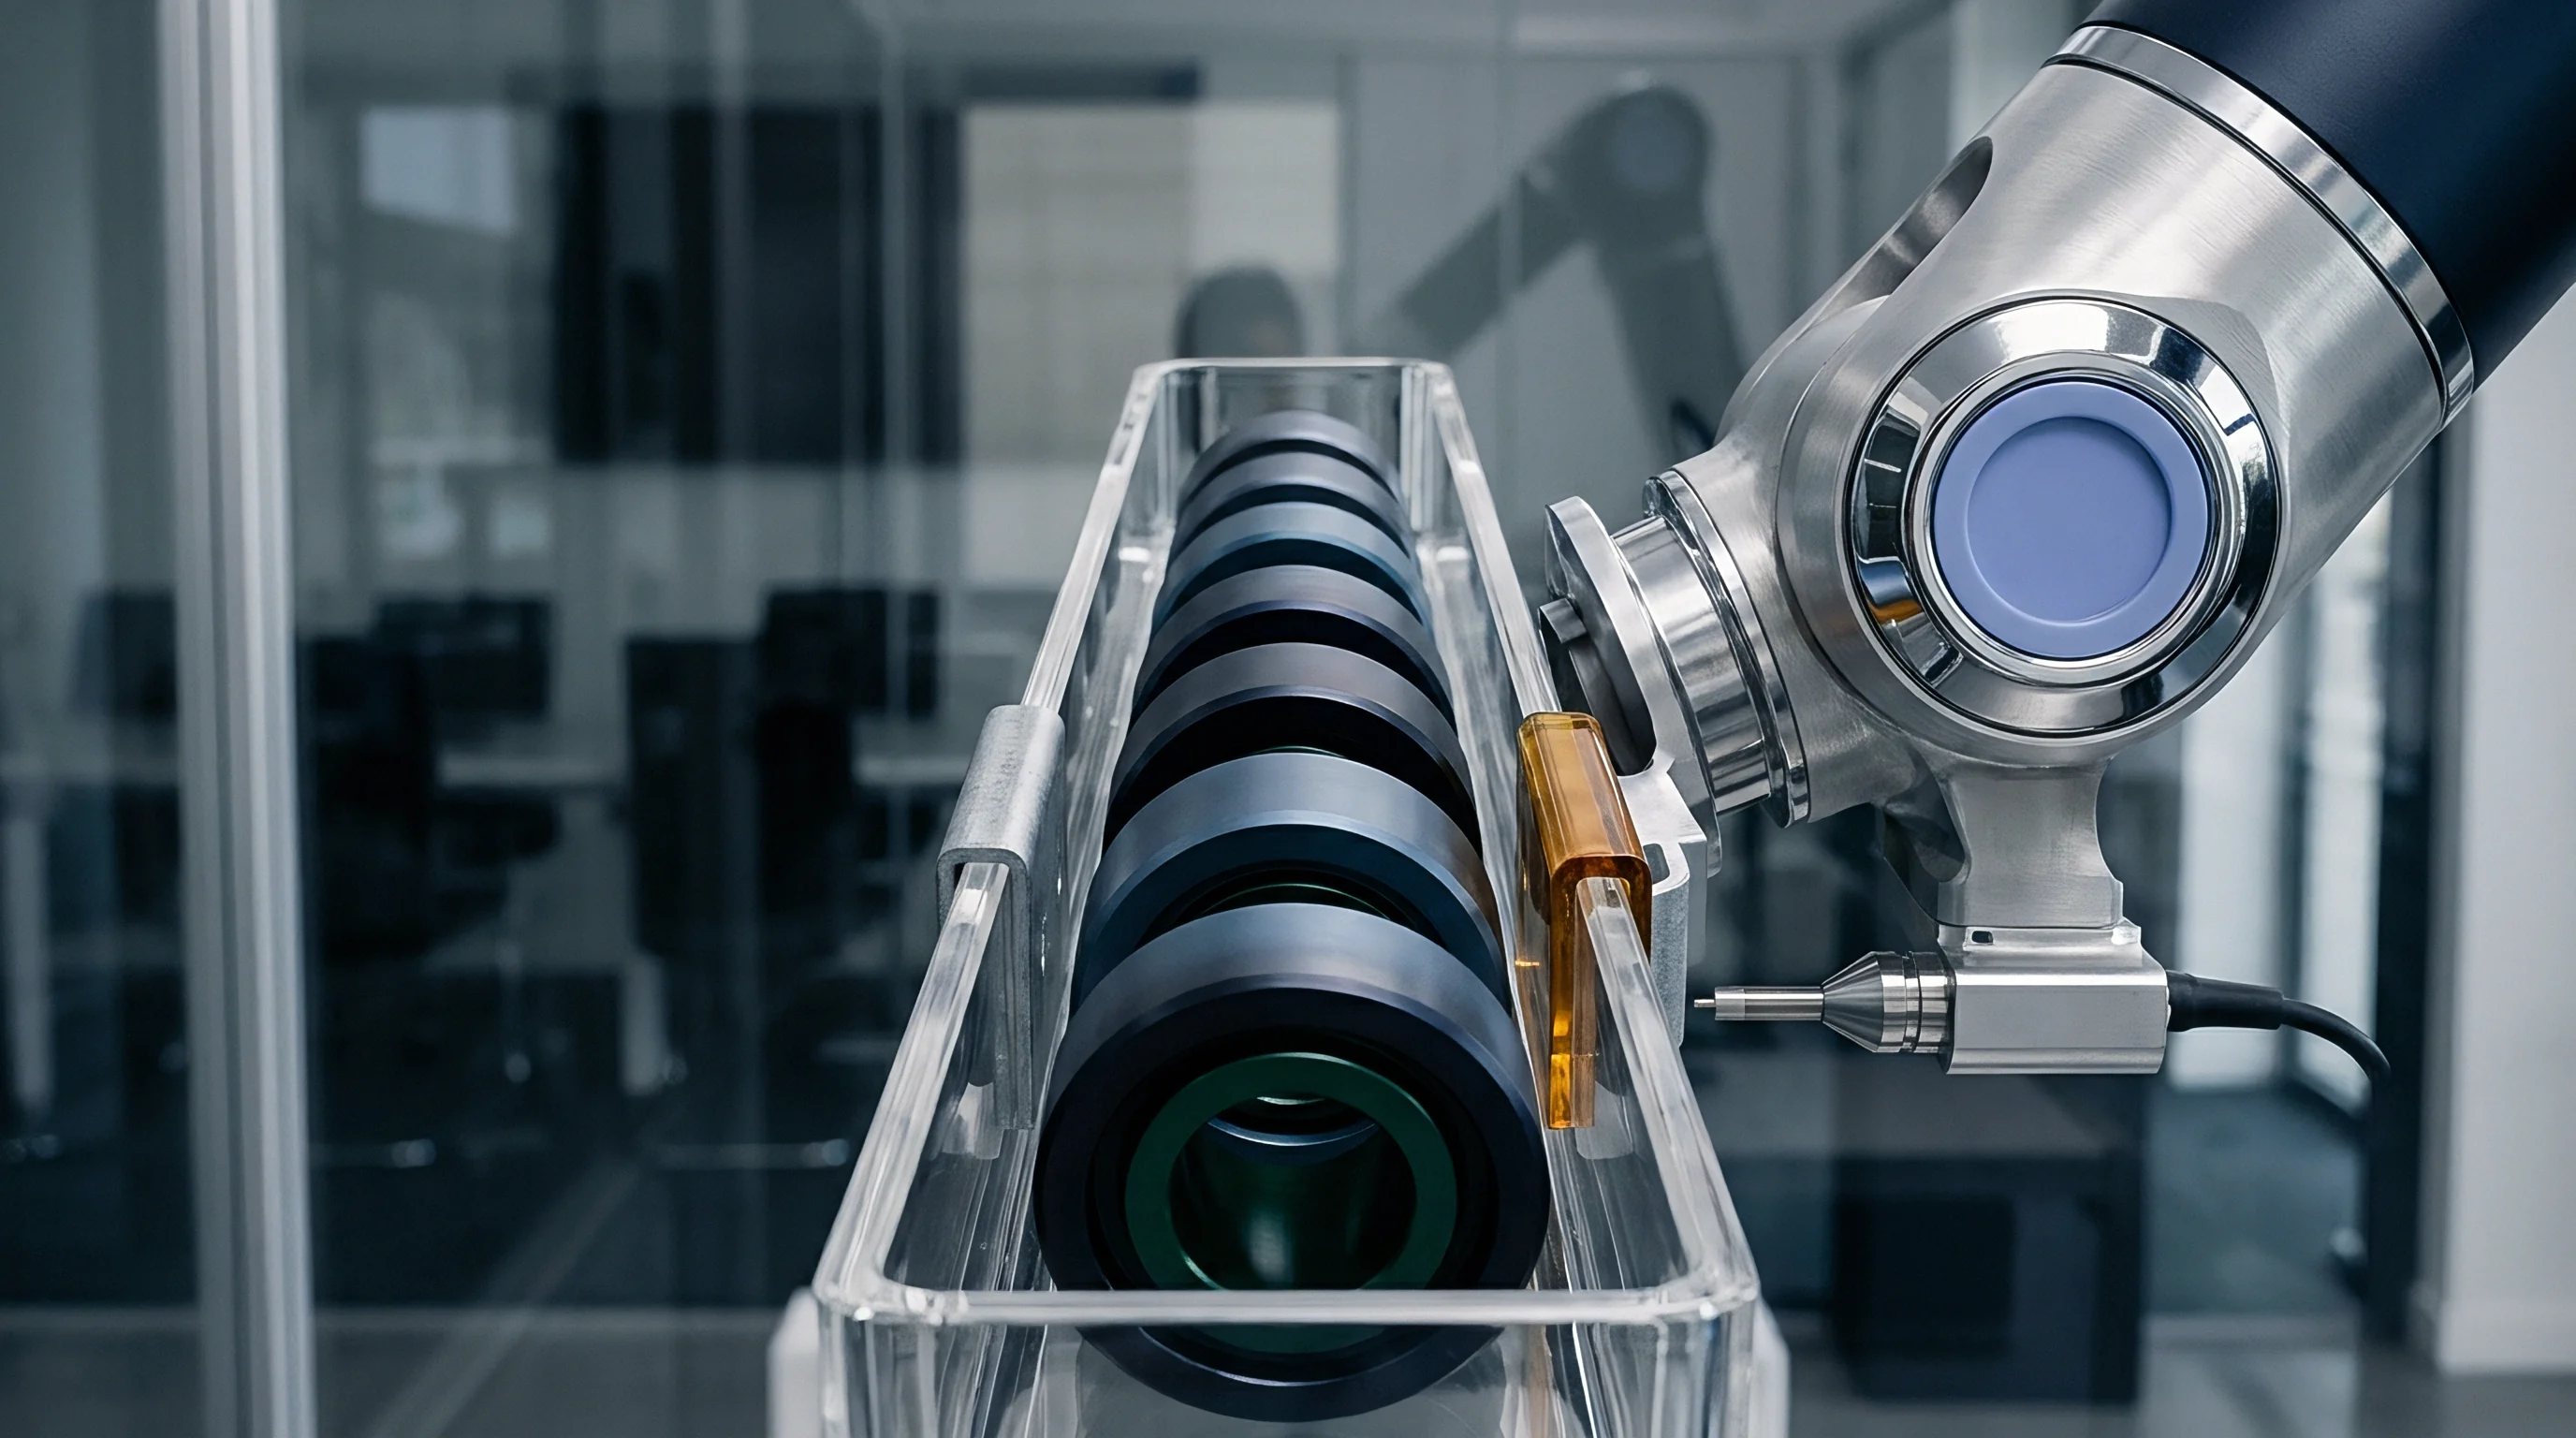
Extraction routines that verify coefficient stability across both positive and negative drive amplitudes confirm the structural symmetry of internal flexures before parameters enter compensation lookup registers.
Correction
Real-time gravity estimation pipelines process raw triaxial acceleration streams through digital tilt algorithms. When dynamic machinery vibrates continuously, static tilt estimation algorithms interpret rectified DC offsets as angular inclination. In an inclinometer tracking the vertical axis using arcsine or arctangent relations, an artificial DC offset delta_A_z induces an angular calculation error: delta_theta = delta_A_z / (1.0 g cos(theta)).
At small tilt angles, a rectification shift of 10 milli-g translates directly into a 0.57-degree orientation error. Linearity breaks past fifty gravities.
Compensation structures operate in either feedforward frequency-domain blocks or state-space filtering algorithms. Feedforward cancellation requires broadband auxiliary sensing or wideband primary channels that record high-frequency vibration signals before internal low-pass filters eliminate them. If the primary sensor digital filter decimates raw samples at 100 Hz, vibratory rectification generated at 800 Hz has already entered the DC band and cannot be separated downstream.
Firmware filters must access wideband spectral energy.

Feedforward Bias Compensation in Attitude Estimation
Inertial measurement routines subtract estimated vibration-induced biases prior to pitch and roll trigonometric calculations. A dual-path signal processing topology preserves high-frequency dynamics specifically for bias prediction. The primary path directs acceleration through an anti-aliasing filter and decimation stage to supply low-noise quasi-static signals to the attitude estimator.
The secondary path directs raw, undecimated high-frequency acceleration signals into a root-mean-square power calculation block.
The estimated rectification vector delta_A_corr calculates continuously from the extracted coefficient tensor K and the measured high-frequency power vector P(t):
delta_A_corr_z(t) = K_zx P_x(t) + K_zy P_y(t) + K_zxy P_xy(t)
This computed offset subtracts directly from the low-frequency acceleration output before gravity vector calculation: A_corrected_z = A_decimated_z – delta_A_corr_z. By updating P(t) at rates matching the vibration envelope variations, feedforward structures remove up to ninety percent of vibration-induced DC drift.
Mechanical stiffeners shifting structural resonances above the sensor cutoff suppress rectification more reliably than firmware filters.
Does Real Time Compensation Prevent Filter Divergence?
Attitude filters maintaining covariance bounds on external accelerations reject transient disturbances while admitting sustained rectification bias. In an extended Kalman filter designed for dynamic tilt, external acceleration vectors are modeled as zero-mean white Gaussian processes. When continuous machinery vibration generates a non-zero mean rectification offset, the filter cannot observe the discrepancy between true gravity and rectified bias.
Attitude filters diverge under bias.
Integrating extracted rectification coefficients into the Kalman measurement update restores innovation sequence zero-mean characteristics. The measurement model explicitly augments the state transition matrix with the power-dependent rectification model. As high-frequency power varies, the filter expands measurement covariance along axes exhibiting elevated cross-rectification coefficients, preventing the estimator from weighting corrupted gravity vectors heavily.
The operational trade-offs across compensation architectures follow specific execution boundaries:
- Wideband feedforward cancellation preserves dynamic tracking accuracy under steady vibration but demands high processor throughput and auxiliary high-speed sampling.
- Adaptive measurement covariance inflation prevents catastrophic filter divergence during severe vibration while temporarily relying purely on gyroscope dead reckoning.
- Mechanical low-pass isolation eliminates high-frequency energy prior to sensor silicon interaction, though introducing phase lag and packaging bulk.
Component vendors routinely claim that internal digital low-pass filtering completely suppresses vibration errors, omitting the physical reality that mechanical rectification occurs in the proof mass suspension long before analog-to-digital conversion takes place.


Exposure
Procurement documents routinely specify raw noise density and uncompensated cross-axis sensitivity while omitting non-linear rectification parameters. A commercial off-the-shelf triaxial accelerometer can present an exemplary noise floor of 25 micro-g per root hertz and linear cross-axis sensitivity below one percent, yet produce catastrophic orientation failures in dynamic industrial environments. When exposed to broadband mechanical vibration of 8 g RMS, uncharacterized cross-axis rectification coefficients generate upwards of 35 milli-g of artificial DC acceleration.
Unscreened batches fail field audits.
Silicon foundry variations exacerbate this commercial exposure. Deep reactive-ion etching rates vary across wafer diameters, creating systematic gradient shifts in comb finger sidewall verticality from center dies to wafer edge dies. A single fabrication lot yields components whose cross-axis rectification coefficients vary by more than three hundred percent.
Without explicit screening steps, purchasing teams source pin-compatible sensors that pass static qualification tests but fail unpredictably inside customer end products.
Datasheet Omissions and Manufacturer Screening
Standard factory test flows evaluate linear scale factor and bias over temperature on static rate tables. High-volume automated test equipment rarely integrates multi-axis high-frequency electrodynamic shakers due to mechanical wear and test cycle duration constraints. As a result, datasheets quote vibration rectification error as a single typical scalar under a narrow single-axis vibration condition, or omit cross-axis vibration terms entirely.
Automotive qualifications under AEC-Q103-002 establish rigorous stress durability standards, yet fail to mandate operational measurement accuracy limits under simultaneous orthogonal vibration. The buyer assumes the burden of qualification. Sourcing organizations must implement incoming sample auditing protocols to benchmark cross-axis coefficient distributions across delivered batches.
| Sensor Grade | Unit Cost (USD) | Published VRE Specification | Batch VRE Coefficient Variance | Screening Burden |
|---|---|---|---|---|
| Consumer grade MEMS | 0.80 to 2.50 | Omitted entirely | Exceeds 400 percent | Full incoming lot characterization required |
| Industrial high-stability | 18.00 to 65.00 | Single-axis typical scalar only | 150 to 250 percent | Statistical sample shaker auditing required |
| Automotive safety integrity | 8.50 to 24.00 | Single-axis maximum bound | 80 to 120 percent | Lot trace data review and audit check |
| Tactical grade navigation | 450.00 to 1800.00 | Full tensor guaranteed across temperature | Below 25 percent | Factory test dossier acceptance verification |

Commercial Sourcing Terms for Vibration Resilient Silicon
Purchase orders specifying high-vibration inertial units require explicit clauses defining maximum permissible DC offset shifts under defined spectral energy. Contracts relying on generic statements of suitability fail to provide legal or financial recourse when sensor outputs drift under field vibration. Procurement teams must integrate specific technical appendices into supply agreements to secure warranty coverage.
Supply agreements incorporating acceptance criteria linked directly to IEEE 1293 standard test methods enforce supplier accountability, ensuring that lots exhibiting cross-axis rectification coefficients above agreed thresholds face immediate commercial rejection at incoming inspection.