Characterizing Low-Frequency Noise across Temperature Variations in Sensor Front-Ends
Characterizing front-end low-frequency noise across temperature requires isothermal shielding and multi-temperature spectral extraction to bound 1/f drift.
Charge
A piezoresistive pressure sensor element idling at 25 degrees Celsius yields an input-referred noise voltage density of 18 nV/√Hz at 1 Hz, yet driving that same silicon die to 125 degrees Celsius quadruples the spectral density to 74 nV/√Hz without shifting the excitation voltage. The physics governing this rise originates in the stochastic exchange of mobile charge carriers with defect states in the semiconductor lattice. In low-frequency regimes between 0.01 Hz and 100 Hz, flicker noise dominates the front-end amplifier stage.
Two distinct physical mechanisms drive this phenomenon: carrier density fluctuations described by the McWhorter model and mobility fluctuations formulated by Hooge. Silicon traps behave dynamically. In surface-channel metal-oxide-semiconductor field-effect transistors, trapping and detrapping of carriers into border traps within the silicon dioxide gate dielectric control the 1/f noise spectrum.
Because these traps exhibit a distributed range of activation energies, thermal variation re-weights the active trap distribution, shifting the noise magnitude and tilting the spectral slope from the classic 1/f response into 1/fγ, where γ departs from unity as the ambient temperature sweeps between -40 degrees Celsius and 125 degrees Celsius.
Semiconductor Interface Trapping Mechanics
Thermal activation changes the capture cross-section and characteristic emission time constants of localized lattice states. When a sensor front-end operates at cryogenic boundaries such as -40 degrees Celsius, high-energy oxide traps freeze out, leaving only shallow defect levels to modulate the inversion layer. As temperature climbs, deeper trap states become energetically accessible to conduction electrons.
This mechanism introduces discrete Lorentzian humps into the frequency domain, a phenomenon known as random telegraph signal noise. When multiple discrete traps activate across an expanded die temperature range, the superposition of their distinct Lorentzian spectra creates the observed flicker noise floor.
| Device Technology | Temperature Band | Voltage Density at 1 Hz | Corner Frequency | Spectral Slope (γ) |
|---|---|---|---|---|
| Silicon BJT (Differential Pair) | -40 °C | 1.8 nV/√Hz | 8 Hz | 1.02 |
| Silicon BJT (Differential Pair) | 25 °C | 2.1 nV/√Hz | 12 Hz | 1.00 |
| Silicon BJT (Differential Pair) | 125 °C | 4.2 nV/√Hz | 38 Hz | 0.94 |
| CMOS Input (W/L = 1200/2) | -40 °C | 22.0 nV/√Hz | 1.2 kHz | 1.15 |
| CMOS Input (W/L = 1200/2) | 25 °C | 28.4 nV/√Hz | 1.8 kHz | 1.03 |
| CMOS Input (W/L = 1200/2) | 125 °C | 82.6 nV/√Hz | 7.4 kHz | 0.88 |
| Silicon JFET (Matched Pair) | -40 °C | 3.8 nV/√Hz | 18 Hz | 1.01 |
| Silicon JFET (Matched Pair) | 25 °C | 4.2 nV/√Hz | 22 Hz | 0.99 |
| Silicon JFET (Matched Pair) | 125 °C | 11.4 nV/√Hz | 140 Hz | 0.91 |
The empirical Hooge relation expresses low-frequency spectral density through the dimensionless parameter αH, which scales directly with the crystalline quality of the active transduction zone. In bulk silicon piezoresistive bridges, αH spans from 10-6 in pristine float-zone monocrystalline silicon to 10-3 in heavily doped polycrystalline films. Temperature alters αH by modifying lattice phonon scattering rates.
When acoustic phonon scattering governs carrier mobility at higher temperatures, the fluctuations in scattering cross-sections intensify, escalating the total voltage noise power observed across the bridge taps. Front-end designs pairing high-impedance resistive sensors with CMOS input stages face compound degradation: the bridge resistance increases thermal Johnson noise proportional to absolute temperature, while the active gate channel generates escalating flicker noise due to accelerated oxide interface exchange. Whether chemical surface passivation treatments can permanently suppress interface trap activity across five thousand thermal shock cycles remains an unresolved question in front-end reliability physics.
Topology
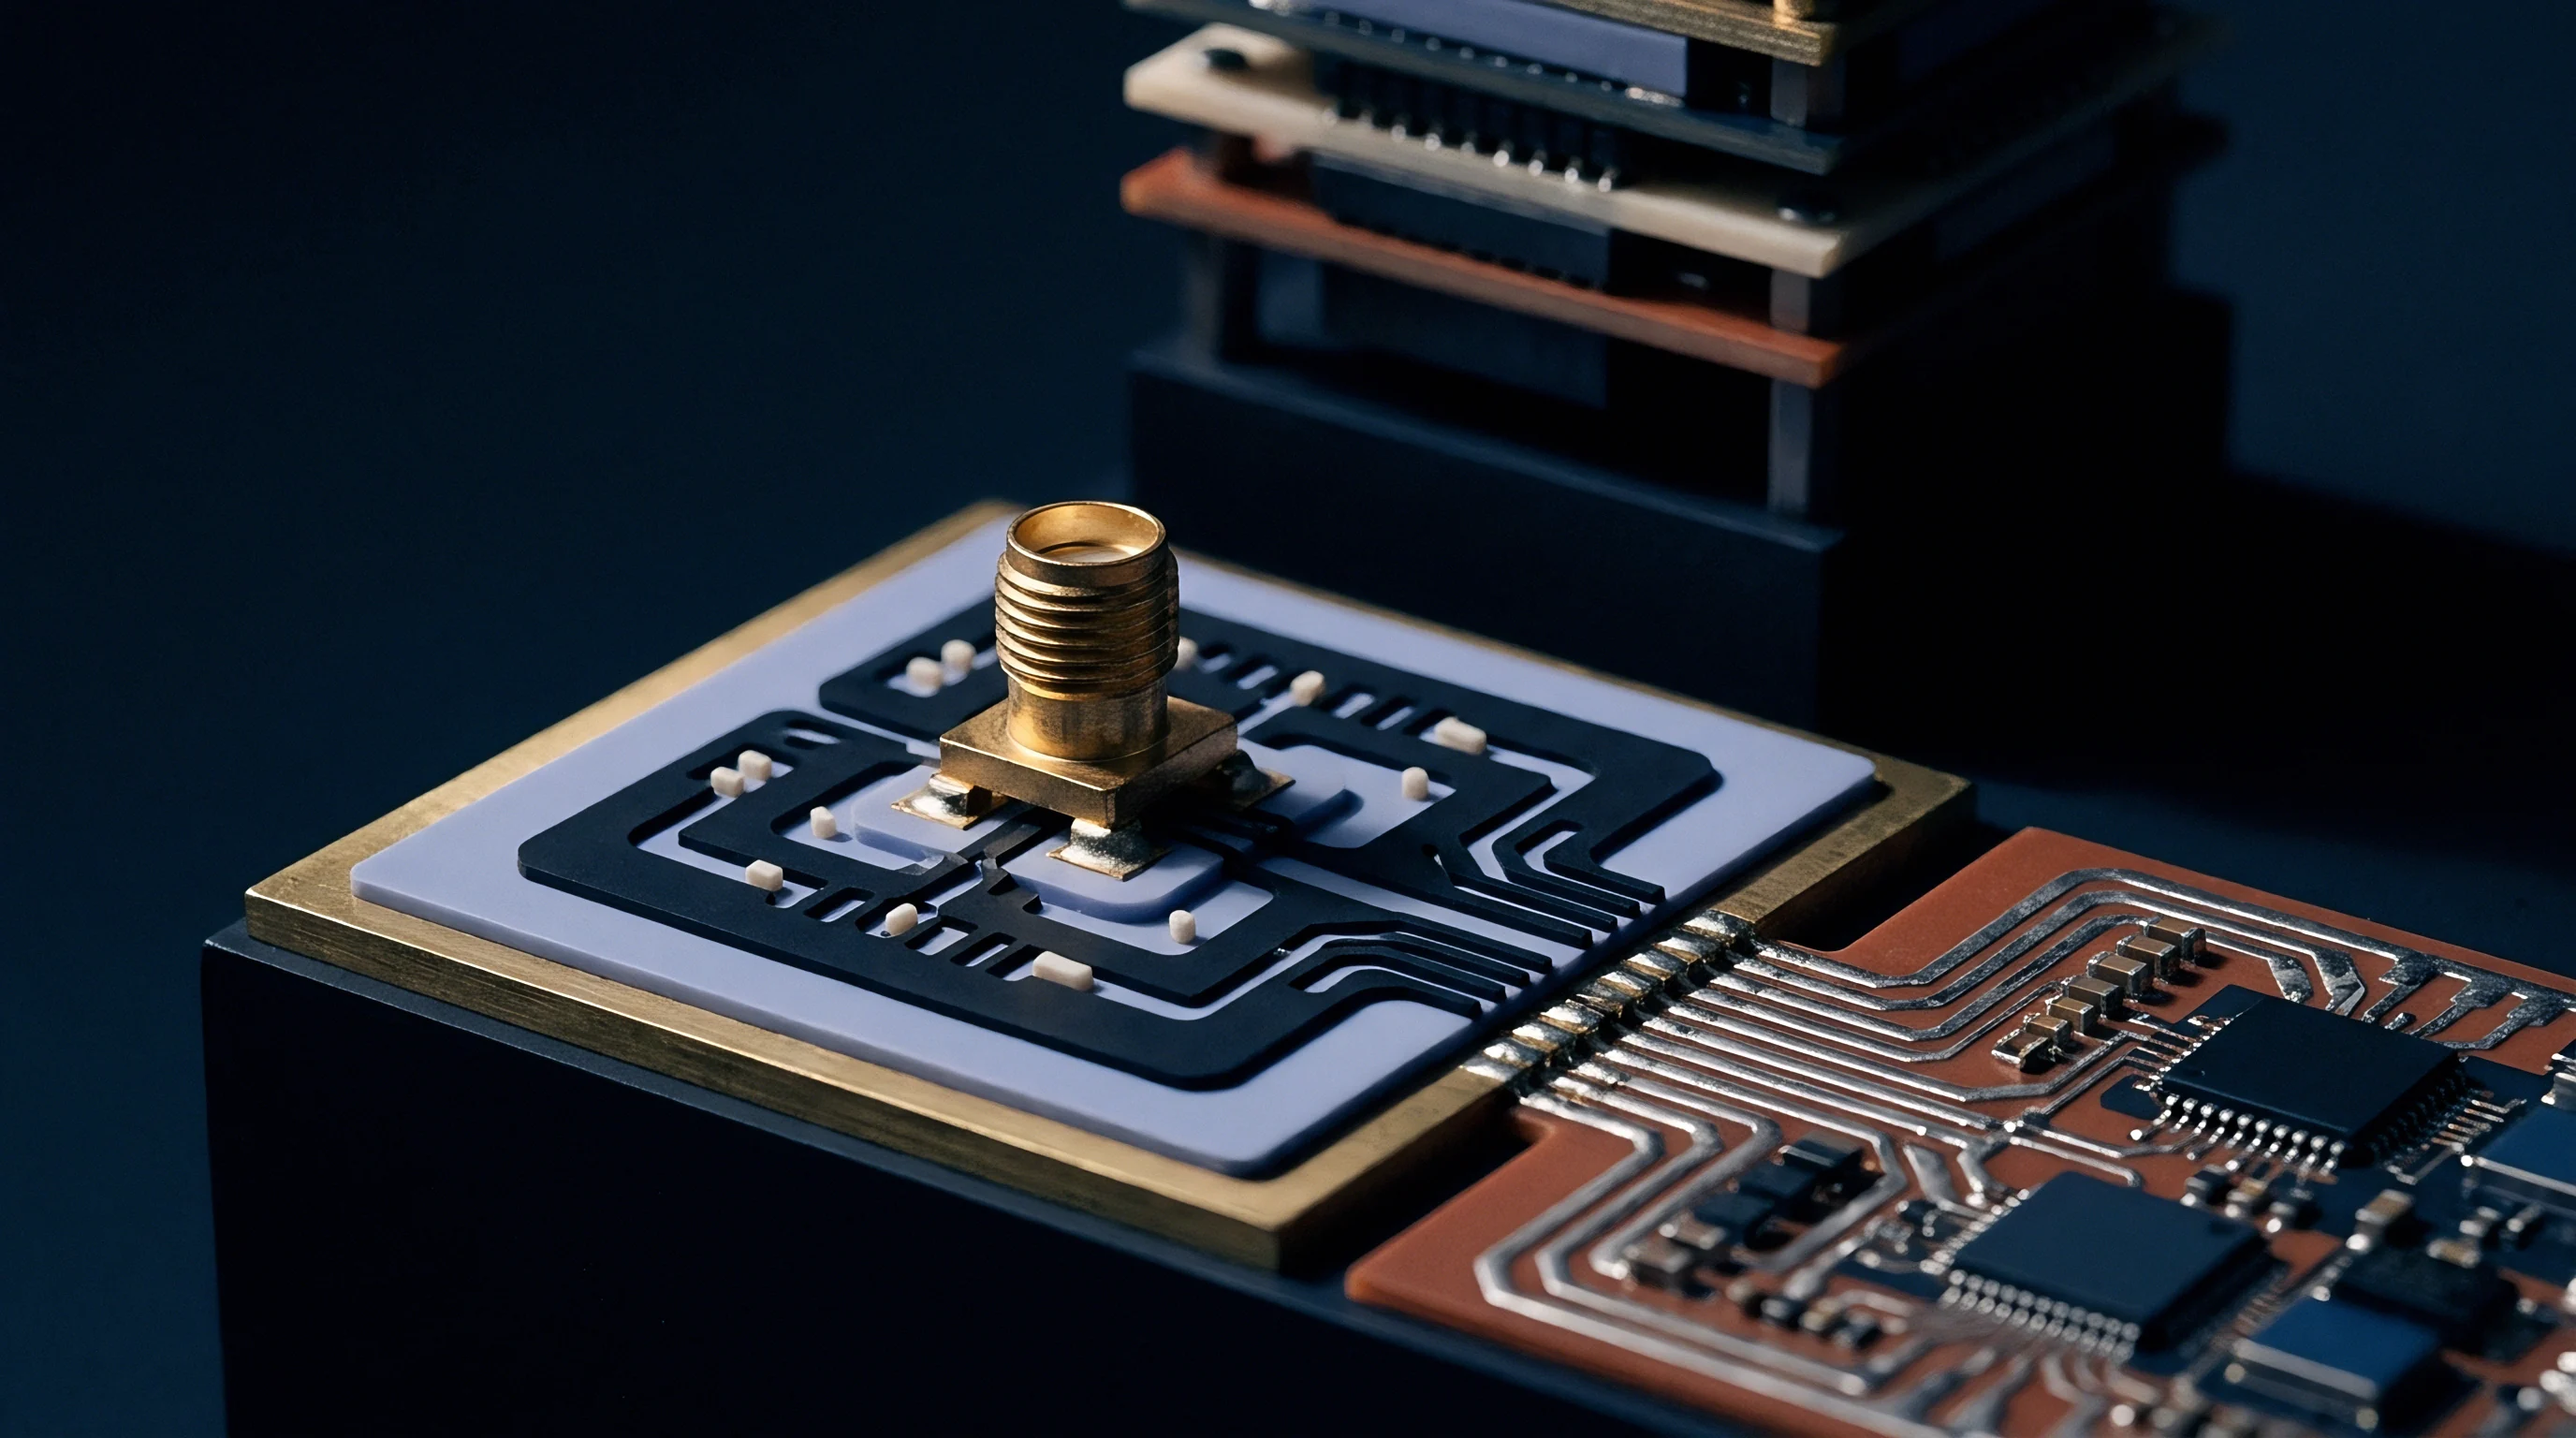
Selection of the front-end circuit architecture dictates how severely device-level noise translates into digitizer error. Differential bipolar input stages deliver low voltage noise density at room ambient, maintaining predictable thermal drift profiles when sensor impedances stay below one kilohm. Once source impedance climbs above ten kilohms, bipolar transistor base current noise — driven by the shot noise of the direct current bias — surpasses the input voltage noise contribution.
Input bias current scales with temperature as beta degrades at thermal extremes, causing the 1/f component of current noise to elevate sharply above 85 degrees Celsius. Source impedance changes the calculus.
Can Chopper Front-Ends Suppress Thermally Induced Offset Modulation?
Chopping eliminates baseband offset. The switching architecture modulates the low-frequency sensor signal to an alternating current carrier frequency, amplifies it through an alternating current coupled gain path, and demodulates it back to baseband via a synchronous rectifier. This action shifts semiconductor flicker noise to the chopping frequency, where a low-pass filter strips it from the passband.
The fundamental physical challenge shifts to non-ideal switching effects. Charge injection mismatches and clock feedthrough across the solid-state input switches generate dynamic input currents. These pulsed currents interact with transducer source impedance, translating into a direct current offset that shifts dynamically with ambient temperature.
Bipolar differential pairs maintain lower low-frequency voltage noise across elevated thermal ranges when sensor source resistance sits below one kilohm.
Dynamic offset cancellation architectures behave distinctly across thermal sweeps. Auto-zeroed amplifiers sample their own offset and low-frequency noise periodically, subtracting the sampled error from the primary signal path. This sampling operation folds wideband thermal noise back into the sub-Hertz passband through aliasing, elevating the baseband white noise floor.
Chopper-stabilized topologies avoid noise fold-back because they perform continuous-time modulation rather than discrete sampling, preserving the input stage white noise density. Residual ripple persists at baseband. At elevated temperatures exceeding 100 degrees Celsius, package parasitic impedances and printed trace leakage alter the symmetry of the modulation switches, degrading the residual offset drift from 5 nV/°C to more than 60 nV/°C.
- Gate leakage multiplication occurs in junction field-effect transistors where reverse-bias gate currents double every ten kelvins, raising current shot noise by a factor of 32 between 25 degrees Celsius and 75 degrees Celsius.
- Aliased wideband baseband folding degrades auto-zero amplifiers when broadband thermal noise folds across the sampling clock harmonics into the sub-ten-hertz measurement band.
- Thermomagnetic switch coupling generates localized odd-harmonic distortion when dynamic current pulses induce voltage drops across package bond wires subjected to thermal stress.
- Substrate carrier injection triggers parasitic substrate currents in bulk CMOS multiplexers at high operating temperatures, altering the operational transconductance of sensitive differential pairs.
Differential input routing matched to copper thermal mass prevents localized heating from tilting the front-end balance.
Bath
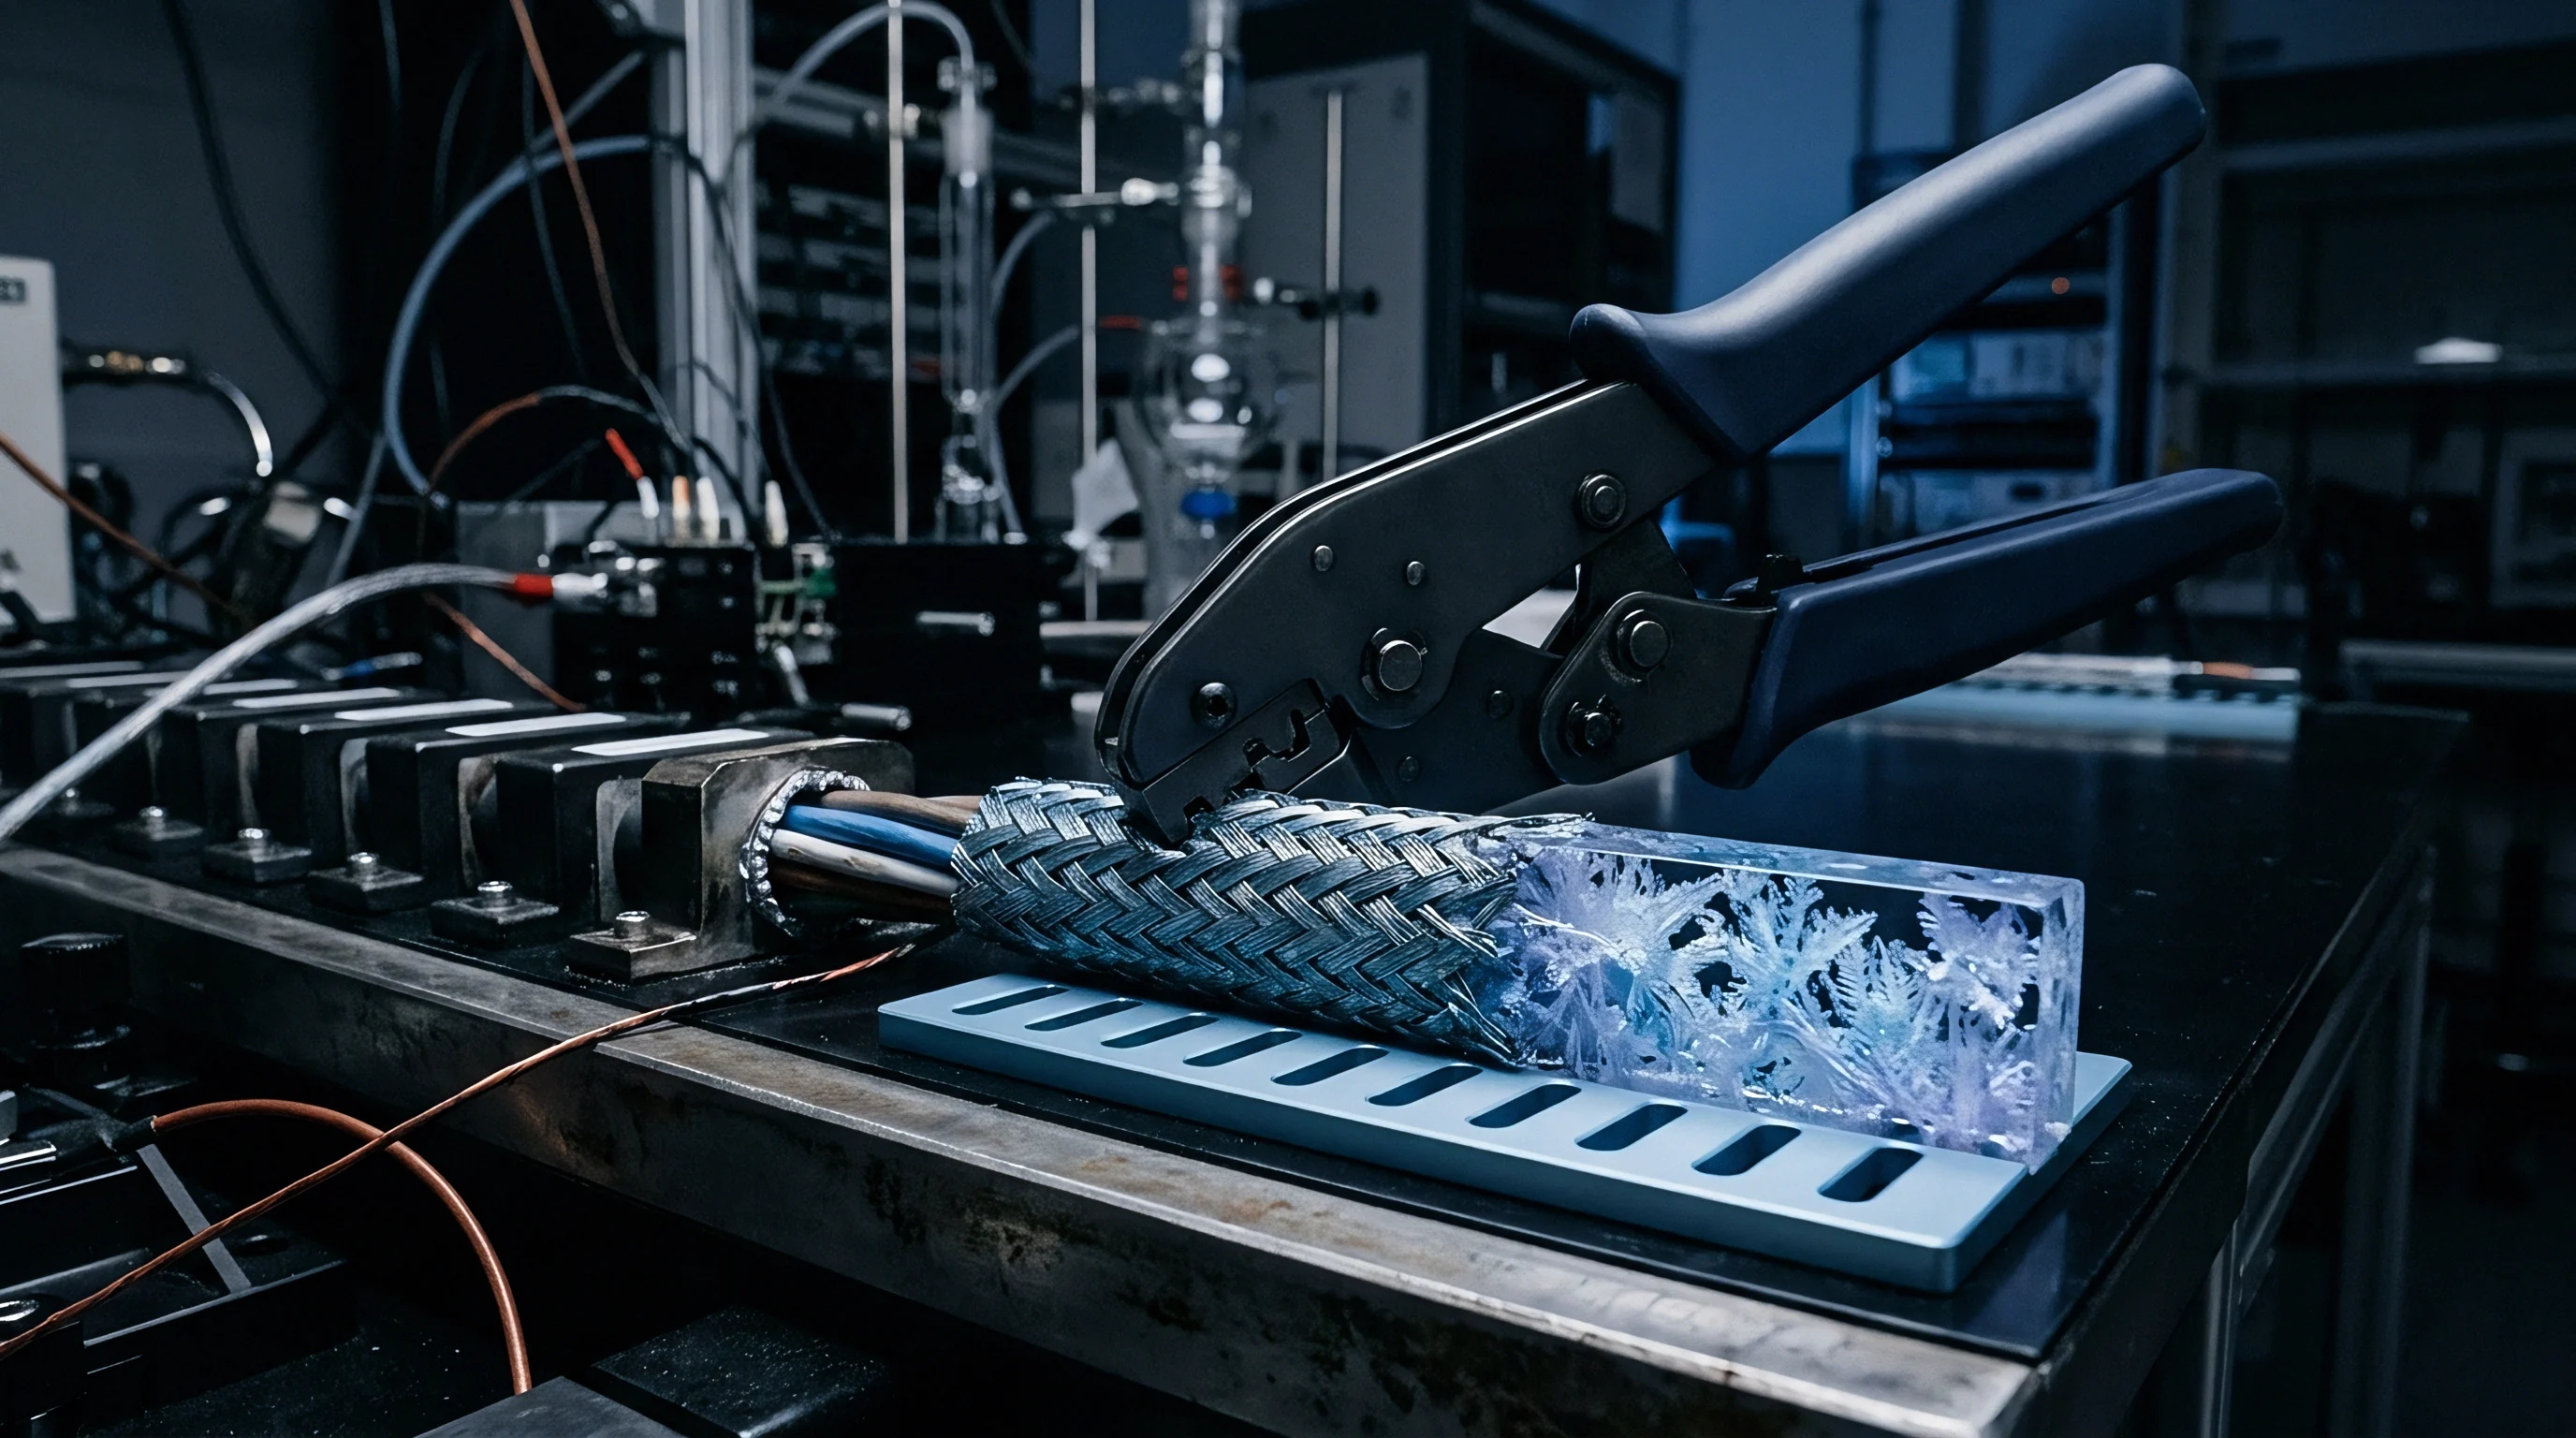
A test chamber utilizing high-velocity convective airflow creates catastrophic measurement errors during low-frequency front-end characterization. Fast air movement produces dynamic pressure differentials across circuit boards, generating microphonic noise in high-dielectric ceramic capacitors and micro-strain responses in surfacemount resistors. Convection currents distort bench readings.
The forced thermal cycling of heating elements causes localized ambient temperature fluctuations ranging from 0.05 Hz to 0.5 Hz. Front-end amplification chains read these thermal oscillations directly as thermoelectric voltages, creating artificial pink noise signatures that mask the real semiconductor noise floor.
Is Physical Temperature Cycling Sufficient to Expose Spikes?
Thermal gradients skew input stages. When dissimilar conductors join within the signal path — such as leadframe copper to tin-lead solder, or package Kovar pins to copper circuit traces — they form thermocouple junctions. The Seebeck coefficient of a standard copper-to-solder junction spans from 1.5 μV/°C to 3.5 μV/°C. A localized thermal difference of only 0.01 degrees Celsius between differential trace routes introduces an error voltage of 35 nanovolts.
If the environmental chamber modulates localized air temperature at 0.1 Hz with fractional-degree variance, the resulting thermoelectric voltage swings mimic an input-referred 1/f noise source with terrifying fidelity.
A temperature slew rate exceeding one kelvin per minute induces parasitic thermoelectric drift voltages exceeding fifty nanovolts across standard solder joints.
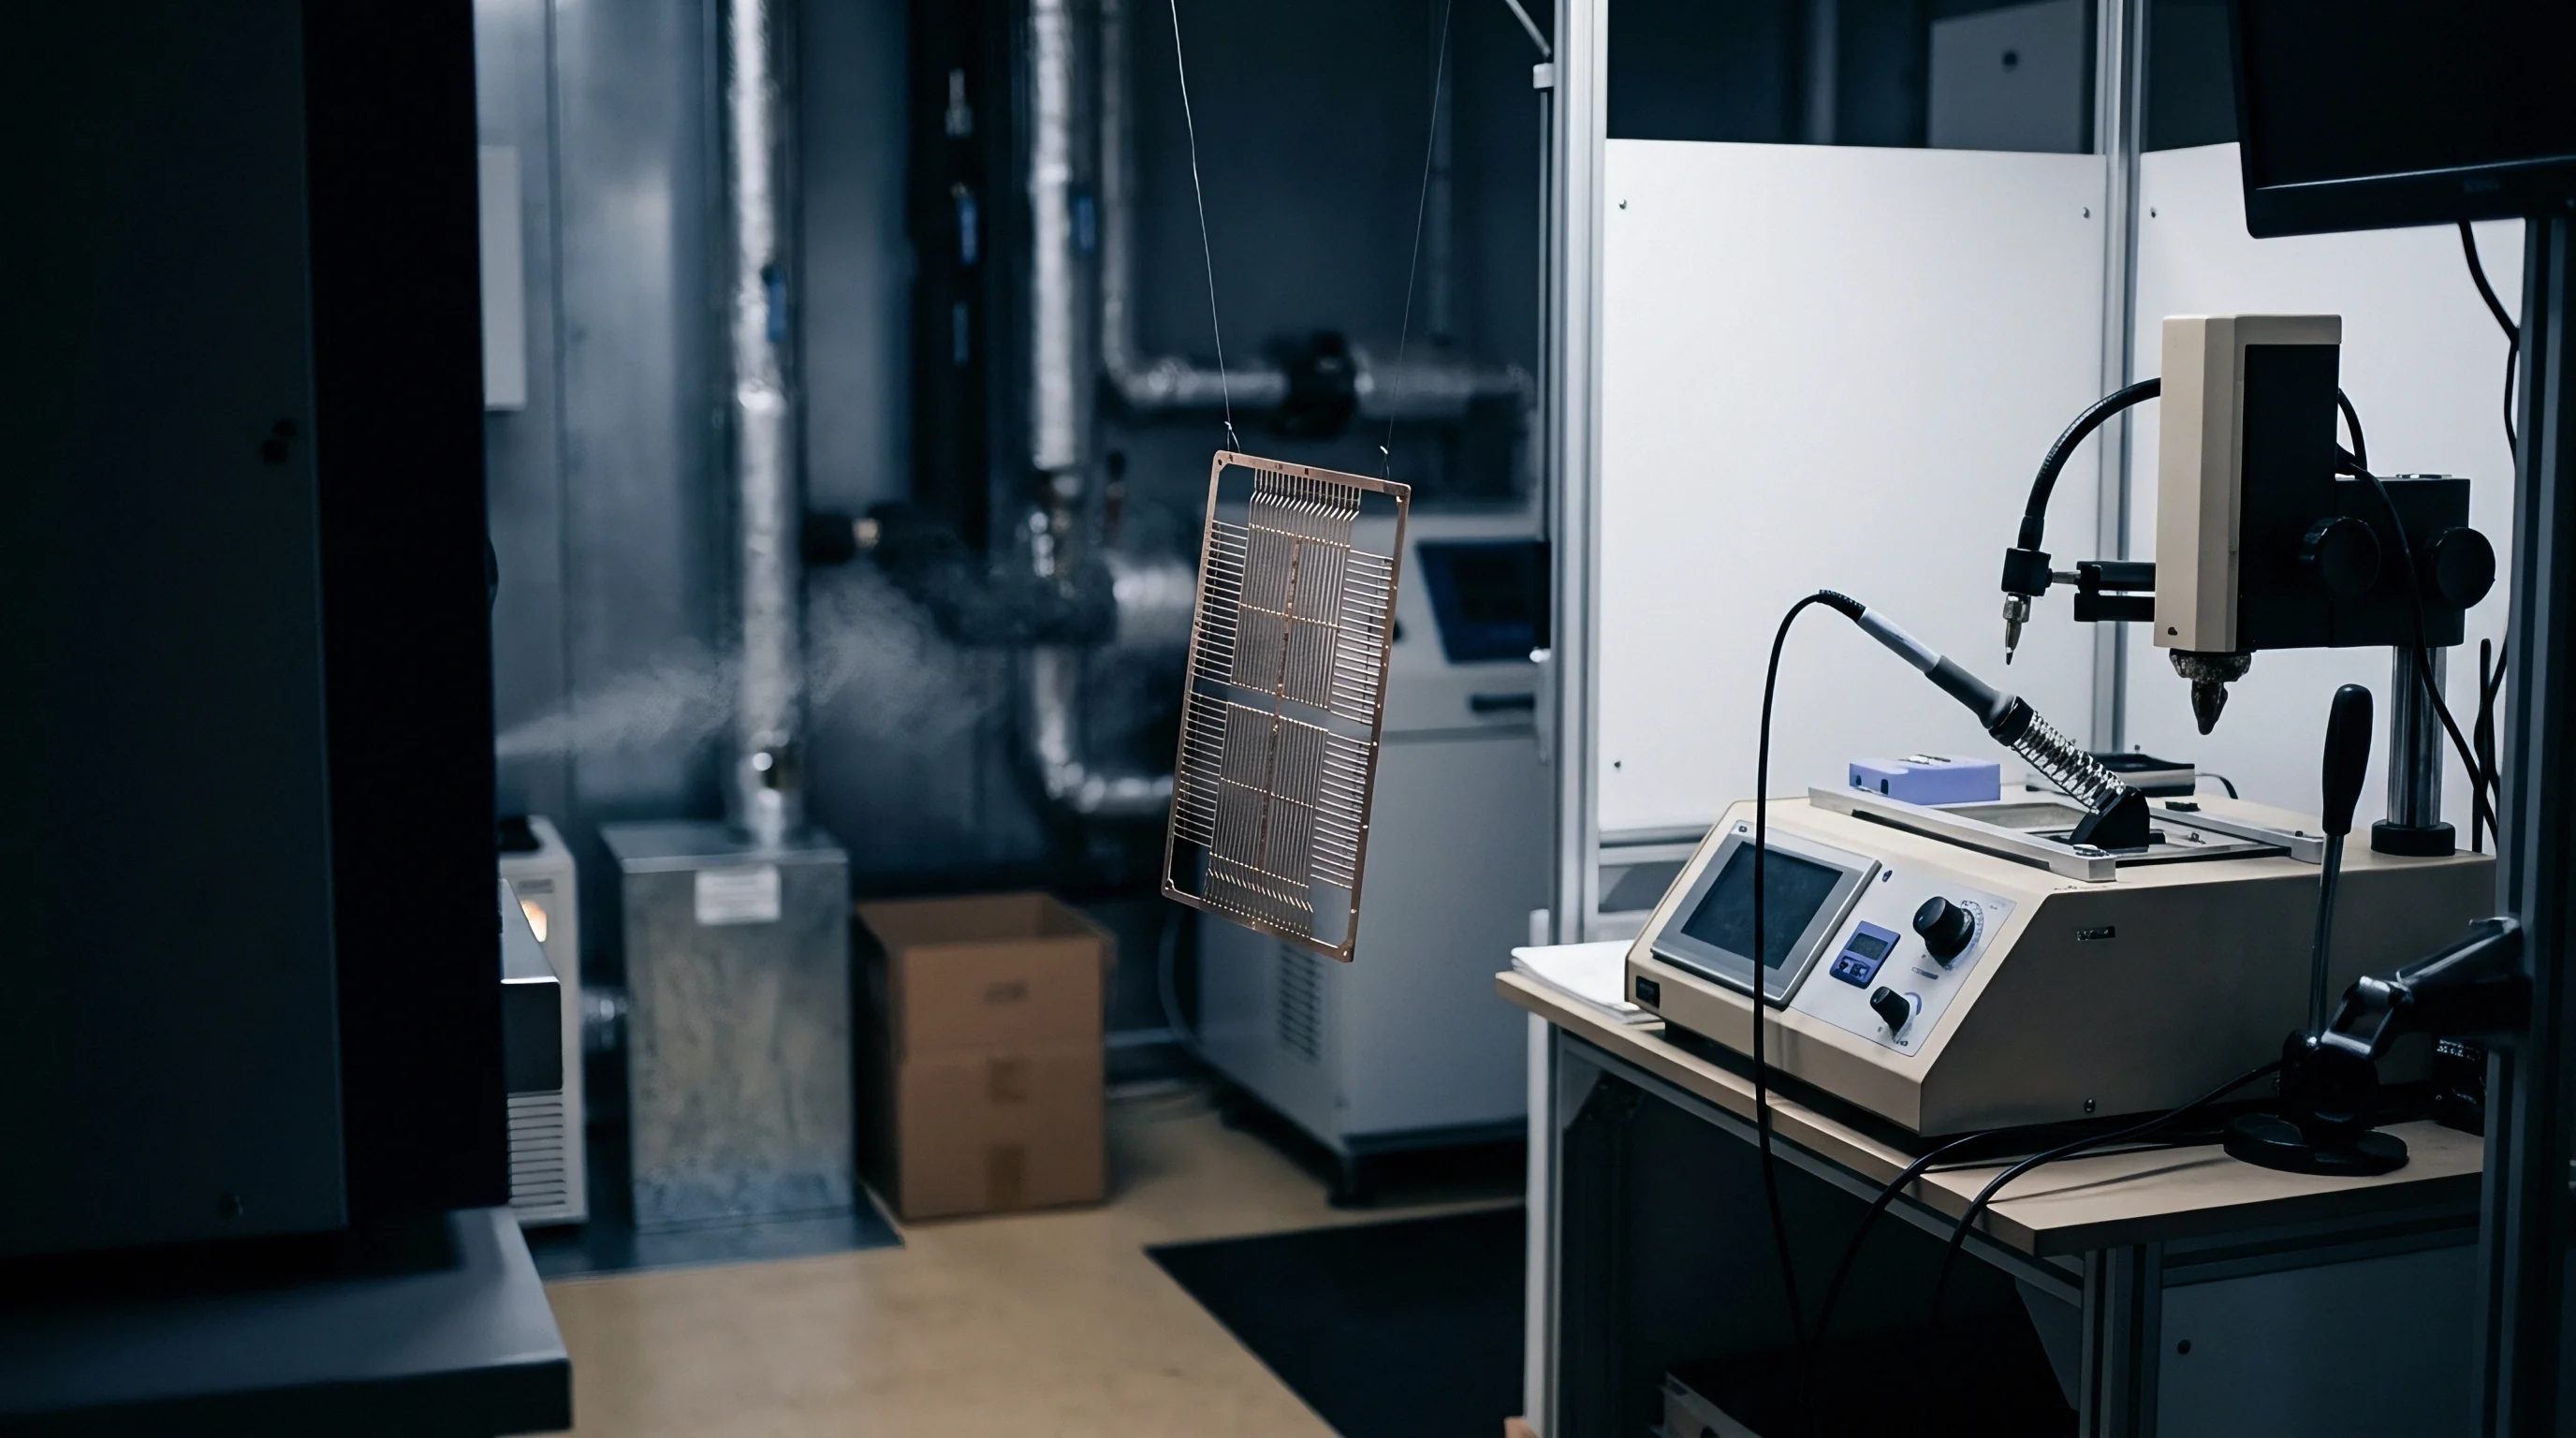
True front-end noise characterization isolates the device under test inside an isothermal housing during thermal testing. An aluminum or copper enclosure of substantial thickness acts as a thermal low-pass filter, attenuating external air turbulence. The thermal time constant of this buffer mass must satisfy the inequality τth > 100 / (2πfmin), where fmin represents the lowest frequency bin targeted in the spectral density calculation.
For measurements resolving down to 0.01 Hz, the physical enclosure and internal air column require a thermal stabilization time constant exceeding 1600 seconds. Solid-state sensors deployed in deep borehole downhole exploration rely on nested Dewar assemblies precisely to overcome these identical low-frequency convective instabilities.
| Fixturing Method | Nominal Temperature | Air Velocity | Peak-to-Peak Noise | Dominant Noise Mechanism |
|---|---|---|---|---|
| Open Air Chamber Fixture | -40 °C | 2.5 m/s | 4.8 μV | Convective Thermal Oscillation |
| Open Air Chamber Fixture | 125 °C | 2.5 m/s | 14.2 μV | Turbulent Seebeck EMF Generation |
| Insulated Plastic Shield | 125 °C | 0.2 m/s | 1.9 μV | Dielectric Leakage and Air Pockets |
| Isothermal Copper Enclosure | -40 °C | 0.0 m/s (Still Air) | 0.32 μV | Semiconductor Inherent 1/f Noise |
| Isothermal Copper Enclosure | 25 °C | 0.0 m/s (Still Air) | 0.28 μV | Semiconductor Inherent 1/f Noise |
| Isothermal Copper Enclosure | 125 °C | 0.0 m/s (Still Air) | 0.64 μV | Intrinsic Thermally Activated Trapping |
Quantifying front-end noise requires an unyielding sequence of physical operations during environmental testing:
- Chamber thermal soaking demands holding the test chamber setpoint constant until calibrated resistance thermometers on the circuit board confirm temperature stability within five millikelvins over ten minutes.
- Shield grounding verification requires measuring the isolation resistance between the inner isothermal shield and the outer chassis ground to prevent ground loops from injecting line-frequency sub-harmonics.
- Battery power stabilization replaces switching power supplies with sealed lead-acid or nickel-cadmium batteries housed inside the chamber, eliminating line-synchronous low-frequency ripple.
- Baseline thermal record collection records twenty minutes of zero-input baseline data at thermal equilibrium to calculate the Allan deviation floor before applying dynamic transducer excitation.
Conflating environmental chamber turbulence with semiconductor flicker noise leads engineering groups to redesign front-end ASICs when an aluminum shielding enclosure solves the measurement variance.

Extraction
Calculating the true spectral density function from raw digitizer output demands rigorous mathematical partitioning of linear drift from stochastic noise. Sensor front-ends subjected to thermal steps display monotonic baseline drift driven by thermal settling of passive components, package stress relaxation, and thermoelectric stabilization. If a Fast Fourier Transform operates over a raw time-series containing an uncompensated linear slope, the discontinuity between the beginning and end of the finite acquisition window introduces spectral leakage that scales as 1/f2.
This computational artifact completely obscures the underlying 1/f flicker noise profile. Longer recording windows resolve sub-Hertz bins.
Spectral Density Computation across Cryogenic and Elevated Ranges
Allan deviation isolates true drift. While standard power spectral density plots show total noise power distributed across frequency bins, Allan deviation plots the two-sample variance as a function of averaging time τ. In the τ-domain, distinct physical mechanisms yield distinct slopes: white phase noise displays a τ-1 slope, white frequency noise displays τ-1/2, flicker noise forms a flat horizontal plateau independent of τ, and linear temperature drift rises along a steep τ+1 slope.
The minimum of the Allan variance curve identifies the optimal averaging window τopt for front-end calibrations across operating temperatures.
Linear baseline drift masks true low-frequency spectral noise when observation records terminate before capturing twenty full waveform cycles.
Consider a worked verification case evaluating an instrumentation amplifier front-end tied to a 350-ohm thin-film strain gauge bridge. The circuit targets an automotive pressure interface running from -40 degrees Celsius to 125 degrees Celsius, with an operational bandwidth of 0.1 Hz to 10 Hz. The instrumentation amplifier exhibits a flat white noise floor enw = 7 nV/√Hz and a nominal 1/f corner frequency fc = 1.5 Hz at 25 degrees Celsius. The total integrated root-mean-square voltage noise across the band fL = 0.1 Hz to fH = 10 Hz calculates directly through the integration of the noise spectral density function:
Vrms = enw × 1/2
Substituting the ambient baseline values yields an integrated input noise level:
Vrms, 25°C = 7 nV/√Hz × 1/2 = 7 nV × 1/2 = 7 nV × 1/2 = 7 nV × 4.10 = 28.7 nVrms
When the assembly operates at 125 degrees Celsius, laboratory measurements indicate that thermal activation elevates the white noise floor to 9.2 nV/√Hz due to increased silicon resistive channel scattering, while expanding the corner frequency fc to 14 Hz due to activated oxide traps. Recalculating the integrated noise under these elevated conditions exposes the performance shift:
Vrms, 125°C = 9.2 nV/√Hz × 1/2 = 9.2 nV × 1/2 = 9.2 nV × 1/2 = 9.2 nV × 8.62 = 79.3 nVrms
Thermal degradation increases total integrated low-frequency noise by 176 percent, eroding the effective resolution of a 24-bit analog-to-digital converter by more than 1.4 bits without any shift in transducer excitation voltage. The field disputes the universality of the Hooge parameter temperature exponent γ, with empirical foundry studies reporting values ranging between 1.1 and 2.3 for identical 180-nanometer CMOS processes. Engineers must treat published room-temperature flicker noise figures with intense skepticism when sizing front-end dynamic range for wide-temperature operation.
| Domain Metric | Mathematical Formulation | Temperature Dependency Factor | Primary Mechanism |
|---|---|---|---|
| Thermal White Noise | Sv,w = 4 kB T R | Scales linearly with T (Kelvin) | Johnson-Nyquist Electron Agitation |
| Flicker Voltage Density | Sv,f(f) = Kf / (Cox W L fγ) | Scales with trap cross-section σ(T) | Border Trap Energy Modulation |
| Corner Frequency | fc = Kf / (4 kB T R Cox W L) | Shifts upward by 3x to 10x at 125 °C | Disproportionate 1/f Trapping Rise |
| Allan Variance Minimum | σy2(τopt) = 2 ln(2) S0 | Shifts toward shorter τ as T rises | Accelerated Onset of Thermal Drift |
Silicon vendors assert that low-frequency pink noise curves published in typical application notes retain identical shape across the full industrial temperature envelope.

Procurement
Automated test equipment in high-volume semiconductor assembly facilities cannot afford the dwell times necessary to measure sub-Hertz noise phenomena. Extracting a valid power spectral density point at 0.1 Hz demands recording data for at least 100 seconds per device to obtain five averages of twenty-second records. On high-speed tester platforms costing four hundred dollars an hour, allocating one hundred seconds of test time per five-dollar amplifier component destroys factory gross margins.
Automated production testing restricts characterization to wideband noise checks at 1 kHz and static direct current offset limits. Foundry screening skips slow tests.
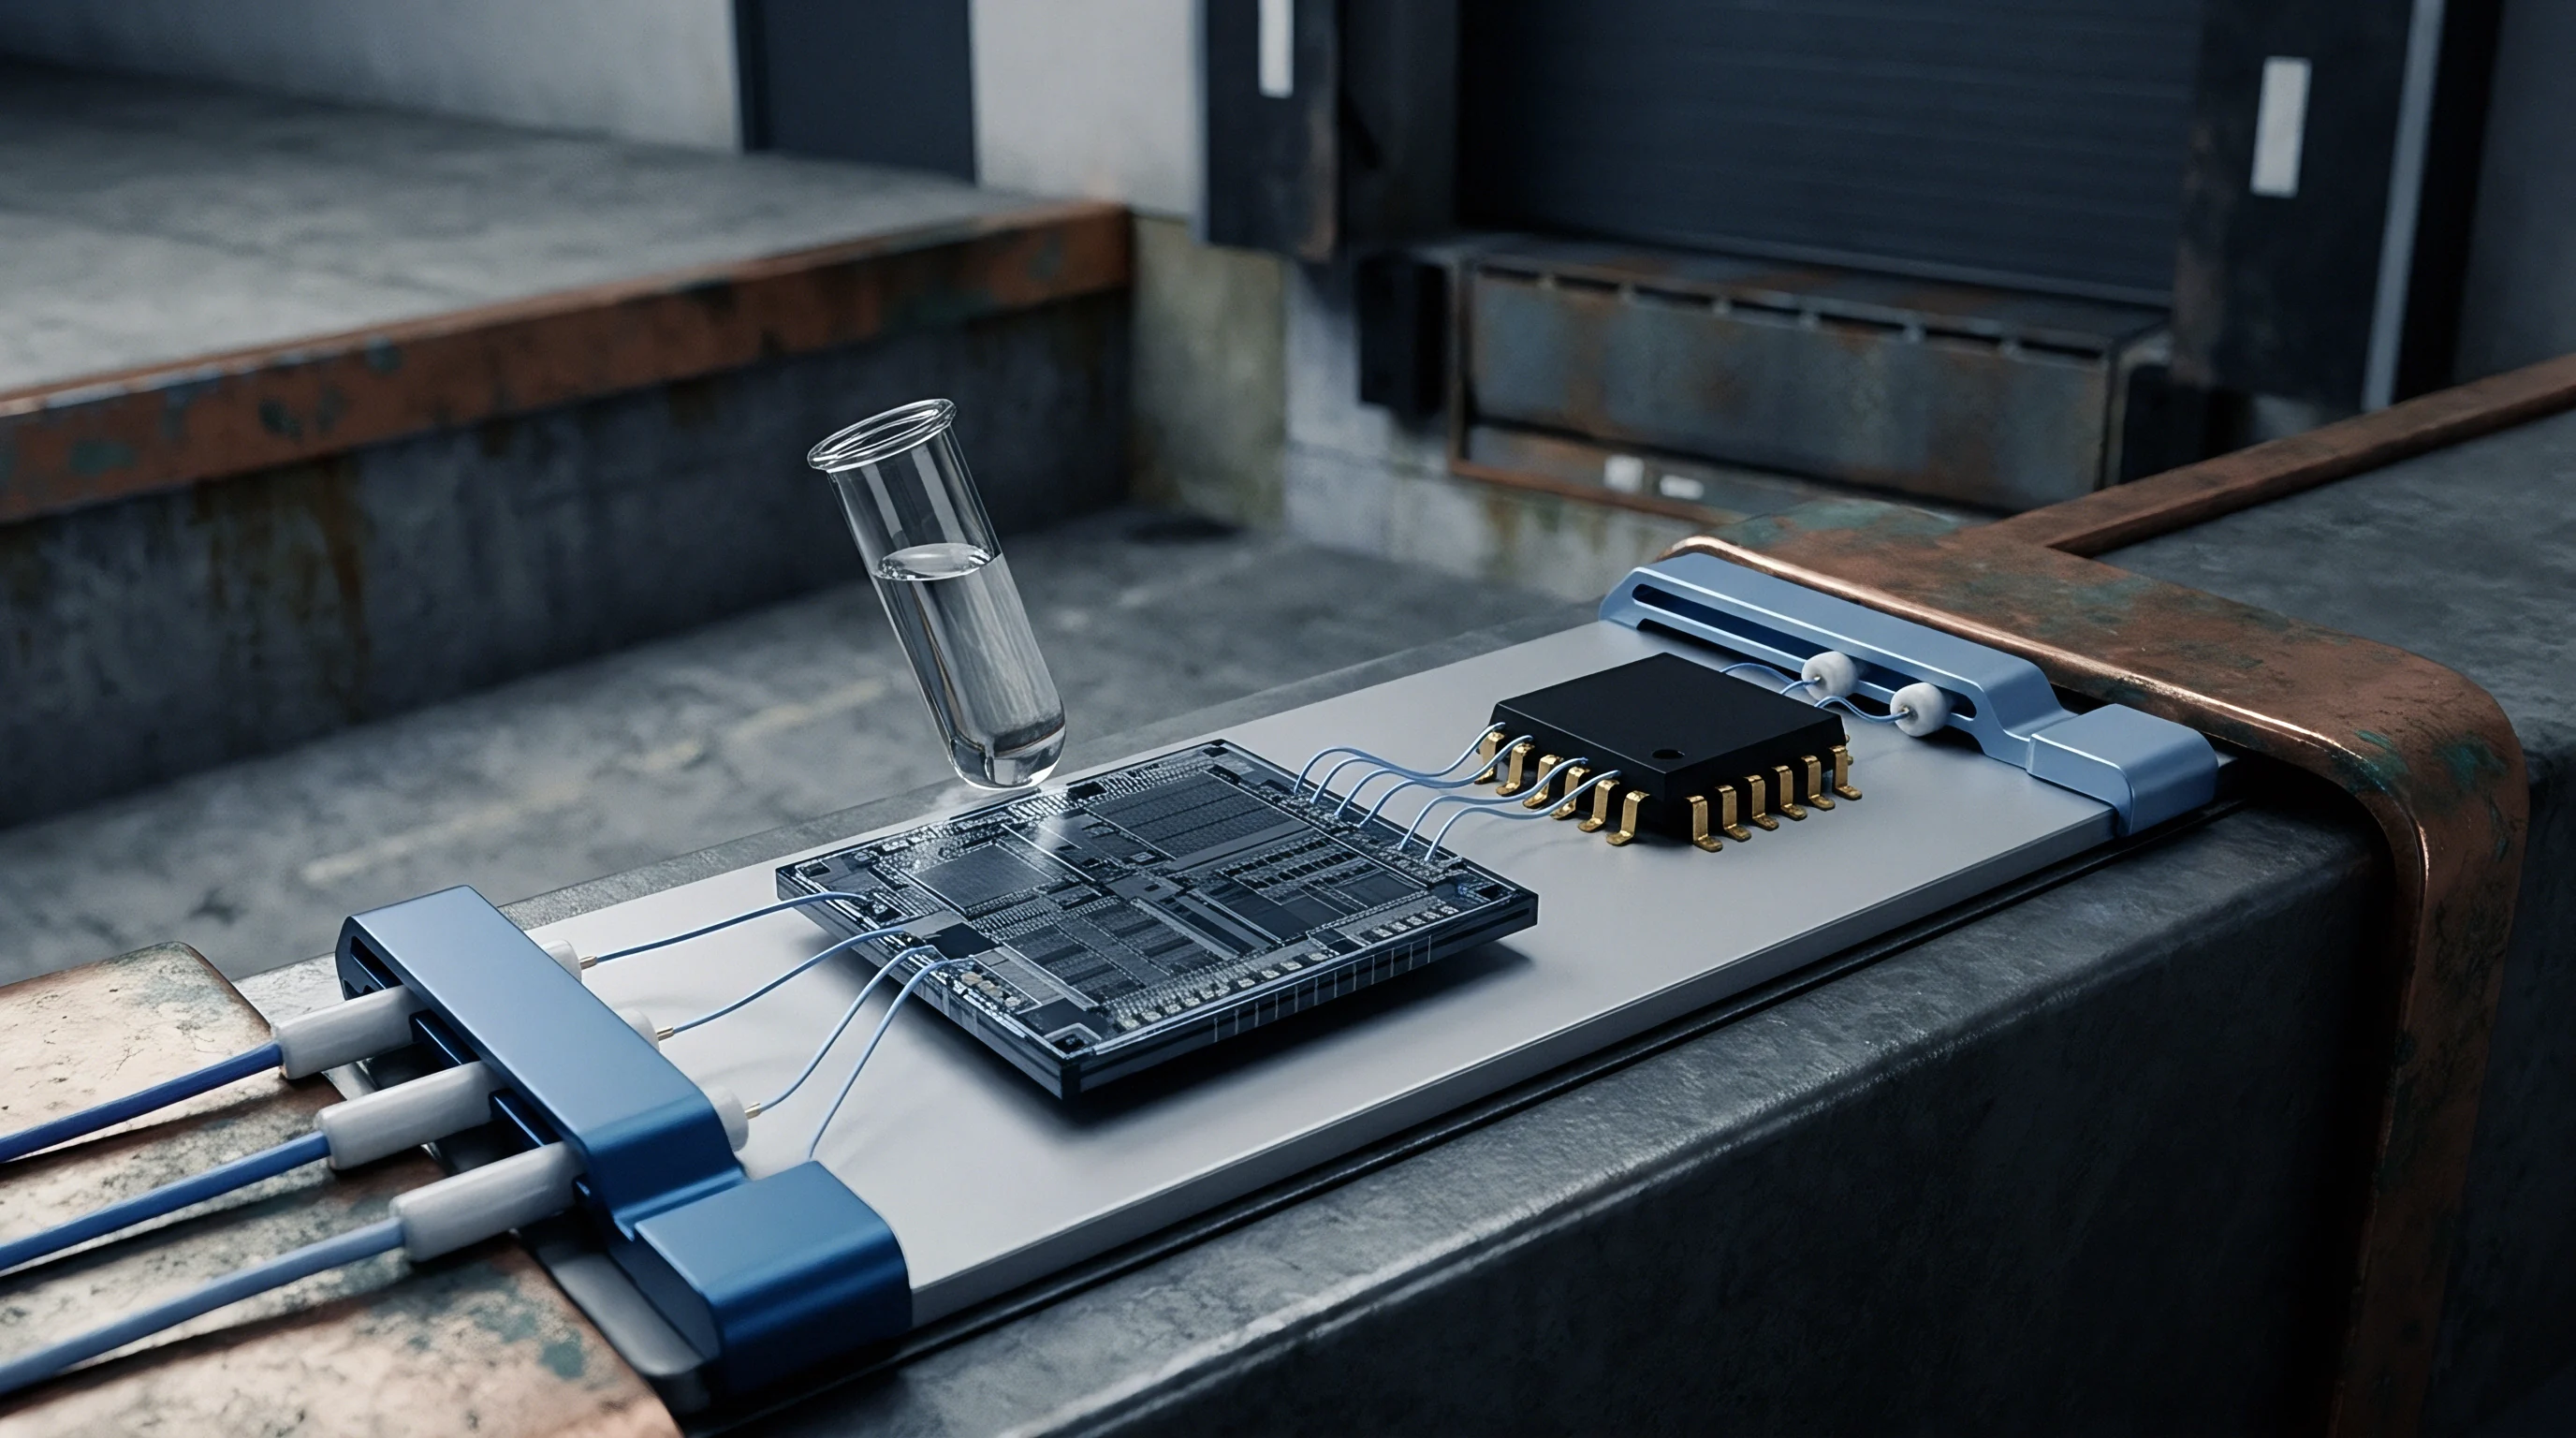
Commercial Qualification and Lot Screening Constraints
Wafer fabrication tolerances introduce wide lot-to-lot variances in oxide charge density and surface state defects. Two successive fabrication runs from the same primary foundry frequently exhibit matching direct current parameters, matching input bias currents, and identical gain-bandwidth figures, while their 1/f noise corner frequencies diverge by more than a factor of five at elevated temperatures. Second sources introduce unexpected variance.
Procuring a drop-in replacement amplifier from an authorized secondary supplier poses severe risks when the application relies on stable low-frequency signal-to-noise ratios. A competitor component boasting identical pin layouts and white noise specifications often incorporates an alternate gate oxide thickness or thermal passivation process, driving the flicker noise floor ten decibels higher under thermal stress.
AEC-Q100 Grade 1 qualification validates device survival and parametric operating windows without guaranteeing low-frequency noise spectral limits below ten hertz.
System architects securing components for harsh-environment sensor front-ends evaluate suppliers against concrete verification criteria:
- Guaranteed maximum low-frequency limits require supplier datasheets to provide statistically bounded limits for 0.1 Hz to 10 Hz peak-to-peak noise across the operating range rather than bare typical values.
- Wafer lot acceptance testing obligates foundries to pull sacrificial sample dies from every diffusion lot to undergo twenty-minute low-frequency spectral burns at 125 degrees Celsius.
- Substrate technology declarations mandate component vendors to disclose changes in base semiconductor foundries, passivation chemistries, or leadframe alloys through formal engineering change notifications.
- Statistical screening guardbands penalize suppliers that calculate room-temperature noise compliance without adding a minimum three-sigma margin to absorb high-temperature flicker noise expansion.
Data points confirm the drift. Yield penalties dictate delivered price. Inserting an explicit low-frequency noise spectral density limit at 1 Hz across the operating temperature range into the component purchase specification forces foundries to bin parts using specialized wafer-level flicker noise sampling rather than generic parametric test vectors.